

Abstract
Introduction
Screening for cognitive deficits is essential in neurodegenerative disease. Screening tests, such as the Montreal Cognitive Assessment (MoCA), are easily administered, correlate with neuropsychological performance and demonstrate diagnostic utility. Yet, administration time is too long for many clinical settings.
Methods
Item response theory and computerised adaptive testing simulation were employed to establish an abbreviated MoCA in 1850 well-characterised community-dwelling individuals with and without neurodegenerative disease.
Results
8 MoCA items with high item discrimination and appropriate difficulty were identified for use in a short form (s-MoCA). The s-MoCA was highly correlated with the original MoCA, showed robust diagnostic classification and cross-validation procedures substantiated these items.
Discussion
Early detection of cognitive impairment is an important clinical and public health concern, but administration of screening measures is limited by time constraints in demanding clinical settings. Here, we provide as-MoCA that is valid across neurological disorders and can be administered in approximately 5 min.
INTRODUCTION
Cognitive impairment is a common, disabling feature of most neurological disorders. Nearly five million individuals in the USA are demented and many more suffer from milder cognitive deficits or subjective complaints.1 The use of cognitive screening measures, including traditional instruments such as the Mini-Mental State Examination (MMSE),2 and newer instruments such as the Six-Item Cognitive Impairment test,3 the General Practitioner Assessment of Cognition4 and Montreal Cognitive Assessment (MoCA),5 is necessary in the ageing population. These tests are easy to administer, correlate with comprehensive neuropsychological performance6 and demonstrate diagnostic utility.7 For example, both the MMSE and MoCA accurately differentiate cognitive impairment (mild cognitive impairment (MCI) or Alzheimer’s disease (AD)) from normal cognitive ageing.8,9 However, recent direct comparisons of these two measures indicate that use of the MoCA results in better overall sensitivity and specificity in AD, MCI10 and Parkinson’s disease (PD).11 Yet, administration of these screens are far from routine in primary care settings.12
In addition to higher sensitivity and specificity in diagnostic classification, the MoCA has several other benefits over many other screening measures. The MoCA is more sensitive to early changes in cognitive ability across domains, as it includes more robust measures of visuospatial and executive function,5 is robust to depression symptoms within healthy cohorts,13 and is available in several languages. Total administration time of the MoCA ranges between 10–15 min, however, this amount of time may be suboptimal in many clinical settings.14 Unlike the MMSE, which has several abbreviated forms, there is a dearth of psychometric analysis of item-wise performance on the MoCA. The three published brief versions of the MoCA suffer from small sample size,13,15 applicability within a limited clinical sample (vascular dementia13 or Alzheimer’s type dementia15,16 only), and use of suboptimal psychometric techniques. Consequently, accurate generalisation of these brief forms to other neurological samples is challenging. Thus, a brief, validated, universal short form MoCA (s-MoCA) that maintains neurological diagnostic utility is needed for broader clinical use.
Here, we aim to create a brief version of the MoCA that will be valid across neurological disorders. We administered the MoCA to 1850 individuals with and without neurological impairment and recorded item-level responses. Item response theory (IRT17) was used along with computerised adaptive testing (CAT) analytic techniques18 to construct a s-MoCA.
METHODS
Study population
All participants were recruited from the Penn Memory Center (PMC) and Clinical Core of the University of Pennsylvania’s Alzheimer’s Disease Center (ADC), the Parkinson’s Disease and Movement Disorders Center at the University of Pennsylvania, the Parkinson’s Disease Research, Education and Clinical Center (PADRECC) at the Philadelphia Veterans Affairs Medical Center from 2008 to 2015. Diagnostic assessments included history, physical and neurological examinations conducted by experienced clinicians, including review of neuroimaging, neuropsychological (including MMSE) and laboratory data. On the basis of these data, a consensus diagnosis was established using standardised clinical criteria.10 The MoCA was not used during consensus. The inclusion sample spanned many neurological conditions (table 1). Healthy older individuals (healthy controls (HCs)) were recruited and assessed similarly to neurological patients.10 Participant characteristics and performance on screening measures are reported in table 1. The Institutional Review Board at each participating institution approved the study, and written informed consent was obtained from participants prior to study participation. Comparison of demographic characteristics in table 1 were performed in the R Statistical Package (V.3.0.3; R-Core-Team. R: a language and environment for statistical computing. Vienna, Austria: R Foundation for Statistical Computing, 2012) using either general linear models with follow-up pairwise comparisons or χ2 tests. These results are reported in the footnote of table 1.
Table 1.
Participant demographics and MoCA performance
| N | Age M (SD) years | Gender F/M | Caucasian (%) | Education M (SD) years | MoCA score M(SD) (range 0–30) | s-MoCA* score M(SD) (range 0–16) | |
|---|---|---|---|---|---|---|---|
| All neurological diagnoses† | 1675 | 70.00 (10.15) | 783/888 | 85 | 15.12 (3.37) | 21 (7) | 9 (4) |
| AD | 354 | 75.96 (8.19) | 228/126 | 71 | 13.71 (3.90) | 14 (6) | 5 (3) |
| MCI | 117 | 73.50 (8.81) | 59/58 | 79 | 14.95 (3.66) | 21 (4) | 9 (3) |
| PD | 690 | 64.84 (9.68) | 267/423 | 94 | 15.99 (2.65) | 25 (4) | 12 (3) |
| PD-dementia‡ | 91 | 70.66 (8.34) | 27/63 | 92 | 15.50 (2.70) | 21 (5) | 9 (4) |
| HC | 175 | 71.96 (9.34) | 116/59 | 80 | 16.02 (2.71) | 27 (2) | 14 (2) |
All significant pairwise comparisons p<0.01.
Age: HC>all neuro; HC<AD; HC>PD; AD>MCI; MCI=HC; PD<PDD.
Sex: HC≠all; HC=AD; AD≠MCI; MCI≠HC; PD≠HC; PD=PDD.
Race: HC=all neuro=MCI; AD≠HC; AD=MCI; PD≠HC; PD=PDD.
Education: HC>all neuro, AD, and MCI; HC=PD=PDD.
MoCA: HC>all neuro, AD, MCI, PD, and PDD; MCI>AD; PD>PDD.
s-MoCA: HC>all neuro, AD, MCI, PD, and PDD; MCI>AD; PD>PDD.
Maximum score=16.
All individuals with at least one neurological condition. 220 individuals had other neurological diagnoses (see figure 2); 107 individuals qualified for multiple clinical diagnoses; 96 individuals were not healthy, but had indeterminate diagnosis at the time of MoCA testing.
Dementia in PDD participants was determined either through a consensus process19 criteria for PDD, or was made by an experienced movement disorders neurologist.
AD, Alzheimer’s disease; F, female; HC, healthy control; M, male; MCI, mild cognitive impairment; MoCA, Montreal Cognitive Assessment; PD, Parkinson’s disease; PDD, PD with dementia; s-MoCA, short form MoCA.
Utility of IRT and CAT for construction of s-MoCA
We implemented a published method20 that incorporates both IRT and CAT analytics to determine a s-MoCA. Here, we briefly summarise the statistical method. IRT offers a methodology to improve instruments by determining the discrimination and difficulty of any given item. Using IRT to construct more efficient versions of instruments is advantageous as it increases reliability and structural validity, which are often lacking when short forms are constructed with other methods (eg, odd-even splits of items21). Moreover, applying IRT to CAT, which tailors difficulty levels to specific test takers based on their continually estimated abilities, helps further shorten administration time by avoiding administration of items that do not offer valuable information about specific individuals.22,23 That is, the same algorithm that ‘chooses’ items to administer during a CAT session can be used to select items that are the most highly discriminating and appropriately difficult for most people (and should therefore be selected for the short form).
We used the Graded Response Model (GRM24), an IRT approach capable of handling items with only two response categories (dichotomous) and items with multiple response categories (polytomous) on the same test. For the MoCA, all items are scored dichotomously (correct/incorrect) except clock draw (three possible points), serial subtraction (three possible points) and delayed recall (five possible points). To test for sufficient unidimensionality for IRT,18 we examined the scree plot for the polychoric correlation matrix, the ratio of first to second eigenvalues and the fit indices of the unidimensional factor model. The GRM was fit to obtain item parameter estimates to be used in CAT simulation. All IRT models were estimated using the irt. fa() command from the psych library25 within the R Statistical Package (V.3.0.3; R-Core-Team, 2012).
Selection of items for the s-MoCA was achieved using simulated CAT. The overall goal of CAT is to avoid administering items that provide very little information about an examinee (for review, see ref. 17). In its traditional form, CAT continually updates information about an examinee’s performance to determine the next best item to present to that individual. The ‘most appropriate’ item is then administered, and information about the examinee’s performance is updated until the examinee responds incorrectly to an item. Next, items within that difficulty range are administered until a stopping criterion is met (eg, the examinee’s SE of measurement (SEM) reaches some lower threshold).
We applied CAT to the standard version of the MoCA to determine which items to include in the s-MoCA. For example, if some items are found to have low utility—either because they are too difficult/easy or because their discrimination is poor—those items can be removed from the MoCA with little loss of fidelity. Firestar,26 a CAT simulation programme, was used to simulate CAT sessions using the full MoCA as the item bank and to select the most useful items for a short form. All simulations described were performed using real data simulation, which avoids the false normal distribution imposed on simulated data; results were similar regardless of which data type was used. Although it is not necessary using this method of test shortening, for thoroughness we opted to take the additional step of cross-validation. Specifically, we implemented the shortening procedure in one random half of the sample and left the other half for validation by logistic regression (see ‘cross-validation of s-MoCA’ in online supplementary methods and results). The items selected in this process were the same as those selected using the full sample.
The full sample (n=1850) of examinees was used to create the s-MoCA. A higher frequency of administration in the IRT/CAT method described above indicated useful items from the MoCA based on an item’s discrimination and appropriate difficulty. The final item administered to any given examinee was determined by a stopping rule for the simulated CAT session; this rule was that the IRT-calculated SEM for the examinee had to reach the reliability-based SEM of the full form of the test (0.36). If an examinee’s SEM failed to reach 0.36, all items were administered. Last, item administration frequencies were used to categorise items into ‘useful’ and ‘not useful’ using k-means clustering.27 Follow-up analyses within only AD and PD subsamples were performed using the same methodological approach. Healthy individuals were included in all simulations.
Scores from the s-MoCA were entered into logistic regression models, and receiver operating characteristic (ROC) curves with 95% CIs computed with 2000 stratified bootstrap replicates (R package ‘pROC’28) are created to compare diagnostic classification accuracy. We report sensitivity and specificity for area under the curve (AUC’) greater than 0.50. Accuracy of the MoCA, s-MoCA and Horton version were compared using Delong method of comparing two AUCs29 within the proc R package (X Robin, N Turck, A Hainard, et al. Display and analyaze ROC curves (‘pROC’). R package version 1.7.3 ed. 2014). Z-statistics and the corresponding p value were estimated for pairwise AUC comparisons. Finally, the s-MoCA was compared with a recently published shortened version that was derived in an AD-only/MCI-only sample.16
RESULTS
The first step in applying a unidimensional IRT model is to establish that the test is ‘unidimensional enough’.30,31 The high ratio of first to second eigenvalues (9.6), examination of the scree plot (see online supplementary figure S1) and parallel analysis32 all indicate that the MoCA is highly unidimensional. IRT and CAT of the MoCA across a large neurological sample identified eight items with high discriminations and sufficiently variable difficulties to discriminate between affected and healthy individuals (table 2 and see online supplementary table S1). Selected items included clock draw, serial subtraction, orientation (place), delayed recall, abstraction (watch), naming (rhinoceros), trail making and lexical fluency. Using only these items, an s-MoCA was constructed with a score range from 0 to 16 (see online supplementary appendix figure S1).
Table 2.
Item usage and selection in the CAT for s-MoCA for full, AD and PD samples
| MoCA item | Domain | Full sample
|
Alzheimer’s sample
|
Parkinson’s sample
|
|||
|---|---|---|---|---|---|---|---|
| Usage (%) | Short form | Usage (%) | Short form | Usage (%) | Short form | ||
| Clock draw* | Visual/executive | 100 | X | 100 | X | 100 | X |
| Serial subtraction* | Attention | 100 | X | 100 | X | 100 | X |
| Orientation (place) | Orientation | 98 | X | 68 | X | 100 | X |
| Recall* | Memory | 90 | X | 55 | X | 100 | X |
| Abstraction (watch) | Abstraction | 86 | X | 65 | X | 100 | X |
| Naming (rhino) | Naming | 83 | X | 45 | – | 100 | X |
| Trail making | Visual/executive | 80 | X | 56 | X | 100 | X |
| Language fluency | Language | 76 | X | 39 | – | 100 | X |
| Orientation (day) | Orientation | 72 | – | 29 | – | 100 | X |
| Attention (letters) | Attention | 72 | – | 42 | – | 100 | X |
| Cube copy | Visual/executive | 71 | – | 33 | – | 100 | X |
| Abstraction (train) | Abstraction | 65 | – | 31 | – | 97 | |
| Orientation (month) | Orientation | 64 | – | 49 | – | 99 | X |
| Language (John) | Language | 63 | – | 27 | – | 100 | X |
| Language (cat) | Language | 59 | – | 28 | – | 99 | X |
| Orientation (year) | Orientation | 56 | – | 59 | X | 95 | |
| Digit backwards | Attention | 55 | – | 28 | – | 99 | X |
| Naming (camel) | Naming | 54 | – | 39 | – | 97 | |
| Orientation (city) | Orientation | 52 | – | 30 | – | 100 | X |
| Digit forwards | Attention | 51 | – | 27 | – | 100 | X |
| Naming (lion) | Naming | 50 | – | 35 | – | 98 | X |
The orientation (date) item was excluded from analysis due to complete overlap with other orientation items.
Polytomous items.
AD, Alzheimer’s disease; CAT, computerised adaptive testing; MoCA, Montreal Cognitive Assessment; PD, Parkinson’s disease.
Scores on the s-MoCA were correlated with the standard MoCA (Pearson r=0.959 (95% CI 0.956 to 0.962)). These eight items were administered in a majority of individuals (range 72–100%) during CAT simulation, emphasising the utility of each item (table 2 and see online supplementary figure S2). A cross-validated analysis resulted in selection of the same eight items (see online supplementary results and methods: cross-validation of s-MoCA, and online supplementary table S2 and figure S3). Follow-up item analysis and CAT simulation in the AD sample indicated seven items were useful in differentiation of AD from HC; six of these items overlapped with the s-MoCA (table 2). One alternative item improved the AD-only version: orientation (year). The short PD version consisted of most items from the standard MoCA (90% overlap). In fact, only two items from the standard MoCA were considered not useful and thus removed in the short PD version: orientation (year) and naming (camel).
Performance of the s-MoCA in broad neurological sample
In the full neurological sample, s-MoCA scores followed the same pattern as the standard MoCA (table 1). On average, s-MoCA scores were lower in affected individuals compared with HC. The AUC of the ROC of the s-MoCA was high, but lower than the full MoCA (z=5.43, p<0.001; table 3 and figure 1A). The optimal cut-off score of the s-MoCA was <12 and the classification accuracy was 64%; 2% higher than using the standard MoCA—likely due to the improvement in sensitivity. The s-MoCA outperformed a previous short form version of the MoCA16 with higher AUC values (z=5.58, p<0.001) and had higher classification accuracy (table 3). Average scores on the standard MoCA and s-MoCA are shown in figure 2 for multiple neurological disorders.
Table 3.
Diagnostic parameters for the MoCA and short form MoCA in the full sample, AD, MCI, PD and PDD
| Full sample vs HC | AD vs HC | MCI vs HC | PD vs HC | PDD vs PD | ||
|---|---|---|---|---|---|---|
| MoCA | AUC (±95% CI*) | 0.83 (0.81 to 0.86) | 0.99 (0.99 to 1.00) | 0.94 (0.91 to 0.96) | 0.72 (0.68 to 0.75) | 0.69 (0.65 to 0.77) |
| Sensitivity/specificity | 0.57/0.97 | 0.95/1.00 | 0.91/0.80 | 0.52/0.80 | 0.69/0.64 | |
| Youden index | 0.56 | 0.94 | 0.71 | 0.32 | 0.33 | |
| Cut-off score | 24 | 23 | 26 | 26 | 24 | |
| PPV/NPV | 0.99/0.21 | 1.00/0.90 | 0.75/0.93 | 0.92/0.28 | 0.94/0.21 | |
| Classification accuracy | 61% | 96% | 84% | 58% | 68% | |
| Short form MoCA | AUC (±95% CI) | 0.79 (0.76 to 0.82)† | 0.99 (0.99 to 1.00) | 0.92 (0.89 to 0.95) | 0.67 (0.63 to 0.70)† | 0.71 (0.66 to 0.77) |
| Sensitivity/specificity | 0.62/0.86 | 0.96/0.93 | 0.84/0.86 | 0.40/0.86 | 0.63/0.69 | |
| Youden index | 0.51 | 0.89 | 0.70 | 0.28 | 0.32 | |
| Cut-off score | 12 | 11 | 12 | 12 | 12 | |
| PPV/NPV | 0.98/0.20 | 0.97/0.92 | 0.80/0.89 | 0.92/0.25 | 0.94/0.20 | |
| Classification accuracy | 64% | 95% | 85% | 48% | 64% | |
| Horton et al short form MoCA‡ | AUC (±95% CI) | 0.75 (0.72 to 0.78)†§ | 0.99 (0.98 to 0.99) | 0.90 (0.86 to 0.94)† | 0.39 (0.35 to 0.43)†§ | 0.71 (0.65 to 0.76) |
| Sensitivity/specificity | 0.52/0.93 | 0.93/0.97 | 0.73/0.93 | –¶ | 0.54/0.78 | |
| Youden index | 0.45 | 0.90 | 0.66 | –¶ | 0.32 | |
| Cut-off score | 10 | 9 | 10 | –¶ | 11 | |
| PPV/NPV | 0.99/0.17 | 0.99/0.87 | 0.87/0.84 | –¶ | 0.94/0.18 | |
| Classification accuracy | 56% | 95% | 85% | –¶ | 57% | |
All statistics are based on the s-MoCA (eight-item) version.
CIs estimated using DeLong method and n=2000 bootstraps.
Significantly lower than the standard MoCA in permutation testing of AUC using roc.test function in R package pROC (p<0.005).
Eight-item test; score range=0–14.
Significantly lower than the short form MoCA in permutation testing of AUC using roc.test function in R package pROC (p<0.005).
Analysis fails to converge due to poor predictive power (see figure 1D); statistical comparison was estimated for AUC.
AD, Alzheimer’s disease; AUC, area under the curve; HC, healthy control; MCI, mild cognitive impairment; MoCA, Montreal Cognitive Assessment; NPV, negative predictive value; PD, Parkinson’s disease; PDD, PD with dementia; PPV, positive predictive value; s-MoCA, short form MoCA.
Figure 1.
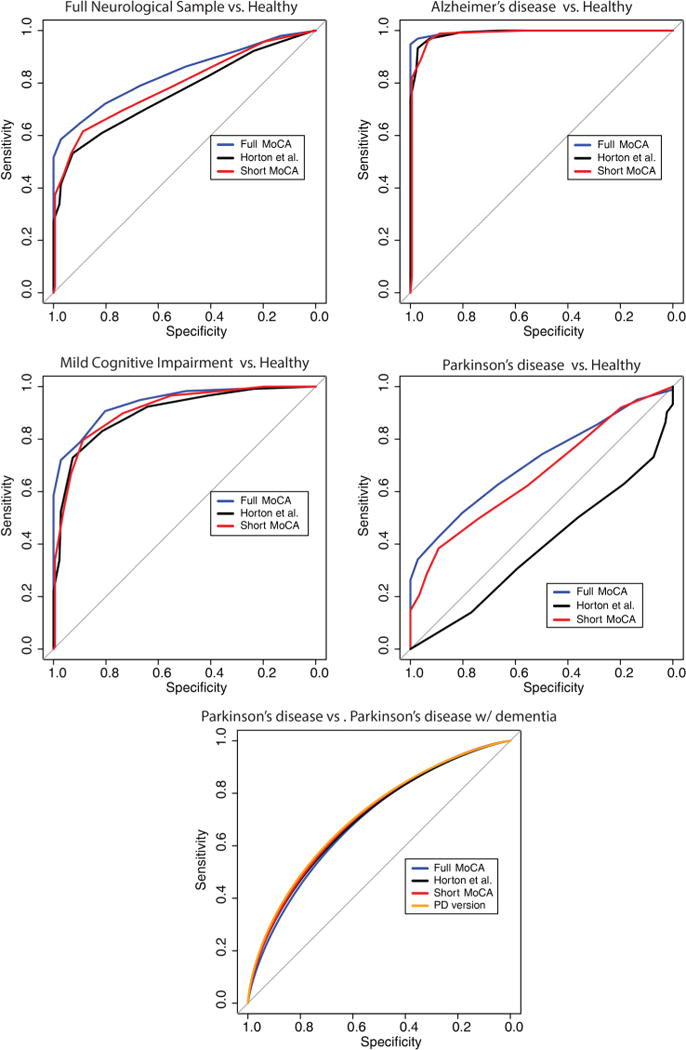
Receiver operator characteristic curves for the standard MoCA, our short form MoCA and a previously published short version MoCA (Horton et al). The short form MoCA derived in the current sample corresponds with the standard 30-item MoCA and shows more generalisable properties than previous versions. The validity of the short form MoCA was tested in several categorical diagnoses including AD, MCI, PD and PDD. AD, Alzheimer’s disease; MCI, mild cognitive impairment; MoCA, Montreal Cognitive Assessment; PD, Parkinson’s disease; PDD, PD with dementia.
Figure 2.
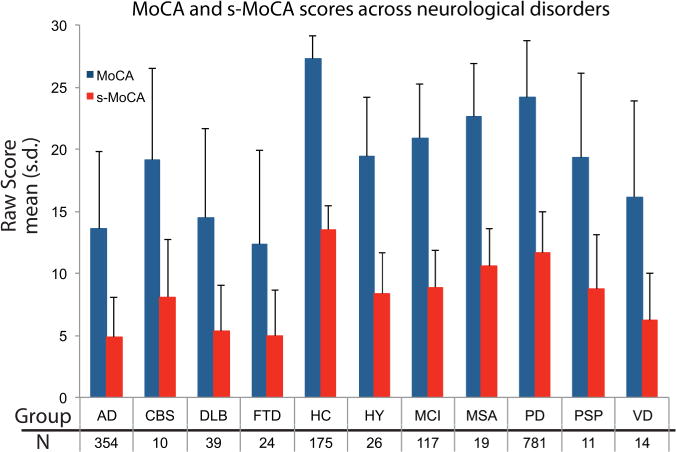
Standard and s-MoCA scores (mean±SD) for 10 neurological disorders and healthy individuals. The s-MoCA shows a similar pattern as compared with the standard version across these disorders. AD, Alzheimer’s disease; CBS, Corticobasal Syndrome; DLB, Lewy body dementia; FTD, Frontotemporal dementia; HC, healthy control; HY, Hydrocephalus; MCI, mild cognitive impairment; MoCA, Montreal Cognitive Assessment; MSA, Multiple systems atrophy; PD, Parkinson’s disease; PSP, Progressive supranuclear palsy; s-MoCA, short form MoCA; VD, Vascular dementia.
s-MoCA in an AD sample
Patients with AD scored lower on the s-MoCA compared with MCI or HC (table 1). The AUC of the s-MoCA was high (0.99) and did not differ from the standard MoCA (table 3 and figure 1B). The optimal cut-off score of the s-MoCA was <11 and the classification accuracy was 95%. In the MCI sample, the AUC of the s-MoCA did not differ from the standard MoCA and classification accuracy was nominally higher (figure 1C). The optimal cut-off score was <12. The s-MoCA performed nominally, but not statistically, better than a previous short form version of the MoCA in the AD and MCI sample16 (table 3); the standard MoCA significantly outperformed the Horton et al s-MoCA (z=3.03, p=0.002). In accordance with previous studies, we show that the MoCA (0.83) and s-MoCA (0.82) have lower AUCs when differentiating AD from MCI; the difference in AUC was weak, but significant (z=2.04, p=0.04; see online supplementary figure S4). The AD group was older than the HC group; however, when the groups were matched for age, the results did not change. Finally, the AD-specific version of the s-MoCA (seven-item) did not differ from the s-MoCA (eight-item) derived from the full neurological sample in its AUC or classification accuracy.
s-MoCA in a PD sample
Patients with PD scored lower on the s-MoCA as compared with HC (table 1). The AUC of the s-MoCA was moderate (0.67) and was lower than the standard MoCA (table 3 and figure 1D). The optimal cut-off score of the s-MoCA was <12 and the classification accuracy was 48%. However, in the comparison of PD versus PD with dementia (PDD), the AUC of the s-MoCA was higher 71% and nominally higher than the standard MoCA. The optimal cut-off score was <12. Both the standard MoCA (D=8.88, p<0.001) and the s-MoCA (D=6.97, p<0.001) had higher AUC as compared with the Horton et al16 s-MoCA (table 3). The AUC for the Horton et al short form was under 0.50. All versions performed similarly when differentiating PD from PDD. Use of the PD version of the s-MoCA (18-item) was not significantly different from the s-MoCA (figure 1E).
DISCUSSION
The need for adequate screening of cognitive impairment is vital given the rapid growth of the elderly population. In order to serve this need, efficient and robust cognitive screening is needed as part of routine clinical check-ups.33 However, current screening measures are often too long for use in routine clinical setting and often suffer from low generalisability and low sensitivity to subtle cognitive impairment.10 Many cognitive screening measures exist; the MMSE and MoCA are two of the most common. While the MMSE is a screening stalwart, recent evidence indicates that the MoCA may supplant the MMSE as the standard in the field of cognitive screening.10,11
Yet, the standard MoCA can take up to 15 min for administration. Thus, to expand the use of the MoCA as a pre-eminent cognitive screening tool, a generalisable short version that maintains the diagnostic utility of the full form is needed. Using a sophisticated approach of IRT and CAT analytics in 1850 individuals, we establish a s-MoCA comprised of eight items, which takes approximately 5 min to administer. In fact, average time of the s-MoCA in a pilot sample of 14 young individuals was 4 min and 22 s, nearly half of the standard MoCA, and the average delay between the immediate memory question and the delayed memory question was 3 min and 28 s, which is longer than average MMSE administration (see online supplementary methods and tables S3 and S4). This short form is comparable to the standard MoCA and outperforms another short version of the MoCA, which was derived from an only AD/MCI sample. Finally, we provide generalisable cut-off scores for neurological populations as a whole.
Items selected for the s-MoCA span several neurocognitive domains, a direct reflection of the standard MoCA. In fact, at least one item from each domain is included in the s-MoCA. The clock drawing test (CDT) and serial subtraction are the two most useful items in the short form. The CDT is widely used in screening for dementia; incorporates functions spanning several neurocognitive domains; is thought to have less educational bias than the MMSE; is an item included on the MoCA, but not the traditional MMSE; and previous work advocates for its use in the clinic (for review see ref. 34).
Serial subtraction, a measure of complex attention, is identified as an item that differentiates between AD and MCI individuals5 and individuals with vascular dementia from healthy35 on the MoCA. Furthermore, one previous s-MoCA identifies this item as discriminating among individuals. The inclusion of serial subtraction along with orientation (place) and delayed recall as useful items corroborates previous work demonstrating the ability of these items to reliably detect cognitive impairment.16
The Trail Making Test (TMT) is among the most frequently used neuropsychological tasks due to its sensitivity to changes in neurological function.36 The TMT is frequently described as an executive functioning task; however, it incorporates several aspects of cognition including psychomotor speed, visual scanning and set switching. Naming and lexical word-list generation (fluency) patterns also aid in the differential diagnosis of AD and MCI37 and in non-medicated patients with PD.38 The inclusion of these items re-emphasises the sensitivity of the MoCA, particularly to early changes in cognitive ability due to the inclusion of robust measures that span many neurocognitive domains.5 Moreover, several of these tests, if not the MoCA itself, are included in lengthier neurocognitive batteries recommended by recent harmonisation projects across several neurological disorders.39,40
Calculating an s-MoCA score results in robust clinical differentiation across neurological conditions. Performance of the s-MoCA is best in frank dementia and MCI. While the s-MoCA loses sensitivity by using fewer items, specificity actually improves the overall classification accuracy—this gain is likely attributable to administering fewer uninformative items. Within AD and MCI, the s-MoCA is nominally better than a recently derived s-MoCA,16 further validating our short form. Better performance of the s-MoCA is likely due to the inclusion of larger samples of AD and HC individuals, better generalisability due to its calculation in a more diverse clinical sample and the use of IRT/CAT. The MoCA is more sensitive than the MMSE in several disorders including MCI,5,10 PD,11 frontotemporal dementia13 and vascular dementia.41 This is likely due to the use of more words during memory testing and fewer learning trials. In addition, the range of executive processes, language abilities and visuospatial processing assessed in the MoCA improves its generalisability to various disorders with heterogeneous presentations of mild dementia. Importantly, we show that the s-MoCA parallels the conventional MoCA in many of these disorders (figure 2), which is likely a reflection of the demanding nature of the item selected.
Improvement in utility was evident in the full neurological sample and in the differentiation of PD from HC. In the full sample, the s-MoCA has a moderate AUC, but was significantly better than the Horton et al16 version at identifying impairment. In PD, the s-MoCA is a vast improvement over the previous s-MoCA. While the AUC and classification accuracy are in the low-to-moderate range, our s-MoCA is comparable to the full MoCA for PD versus HC and provides higher classification accuracy in differentiating PDD from PD. In fact, scores derived from Horton et al16 provide no diagnostic utility in PD as it identified many healthy individuals as PD, and vice versa. While cognitive dysfunction is not the primary symptom in PD, being able to detect subtle change in cognitive performance is critical to disease management. Cognitive dysfunction is one of the earliest, most common and most disabling non-motor symptoms in PD.11 The long-term prevalence of PDD is approximately 80% and MCI is reported in 25–30% of non-demented patients with PD.42 Thus, we show the utility of s-MoCA by providing a robust, short version that parallels the full version and is generalisable to many neurological disorders. Importantly, administration time of the s-MoCA is more appropriate for clinical settings.
Our use of a large, well-characterised, community-dwelling neurological cohort provides a useful perspective for determining the diagnostic accuracy of a standardised shortened form of the MoCA. However, this study is not without limitations. The influence of comorbid clinical factors, such as depression, was not considered but could impact the s-MoCA. However, the full MoCA is robust to these issues;13 thus, we expect similar properties in the s-MoCA. The sample was well educated, potentially reducing generalisability to a less well-educated cohort.13 However, there is debate in the literature about the influence of education on MoCA scores and the conventional correction (+1 point for ≤12 years of education) in the MoCA.43 Education level is predictive of MoCA and shows good predictive value for impairment; yet, the specificity and sensitivity varies across educational level.35 In fact, the MoCA showed the lowest sensitivity in a group of highly educated individuals, suggesting that higher levels of education actually reduce the discriminability of the MoCA.35 Yet, specific items were excellent at discriminating across all education backgrounds, including the TMT and orientation items, both of which were selected as part of our s-MoCA. Finally, the full MoCA is highly reliable in low-educated samples, even when administered in other languages.44 While our sample was a highly educated sample, our short form includes items that best differentiate impairment from no impairment across educational background. Prospective testing of the s-MoCA in individuals with high and low education is needed to better understand the influence of education, premorbid functioning and applicability to other languages and cultures. The sample size of specific diagnoses was adequately large; however, more precise cut-off values could be achieved with larger samples. Patients with PD accounted for a large proportion of the neurological sample, which could bias our results. However, short version of the MoCA derived specifically within the AD sample did not differ from the s-MoCA. Moreover, a PD-specific test indicated that most of the items from the MoCA should be used in a PD sample. Specific demographic features (age, gender, race, culture, SES) could be further parsed out with more comprehensive samples. Finally, future work should utilise the s-MoCA to validate its use as a free-standing screening measure. We believe that the results of this study provide practical results for shortening a well-utilised standardised screen for cognitive dysfunction while maintaining diagnostic effectiveness.
Early detection of cognitive impairment is becoming an important clinical and public health concern. The benefits of early detection are immense, and include, but are not limited to: (1) the identification of clinical and daily functioning concerns (eg, falls, driving); (2) providing patients and families an opportunity to plan ahead medically, financially and legally; (3) offering early screening once disease-modifying therapies for neurocognitive disease become available; and (4) reducing long-term healthcare costs.45 Cognitive screening is an initial step in a delicate process of assessing for cognitive dysfunction. While there is significant need for reliable, easy-to-administer screening tools, care must be taken to reduce false positives that may increase patient stress and potential stigma.46 As early detection becomes more necessary, well-validated measures such as the s-MoCA can provide clinicians an efficient tool with which to routinely screen patients to better identify those in need of specialised care or more comprehensive neuropsychological assessment.
Supplementary Material
Acknowledgments
The authors express appreciation to the research participants and staff of the Penn Memory Center/Clinical Core of the University of Pennsylvania Alzheimer’s Disease Center, the Parkinson’s Disease and Movement Disorders Center at the University of Pennsylvania, the Parkinson’s Disease Research, Education and Clinical Center (PADRECC) at the Philadelphia Veterans Affairs Medical Center and general neurology clinic at the University of Pennsylvania. The authors would also like to thank Alexis M Galantino for her assistance in administering the s-MoCA to establish time of testing.
Funding: This work was supported by NIA AG10124, NIMH K01 MH102609 (DRR), the Marian S Ware Alzheimer’s Program/National Philanthropic Trust, and the Institute of Aging and Alzheimer’s Disease Core Center Pilot Funding Program (DRR). University of Pennsylvania Center of Excellence for Research on Neurodegenerative Diseases (CERND). Penn Udall Center grant: NINDS P50-NS-053488.
Footnotes
Additional material is published online only.
Contributors DRR was involved in drafting/revising the manuscript, study concept or design, analysis or interpretation of data, accepts responsibility for conduct of research and will give final approval, acquisition of data, statistical analysis, study supervision. DRR takes the role of principal investigator, has access to all of the data and takes responsibility for the data, accuracy of data analysis and conduct of the research. DRR acknowledges and shares equal contribution as first author with TMM. DRR will serve as the corresponding author. TMM was involved in drafting/revising the manuscript, study concept or design, analysis or interpretation of data, accepts responsibility for conduct of research and will give final approval, acquisition of data, statistical analysis. TMM acknowledges and shares equal contribution as first author with DRR. DAW and SEA were involved in study concept or design, accepts responsibility for conduct of research and will give final approval, study supervision, obtaining funding. DM-H, JR and SK were involved in aggregation of data, analysis or interpretation of data, accepts responsibility for conduct of research and will give final approval. KR was involved in analysis or interpretation of data, statistical analysis, and accepts responsibility for conduct of research and will give final approval, acquisition of data. ASC-P, LMC, NAD and JED accept responsibility for conduct of research and will give final approval, study supervision, obtaining funding. DAW was involved in study concept or design, accepts responsibility for conduct of research and will give final approval, study supervision, obtaining funding. PJM was involved in drafting/revising the manuscript, study concept or design, analysis or interpretation of data, accepts responsibility for conduct of research and will give final approval, study supervision.
Competing interests None declared.
Patient consent Obtained.
Ethics approval Institutional Review Board at the University of Pennsylvania and Philadelphia Veterans Affairs Center.
Provenance and peer review Not commissioned; externally peer reviewed.
Data sharing statement Additional data are included in the online supplementary appendix and materials. Data and statistical code for are available on request.
References
- 1.Hebert LE, Weuve J, Scherr PA, et al. Alzheimer disease in the United States (2010–2050) estimated using the 2010 census. Neurology. 2013;80:1778–83. doi: 10.1212/WNL.0b013e31828726f5. [DOI] [PMC free article] [PubMed] [Google Scholar]
- 2.Folstein MF, Folstein SE, McHugh PR. “Mini-mental state”: a practical method for grading the cognitive state of patients for the clinician. J Psychiatr Res. 1975;12:189–98. doi: 10.1016/0022-3956(75)90026-6. [DOI] [PubMed] [Google Scholar]
- 3.Callahan CM, Unverzagt FW, Hui SL, et al. Six-item screener to identify cognitive impairment among potential subjects for clinical research. Med Care. 2002;40:771–81. doi: 10.1097/00005650-200209000-00007. [DOI] [PubMed] [Google Scholar]
- 4.Brodaty H, Pond D, Kemp NM, et al. The GPCOG: a new screening test for dementia designed for general practice. J Am Geriatr Soc. 2002;50:530–4. doi: 10.1046/j.1532-5415.2002.50122.x. [DOI] [PubMed] [Google Scholar]
- 5.Nasreddine ZS, Phillips NA, Bédirian V, et al. The Montreal Cognitive Assessment, MoCA: a brief screening tool for mild cognitive impairment. J Am Geriatr Soc. 2005;53:695–9. doi: 10.1111/j.1532-5415.2005.53221.x. [DOI] [PubMed] [Google Scholar]
- 6.Chandler MJ, Lacritz LH, Hynan LS, et al. A total score for the CERAD neuropsychological battery. Neurology. 2005;65:102–6. doi: 10.1212/01.wnl.0000167607.63000.38. [DOI] [PubMed] [Google Scholar]
- 7.Damian AM, Jacobson SA, Hentz JG, et al. The Montreal Cognitive Assessment and the Mini-Mental State Examination as screening instruments for cognitive impairment: item analyses and threshold scores. Dement Geriatr Cogn Disord. 2011;31:126–31. doi: 10.1159/000323867. [DOI] [PubMed] [Google Scholar]
- 8.Larner AJ. Screening utility of the Montreal Cognitive Assessment (MoCA): in place of–or as well as–the MMSE? Int Psychogeriatr. 2012;24:391–6. doi: 10.1017/S1041610211001839. [DOI] [PubMed] [Google Scholar]
- 9.Freitas S, Simões MR, Alves L, et al. Montreal Cognitive Assessment (MoCA): normative study for the Portuguese population. J Clin Exp Neuropsychol. 2011;33:989–96. doi: 10.1080/13803395.2011.589374. [DOI] [PubMed] [Google Scholar]
- 10.Roalf DR, Moberg PJ, Xie SX, et al. Comparative accuracies of two common screening instruments for classification of Alzheimer’s disease, mild cognitive impairment, and healthy aging. Alzheimers Dement. 2013;9:529–37. doi: 10.1016/j.jalz.2012.10.001. [DOI] [PMC free article] [PubMed] [Google Scholar]
- 11.van Steenoven I, Aarsland D, Hurtig H, et al. Conversion between Mini-Mental State Examination, Montreal Cognitive Assessment, and Dementia Rating Scale-2 scores in Parkinson’s disease. Mov Disord. 2014;29:1809–15. doi: 10.1002/mds.26062. [DOI] [PMC free article] [PubMed] [Google Scholar]
- 12.Ghadiri-Sani M, Larner AJ. Cognitive screening instrument use in primary care: is it changing? Clin Pract. 2014;11:425–9. [Google Scholar]
- 13.Freitas S, Simões MR, Alves L, et al. Montreal Cognitive Assessment (MoCA): validation study for vascular dementia. J Int Neuropsychol Soc. 2012;18:1031–40. doi: 10.1017/S135561771200077X. [DOI] [PubMed] [Google Scholar]
- 14.Iliffe S, Robinson L, Brayne C, et al. Primary care and dementia: 1. diagnosis, screening and disclosure. Int J Geriatr Psychiatry. 2009;24:895–901. doi: 10.1002/gps.2204. [DOI] [PubMed] [Google Scholar]
- 15.Wittich W, Phillips N, Nasreddine ZS, et al. Sensitivity and specificity of the Montreal Cognitive Assessment modified for individuals who are visually impaired. J Vis Impairment Blindness. 2010;104:360–8. [Google Scholar]
- 16.Horton DK, Hynan LS, Lacritz LH, et al. An abbreviated Montreal Cognitive Assessment (MoCA) for dementia screening. Clin Neuropsychol. 2015;29:413–25. doi: 10.1080/13854046.2015.1043349. [DOI] [PMC free article] [PubMed] [Google Scholar]
- 17.Embretson SE, Reise SP. Item response theory for psychologists multivariate. Mahwa: Lawrence Erlbaum Associates, Inc; 2000. [Google Scholar]
- 18.Reise SP, Cook KF, Moore TM. Evaluating the impact of multidimensionality on unidimensional Item Response Theory model parameters. In: Reise SP, Revicki D, editors. Handbook of item response theory modeling. New York: Routledge; 2015. pp. 13–40. [Google Scholar]
- 19.Emre M, Aarsland D, Brown R, et al. Clinical diagnostic criteria for dementia associated with Parkinson’s disease. Mov Disord. 2007;22:1689–707. doi: 10.1002/mds.21507. [DOI] [PubMed] [Google Scholar]
- 20.Moore TM, Scott JC, Reise SP, et al. Development of an abbreviated form of the Penn Line Orientation Test using large samples and computerized adaptive test simulation. Psychol Assess. 2015;27:955–64. doi: 10.1037/pas0000102. [DOI] [PMC free article] [PubMed] [Google Scholar]
- 21.Spencer RJ, Wendell CR, Giggey PP, et al. Judgment of Line Orientation: an examination of eight short forms. J Clin Exp Neuropsychol. 2013;35:160–6. doi: 10.1080/13803395.2012.760535. [DOI] [PMC free article] [PubMed] [Google Scholar]
- 22.Segall DO. Computerized adaptive testing. Encyclopedia of social measurement. Amsterdam: Elsevier; 2005. [Google Scholar]
- 23.Weiss DJ, Kingsbury GG. Application of computerized adaptive testing to educational problems. J Educ Meas. 1984;21:361–75. [Google Scholar]
- 24.Samejima F. Estimation of latent ability using a response pattern of graded scores. Psychometrika Monograph. 1969:17. [Google Scholar]
- 25.Revelle W. psych: Procedures for Personality and Psychological Research. Northwestern University; Evanston, Illinois, USA: 2015. http://CRAN.R-project.org/package=psych Version 1.5.4. [Google Scholar]
- 26.Choi SW. Firestar: computerized adaptive testing simulation program for polytomous item response theory models. Appl Psychol Meas. 2009;33:644. [Google Scholar]
- 27.Steinhaus H. Sur la division des corp materiels en parties. Bull Acad Polon Sci. 1956;1:801–4. [Google Scholar]
- 28.Robin X, Turck N, Hainard A, et al. pROC: an open-source package for R and S+ to analyze and compare ROC curves. BMC Bioinformatics. 2011;12:77. doi: 10.1186/1471-2105-12-77. [DOI] [PMC free article] [PubMed] [Google Scholar]
- 29.DeLong ER, DeLong DM, Clarke-Pearson DL. Comparing the areas under two or more correlated receiver operating characteristic curves: a nonparametric approach. Biometrics. 1988;44:837–45. [PubMed] [Google Scholar]
- 30.Reise SP, Moore TM, Haviland MG. Applying unidimensional Item Response Theory models to psychological data. In: Geisinger KF, editor. APA Handbook of Testing and Assessment in Psychology. Washington, DC: American Psychological Association; 2013. pp. 101–19. [Google Scholar]
- 31.Reckase MD. Unifactor latent trait models applied to multifactor tests: results and implications. J Educ Behav Stat. 1979;4:207–30. [Google Scholar]
- 32.Horn JL. A rationale and test for the number of factors in factor analysis. Psychometrika. 1965;30:179–85. doi: 10.1007/BF02289447. [DOI] [PubMed] [Google Scholar]
- 33.Brayne C, Fox C, Boustani M. Dementia screening in primary care: is it time? JAMA. 2007;298:2409–11. doi: 10.1001/jama.298.20.2409. [DOI] [PubMed] [Google Scholar]
- 34.Nair AK, Gavett BE, Damman M, et al. Clock drawing test ratings by dementia specialists: interrater reliability and diagnostic accuracy. J Neuropsychiatry Clin Neurosci. 2010;22:85–92. doi: 10.1176/appi.neuropsych.22.1.85. [DOI] [PMC free article] [PubMed] [Google Scholar]
- 35.Wu Y, Wang M, Ren M, et al. The effects of educational background on Montreal Cognitive Assessment screening for vascular cognitive impairment, no dementia, caused by ischemic stroke. J Clin Neurosci. 2013;20:1406–10. doi: 10.1016/j.jocn.2012.11.019. [DOI] [PubMed] [Google Scholar]
- 36.Reitan RM, Wolfson D. A selective and critical review of neuropsychological deficits and the frontal lobes. Neuropsychol Rev. 1994;4:161–98. doi: 10.1007/BF01874891. [DOI] [PubMed] [Google Scholar]
- 37.Rinehardt E, Eichstaedt K, Schinka JA, et al. Verbal fluency patterns in mild cognitive impairment and Alzheimer’s disease. Dement Geriatr Cogn Disord. 2014;38:1–9. doi: 10.1159/000355558. [DOI] [PubMed] [Google Scholar]
- 38.Herrera E, Cuetos F, Ribacoba R. Verbal fluency in Parkinson’s disease patients on/off dopamine medication. Neuropsychologia. 2012;50:3636–40. doi: 10.1016/j.neuropsychologia.2012.09.016. [DOI] [PubMed] [Google Scholar]
- 39.Hachinski V, Iadecola C, Petersen RC, et al. National Institute of Neurological Disorders and Stroke–Canadian stroke network vascular cognitive impairment harmonization standards. Stroke. 2006;37:2220–41. doi: 10.1161/01.STR.0000237236.88823.47. [DOI] [PubMed] [Google Scholar]
- 40.Pendlebury ST, Mariz J, Bull L, et al. MoCA, ACE-R, and MMSE versus The National Institute of Neurological Disorders and Stroke–Canadian Stroke Network Vascular Cognitive Impairment Harmonization Standards Neuropsychological Battery after TIA and Stroke. Stroke. 2012;43:464–9. doi: 10.1161/STROKEAHA.111.633586. [DOI] [PMC free article] [PubMed] [Google Scholar]
- 41.Dong Y, Sharma VK, Chan BP-L, et al. The Montreal Cognitive Assessment (MoCA) is superior to the Mini-Mental State Examination (MMSE) for the detection of vascular cognitive impairment after acute stroke. J Neurol Sci. 2010;299:15–18. doi: 10.1016/j.jns.2010.08.051. [DOI] [PubMed] [Google Scholar]
- 42.Aarsland D, Bronnick K, Williams-Gray C, et al. Mild cognitive impairment in Parkinson disease: a multicenter pooled analysis. Neurology. 2010;75:1062–9. doi: 10.1212/WNL.0b013e3181f39d0e. [DOI] [PMC free article] [PubMed] [Google Scholar]
- 43.Gagnon G, Hansen KT, Woolmore-Goodwin S, et al. Correcting the MoCA for education: effect on sensitivity. Can J Neurol Sci. 2013;40:678–83. doi: 10.1017/s0317167100014918. [DOI] [PubMed] [Google Scholar]
- 44.Bosch B, Arenaza-Urquijo EM, Rami L, et al. Multiple DTI index analysis in normal aging, amnestic MCI and AD. Relationship with neuropsychological performance. Neurobiol Aging. 2012;33:61–74. doi: 10.1016/j.neurobiolaging.2010.02.004. [DOI] [PubMed] [Google Scholar]
- 45.Shulman KI, Herrmann N, Brodaty H, et al. IPA survey of brief cognitive screening instruments. Int Psychogeriatr. 2006;18:281–94. doi: 10.1017/S1041610205002693. [DOI] [PubMed] [Google Scholar]
- 46.Ismail Z, Rajji TK, Shulman KI. Brief cognitive screening instruments: an update. Int J Geriatr Psychiatry. 2010;25:111–20. doi: 10.1002/gps.2306. [DOI] [PubMed] [Google Scholar]
Associated Data
This section collects any data citations, data availability statements, or supplementary materials included in this article.