

Abstract
A high resolving power shotgun lipidomics strategy using gas-phase fractionation and data-dependent acquisition (DDA) was applied toward comprehensive characterization of lipids in a hen ovarian tissue in an untargeted fashion. Using this approach, a total of 822 unique lipids across a diverse range of lipid categories and classes were identified based on their MS/MS fragmentation patterns. Classes of glycerophospholipids and glycerolipids such as glycerophosphocholines (PC), glycerophosphoethanolamines (PE), and triglycerides (TG) are often the most abundant peaks observed in shotgun lipidomics analyses. These ions suppress the signal from low abundance ions, and hinder the chances of characterizing low abundant lipids when DDA is used. These issues were circumvented by utilizing gas-phase fractionation, where DDA was performed on narrow m/z ranges instead of a broad m/z range. Employing gas-phase fractionation resulted in an increase in sensitivity by more than an order of magnitude in both positive- and negative-ion modes. Furthermore, the enhanced sensitivity increased the number of lipids identified by a factor of ≈4, and facilitated identification of low abundant lipids from classes such as cardiolipins that are often difficult to observe in untargeted shotgun analyses and require sample-specific preparation steps prior to analysis. This method serves as a resource for comprehensive profiling of lipids from many different categories and classes in an untargeted manner, as well as for targeted and quantitative analyses of individual lipids. Furthermore, this comprehensive analysis of the lipidome can serve as a species- and tissue-specific database for confident identification of other MS-based datasets, such as mass spectrometry imaging.
Keywords: Shotgun Lipidomics, Gas-Phase Fractionation, Lipids, Hen Model, Lipid Metabolism, Polarity Switching, Q Exactive Plus

Introduction
Lipidomics is the comprehensive analysis and characterization of cellular lipids and their interactions with other biomolecules through different pathways. Lipidomics was initially described as a subset of the more general field of metabolomics; however, over the last couple of decades it has evolved into a distinct discipline due to the uniqueness and functional specificity of lipids relative to other metabolites [1–3]. One of the reasons for the rapid growth of this field can be attributed to advances in the field of mass spectrometry (MS), specifically the development of soft ionization methods and the introduction of high resolving power mass spectrometers. Although some techniques such as nuclear magnetic resonance (NMR) and gas or liquid chromatography have been used to analyze lipid samples, given the depth and wealth of structural information desired in lipidomics, MS is the most preferred method of analysis [1, 2].
Broadly speaking, MS-based lipidomics analyses can be divided into two categories: LC-MS/MS analyses and shotgun analyses. Both modes of analysis have their inherent advantages and disadvantages. For instance, LC-MS/MS detection reduces signal suppression and increases the dynamic range. However, in many cases different lipid species co-elute, and due to the remarkable diversity in chemical composition of lipids, it is often difficult to achieve baseline separation of different lipid categories and classes in untargeted analyses. Therefore, this method is often utilized in targeted analyses where a category or a class of lipids are the subject of analysis. For example, normal phase LC analysis allows for separation of glycerophospholipids based on their classes (head group composition), whereas reverse phase LC is used to separate glycerophospholipid species based on their chain length or lipophilicity [4, 5].
An alternative method of MS-based lipid analysis is shotgun lipidomics. The term “shotgun lipidomics” was coined by Han and Gross, when they described infusing a mixture of lipid extracts directly into the mass spectrometer at very low flow rates without any prior chromatographic separation [6–8]. The first reports of shotgun lipidomics were reported using triple quadrupole mass spectrometers, since they allowed for precursor ion and neutral loss scanning to identify key lipid fragments such as the head groups and fatty acyl chains in glycerophospholipids [9–11]. The advantages of shotgun lipidomics over LC-MS/MS analyses include the simpler experimental setup and higher throughput. A disadvantage of this method is the lower dynamic range compared to LC-MS/MS analyses, and the possibility of signal suppression from high abundant lipids.
Shotgun lipidomics has gained popularity in recent years, which is attributed to the development of high resolving power (RP) and high mass measurement accuracy (MMA) instruments such as Fourier transform ion cyclotron resonance (FT-ICR) or Orbitrap platforms. These instruments allow for separation of isobaric species with substantially improved signal-to-noise ratio and dynamic range for detection of low abundance lipids as compared to low resolving power instruments. Furthermore, the automatic gain control (AGC) function in Orbitrap-based instruments allows for sampling of a consistent number of ions in each scan and circumvents some of the issues of conventional FT-ICR instruments such as overfilling of the ICR cell [12]. Ultrahigh resolving power (>100,000) and mass accuracy (<2 ppm) can be routinely achieved using these mass analyzers, which allows for direct characterization of lipids based on the accurate mass of precursor and fragment ions. These advantages have made Orbitrap instruments an invaluable tool for shotgun lipidomics analyses [13–15].
It is worth noting that even high RP instruments cannot resolve isomeric lipid ions. Several approaches have been proposed for circumventing this issue. One approach is to perform the analyses in both positive- and negative-ion modes to distinguish lipids based on their ionization efficiencies. Such experiments should be performed with caution as different lipid classes exhibit significantly different ionization efficiencies, and the solvent systems need to be optimized for analysis in each ionization mode. The second approach for circumventing the issue with isomeric species is to use collision-induced dissociation (CID) to obtain structural information about the species, which will in turn aid with their confident identification. Chemical derivatization is another approach where specific lipids, often from the same class, are selectively derivatized such that their m/z is “shifted” to a region of the spectrum where there are fewer overlapping peaks [15]. By employing these approaches in shotgun analyses, more comprehensive lipid coverage can be achieved.
Aberrations in lipid metabolism have been linked with the onset and progression of different diseases including hypertension, diabetes, and different types of cancer [16–18]. Lipid profiles can provide valuable information about the onset and/or progression of such diseases. A common method for acquiring lipid profiles in untargeted shotgun lipidomics analyses is data-dependent acquisition (DDA). In DDA, a survey scan is obtained over a specified m/z range, after which the most abundant ions are selected for fragmentation. Following fragmentation, the precursor ion m/z values are written to a dynamic list to be excluded from further selection for a predetermined amount of time. This process is carried out iteratively as the next most abundant ions are selected for fragmentation in subsequent scans. Typically, a few hundred lipids can be confidently identified by their MS/MS spectra using this method [13, 14, 19]. However, this method suffers from some drawbacks. Commonly, precursor ion scans are carried out over a wide m/z range; however, the use of a wide m/z range for ion selection in a complex mixture of lipids results in poor reproducibility. Furthermore, DDA always under-samples the true complexity of the sample, resulting in lack of identification of low abundant lipids. For example, specific classes of glycerophospholipids often dominate the lipid profiles in positive- and negative-ion modes, and therefore, limit the chances of low abundant lipids from other categories or classes to be selected for fragmentation. These limitations reduce the utility of DDA in untargeted shotgun analyses for obtaining a comprehensive lipid coverage.
Gas-phase fractionation (GPF) can be utilized to overcome the limitations of DDA in shotgun analyses. In GPF analyses, the sample is analyzed in a DDA fashion using many narrow m/z ranges, instead of one wide m/z range, and ions are selected for fragmentation from survey scans over these narrow m/z ranges. The utility of this technique in proteomics [20–22] and metabolomics [23, 24] analyses has been demonstrated for some time; however, to our knowledge, this method has not been applied to shotgun lipidomics so far. Herein, we present the utility of GPF in shotgun lipidomics analyses to increase sensitivity, extend the dynamic range, and obtain a comprehensive lipid coverage across a wide range of lipid categories and classes.
Experimental
Materials
HPLC-grade methanol and water were purchased from Burdick and Jackson (Muskegon, MI, USA). HPLC-grade chloroform was purchased from Fluka (St. Louis, MO, USA). Acetic acid and sodium chloride (NaCl) were purchased from Sigma-Aldrich (St. Louis, MO, USA), and were used without further purification. Grade 5.0 Nitrogen gas (99.999% purity) was obtained from Arc3 Gases (Raleigh, NC, USA).
Samples
Ovarian tissue was obtained from a healthy C-strain white leghorn commercial laying hen. Birds were managed in accordance with the Institute for Laboratory Animal Research Guide, and all husbandry practices were approved by North Carolina State University Institutional Animal Care and Use Committee (IACUC). Tissue section was flash frozen in isopropanol in a liquid nitrogen bath, and stored at −80 °C until the time of the experiment.
Lipid Nomenclature
Throughout the manuscript, the lipid nomenclature and abbreviations proposed by the LIPID MAPS initiative [25, 26] and shorthand notations proposed by Liebisch and coworkers [27] are used to refer to lipid categories, classes, and individual lipid species.
Lipid Extraction
Lipid extraction was performed using a modified Folch method [28]. In short, a healthy hen ovarian tissue was sectioned into a thin section using a pre-cleaned scalpel. The tissue section was weighed (82.0 mg) and homogenized with chloroform/methanol (2:1) to a final volume 20 times the volume of the tissue sample (1,640 μL), assuming a density of 1.0 g/mL to determine tissue volume. The solution containing the tissue homogenate was agitated for 20 minutes using an orbital shaker at room temperature. The homogenate was then centrifuged using a Sorvall ST16R centrifuge (Thermo Fisher Scientific, Waltham, MA, USA) at 2,000 rpm for 5 minutes at 4 °C to remove tissue debris. The solvent was washed with 0.2 volume of 0.1% NaCl. After vortexing for 10 seconds, the mixture was centrifuged at 4 °C for 5 minutes at 2,000 rpm to separate the two phases. The upper phase, containing mostly salts and other contaminates dissolved in methanol and water, was discarded. The bottom phase, containing mostly lipids, was recovered and the solvent was evaporated under a stream of nitrogen. The remaining lipids were then re-suspended in 500 μL of chloroform/methanol (2:1) with 0.1% acetic acid prior to shotgun analyses. Acetic acid was found to be the optimal electrospray additive for acquisition in both positive- and negative-ion modes in a previous study [29].
Shotgun Lipidomics using Q Exactive Plus
Samples were introduced into the Q Exactive Plus mass spectrometer (Thermo Fisher Scientific, Bremen, Germany) using a Fusion 101 syringe pump (Thermo Fisher Scientific, Bremen, Germany) equipped with a Hamilton Gastight 1750 syringe at a flow rate of 500 nL/min. Mass spectra were collected in positive- and negative-ion modes using a data-dependent top-20 experiment. MS survey scans were acquired with the resolving power of 280,000 (FWHM at m/z=200). The AGC target for full MS scans was set to 1×10⁶, and maximum injection time (IT) of 50 ms was used. MS/MS scans were performed using collision-induced dissociation (CID) in the higher-energy collisional dissociation (HCD) cell. An isolation window of 1.3 Th was used to select precursor ions for fragmentation, and the selected precursor ions were placed on a dynamic exclusion list for a predetermined amount of time. Fragment ions were detected by the Orbitrap analyzer at resolving power of 70,000 (FWHM at m/z=200). Normalized collision energy (NCE) was set to 20% for all MS/MS experiments. For all MS/MS scans the AGC target and maximum IT were set to 5×10⁴ and 100 ms, respectively.
The m/z range of 150-2000 was scanned to obtain a comprehensive lipid coverage across different lipid categories and classes. The full range was scanned in DDA fashion for 3 minutes and precursor ions were dynamically excluded for 3 minutes to allow the less abundant ions to be selected for fragmentation. The same m/z range was also scanned using gas-phase fractionation. In this mode, DDA was used to scan narrow m/z ranges of 150 with an overlap of 50 (i.e. 150–300, 250–400, 350–500, etc. with the final segment of 1850–2000). Using this method, the C-trap was filled with only a small fraction of gas-phase ions that were allowed to pass through the quadrupole, and precursor ions were chosen from these small fractions. Each narrow m/z range was scanned for 3 minutes and precursor ions were dynamically excluded from selection for 1 minute. Isotopes were excluded from selection in both analysis modes.
Lipid Identification and Data Analysis
Lipid identification was performed using LipidSearch software, version 4.1.16 (Thermo Fisher Scientific, San Jose, CA, USA). The software searches the data against an internal database of >1.5 million lipid ions and their predicted fragment ions. Lipid identification is facilitated by first searching the accurate mass against the database, and then matching the MS/MS spectra with the predicted fragments or losses. The dedicated algorithm for shotgun analyses was used with m/z tolerances of ±5 ppm and ±0.001 Da for precursor and product ions, respectively. M-score threshold, which is calculated based on the number of matches with product ion peaks in the spectrum, was set to at least 10, and ID quality filters were set to include lipids with grades, A, B, and C. Using these ID quality grades, only those lipids identified on a sum composition level (e.g. PC (34:1)) and molecular level (e.g. PC (18:1_16:0) or PC (18:1/16:0)) were selected as confident IDs. The list of identified lipids and their normalized ion abundances were exported into Excel for subsequent analyses. Ion abundances were calculated by multiplying the normalized ion abundance (obtained in raw file) by the IT for each scan. Box-and-whisker plots of ion abundances were generated using JMP Pro, version 12 (SAS Institute, Cary, NC, USA), and Venn diagrams were generated using the Venn Diagram Plotter (PNNL, omics.onl.gov).
Results and Discussion
Lipid Profiles in Positive- and Negative-Ion Modes
The hen model is the only model for spontaneous development of ovarian cancer [30, 31], and has been the subject of proteomics and glycomics studies [32, 33]. Lipidomics investigations are crucial for systems-level approaches to investigate this model. To determine the utility of gas-phase fractionation in shotgun lipidomics analyses, a healthy hen ovarian tissue section was chosen for analysis. A thin section of the tissue was homogenized, and lipids were extracted for analysis. Due to their remarkable structural diversity, different lipid classes exhibit preferential ionization efficiencies and may produce specific forms of molecular cations or anions depending on the ESI polarity. Therefore, analysis of the extract in both ionization modes provides complimentary information about lipid species present in the sample. Lipid profiles obtained in both ionization modes at m/z 150-2000 are presented in Figure 1. It can be seen that ions in the 700–950 m/z range, mostly consisting of high-abundance classes of glycerophospholipids and glycerolipids, dominate the spectra in both ionization modes [4]. As expected, lipid classes such as glycerophosphocholines (PC) and glycerophosphoethanolamines (PE) exhibited higher ionization efficiency in positive-ion mode, whereas other classes such as glycerophosphoinositols (PI) and glycerophosphates (PA) were mostly observed in negative-ion mode.
Figure 1.

Lipid profiles obtained in positive- and negative-ion modes. The m/z ranges of 1000-2000 are shown in the insets, demonstrating the lower ion abundance of lipids in this region.
Another important observation in Figure 1 is the large diversity in ion abundance between the detected species. The insets in Figure 1 show the zoomed-in region of m/z 1000-2000, where the ion abundance in positive-ion mode is lower by an order of magnitude, and by four orders of magnitude in negative-ion mode. This significant difference in ion abundance hinders the ability to characterize lipid ions present in this range when a wide m/z range is analyzed using conventional DDA. One approach to circumvent this issue in shotgun lipidomics is to use fractionation prior to analysis to reduce the complexity of the sample and separate lipids from each other based on factors such as abundance, class, or polarity [13, 19]. However, these approaches complicate the sample preparation steps and reduce the throughput of the method. Another approach is to use multidimensional MS (MDMS), where lipids are first fractionated based on their charge prior to analysis and then “intrasource separation” is used to characterize individual lipids from specific classes [8, 34]. In this analysis mode, a series of neutral loss scans and precursor ion scans are used to identify lipids classes by their head groups, and then full MS scans and neutral loss scans of all fatty acyl chains are obtained to identify individual lipid species. This approach has been used extensively to characterize and quantify lipids across different classes; however, it requires time-consuming sample preparation steps such as charge-specific extraction and chemical reactions prior to analysis. A third approach to address this issue, outlined in this work, is to use gas-phase fractionation to extend the dynamic range and increase the sensitivity for the low-abundant lipids, without any additional sample preparation steps. The benefits of gas-phase fractionation and its effectiveness in untargeted shotgun analyses are discussed below.
Extended Dynamic Range and Enhanced Sensitivity using Gas-Phase Fractionation
Comprehensive global lipidome analysis is often limited by issues associated with sample complexity and dynamic range of lipid extracts, where individual species differ in abundance by 4–5 orders of magnitude for ions that are above the limits-of-detection (LOD). These issues have been addressed from the sample preparation perspective by using fractionation and chemical derivatization prior to analysis. These issues can also be addressed from the instrument and data acquisition perspective. One example of such approach is the coupling of modified data acquisition with automated data-dependent tandem MS in gas-phase fractionation. In this acquisition mode, ions are fractionated based on their m/z values and a wide m/z range is analyzed in multiple segments. The utility of this approach for extending the dynamic range and enhancing sensitivity has been confirmed in LC-MS/MS proteomics [20–22] and metabolomics analyses [23, 24].
This approach can also be applied to shotgun lipidomics, where the dynamic range of detection is often lower than LC-MS/MS analyses. This is particularly the case when Orbitrap-based instruments are used since these instruments require accumulation and storage of ions in an RF-only trap (C-trap) prior to their injection and measurement by the mass analyzer [35, 36]. The C-trap is upper dynamic range limited and can be filled with approximately 1×10⁶ charges, which is less than the capacity of the Orbitrap [35]. The AGC function uses a pre-scan to ensure a consistent number of ions are stored in the C-trap and are injected into the Orbitrap for measurement in each scan. This limitation is an important factor in shotgun lipidomics since a mixture of complex lipids is directly infused into the instrument and the lipid profile is consistent during the analysis time, unlike LC-MS/MS analyses where the profile changes as different compounds elute from the LC column. This leads to accumulation of highly abundant glycerophospholipids and glycerolipids in the C-trap in each full MS scan, and therefore, these ions will have a much higher chance of being selected for characterization compared to low abundant lipids (Figure 1). A long exclusion window can be used to exclude highly abundant ions from selection and allow the low abundant lipids to be characterized; however, the low ion count for these ions leads to lower quality of MS/MS spectra and complicates confident identification of these lipids. This issue can be circumvented by utilizing gas-phase fractionation, where ions from a narrow m/z range are allowed to pass through the quadrupole and reach the C-trap. Therefore, the C-trap is filled only with ions from the specified m/z range, which leads to improvement of sensitivity by orders of magnitude. To illustrate this point, the extracted ion chromatograms (XIC) for two lipids with significantly different ion abundances are shown in Figure 2 as examples. It can be seen that using gas-phase fractionation results in an increase in ion abundance for both species. As expected, ions were selected for fragmentation more frequently when gas-phase fractionation was used since the exclusion window was shorter in these analyses. More importantly, the XICs show the benefit of gas-phase fractionation in characterizing low abundant lipids. It can be seen that without fractionation the time required to select a low abundant ion is much higher than with fractionation, supporting the hypothesis that using gas-phase fractionation reduces the complexity of the ions present in the C-trap and allows the low abundant ions to be selected for fragmentation much faster than conventional DDA and a long exclusion window. As shown in Figure 2B, PC (16:0/14:0)+Na+ was selected for fragmentation after 0.30 minutes when gas-phase fractionation was used, compared to 2.82 minutes using conventional DDA. Therefore, not only does gas-phase fractionation enhance the sensitivity for both ions, it also helps with rapid, accurate, and reproducible characterization of low abundant lipids present in the sample without the need for a long exclusion list.
Figure 2.
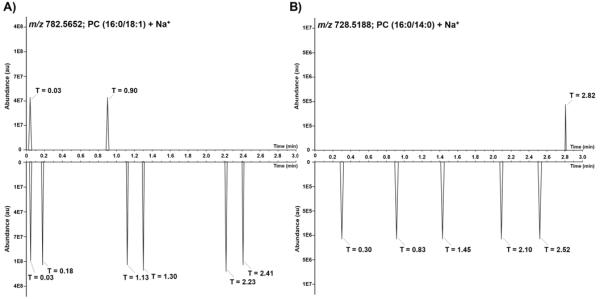
Extracted ion chromatograms (XIC) of PC (16:0/18:1)+Na+ (A) and PC (16:0/14:0)+Na+ (B) in un-fractionated and fractionated analyses. In each set, the top XIC represents the time that the ion was chosen for fragmentation using conventional DDA with a long exclusion window, and the bottom XIC represents the time it was chosen for fragmentation when gas-phase fractionation and a shorter exclusion window was utilized. An increase in ion abundance for both lipids is observed, and the low abundant lipid is selected for characterization sooner when gas-phase fractionation is used.
The enhanced sensitivity afforded by using gas-phase fractionation, as shown in two examples in Figure 2, is consistent across all lipid ions, regardless of their abundance in the extract. Figure 3 shows box-and-whisker plots of ion abundances for ions that were identified in both acquisition modes, with and without employing gas-phase fractionation. The majority of these ions belong to the high abundant classes of glycerophospholipid and glycerolipids, which are observed in m/z range of 650–900 in the full MS profile (Figure 1). It can be seen that employing gas-phase fractionation resulted in an increase in ion abundance by an order of magnitude in positive-ion mode and almost two orders of magnitude in negative-ion mode. Furthermore, the added sensitivity enables comprehensive survey of the lipidome and allows for identification of low abundant lipids across a wider range of lipid classes that could not be selected using conventional DDA (discussed in the next section). While the added sensitivity is beneficial in untargeted shotgun lipidomics (such as this study), it is also critical in targeted and quantitative shotgun analyses. Using gas-phase fractionation, mixtures of lipid extracts and lipid standards can be analyzed without the need for class-specific extraction and/or purification steps. Since fractionation is performed on the basis of m/z, the target lipids and their respective internal standards would fall in the same m/z fraction. Therefore, this approach can be used to quantify low abundant lipids that were difficult to observe using conventional DDA.
Figure 3.
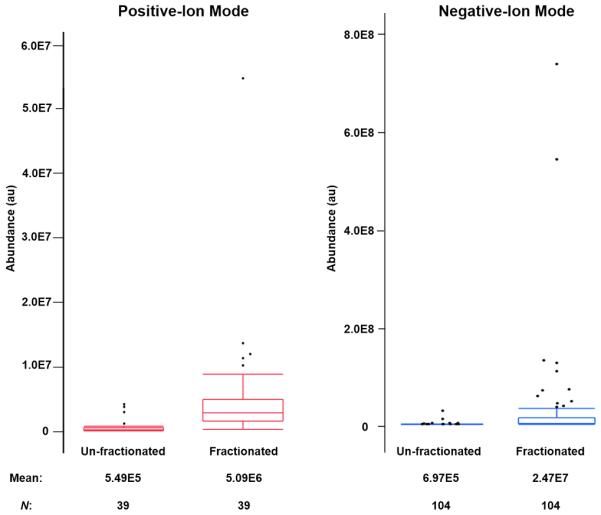
Box plots of ion abundances of lipids that were identified in both un-fractionated and fractionated analyses. On average, gas-phase fractionation results in an increase in ion abundance by at least an order of magnitude for both ionization modes.
Comprehensive Lipid Coverage using Gas-Phase Fractionation
The number of individual lipids identified in positive- and negative-ion modes for data acquisition with and without utilizing gas-phase fractionation are presented in Table 1. The list of identified lipids was examined in order to remove multiple adducts of the same species. For example, PC (16:0/18:1) was observed in positive-ion mode at m/z 760.5847 as a protonated adduct, as well as m/z 782.5652 in its sodiated form. Although the software identified this lipid twice (once at each m/z value), this lipid counted as one unique ID in Table 1. Furthermore, the lipids that were identified in two overlapping m/z regions using gas-phase fractionation (e.g., 650–800 and 750–900) and those ions that were identified in both ionization modes were counted as one unique lipid ID in this table.
Table 1.
Number of unique lipids identified in positive- and negative-ion modes with and without employing gas-phase fractionation in one technical replicate.
| Without Gas-Phase Fractionation | With Gas-Phase Fractionation | |||
|---|---|---|---|---|
| Positive-Ion Mode | Negative-Ion Mode | m/z Range | Negative-Ion Mode | Positive-Ion Mode |
| 0 | 1 | 150–300 | 0 | 0 |
| 0 | 0 | 250–400 | 5 | 0 |
| 0 | 5 | 350–500 | 23 | 5 |
| 3 | 9 | 450–600 | 48 | 8 |
| 4 | 19 | 550–700 | 50 | 5 |
| 46 | 54 | 650–800 | 91 | 42 |
| 22 | 50 | 750–900 | 109 | 68 |
| 3 | 4 | 850–1000 | 39 | 49 |
| 0 | 0 | 950–1100 | 63 | 44 |
| 0 | 0 | 1050–1200 | 35 | 34 |
| 0 | 0 | 1150–1300 | 12 | 11 |
| 0 | 0 | 1250–1400 | 2 | 0 |
| 0 | 1 | 1350–1500 | 37 | 0 |
| 0 | 0 | 1450–1600 | 25 | 0 |
| 0 | 0 | 1550–1700 | 16 | 0 |
| 0 | 0 | 1650–1800 | 1 | 0 |
| 0 | 0 | 1750–1900 | 0 | 0 |
| 0 | 0 | 1850–2000 | 0 | 0 |
| 78 | 143 | SUM | 556 | 266 |
| 221 | Total Lipid IDs | 822 | ||
After applying the aforementioned filters, a total of 221 unique lipids were identified across 30 different lipid classes without using gas-phase fractionation (Tables S1 and S2), with most IDs corresponding to highly abundant glycerophospholipids (PCs, PEs, and PSs) and glycerolipids (TGs and DGs). These observations and number of identified lipids are in good agreement with other reports of performing shotgun lipidomics using Orbitrap-based instruments [14, 15]. The number of lipid IDs increased to 822 (~4-fold increase) when the same extract was analyzed using gas-phase fractionation (Tables S3 and S4). As mentioned above, the increased sensitivity gained by using gas-phase fractionation allows for identification of low abundant lipids that would otherwise not be selected for fragmentation. This is evident by examining the number of lipids identified in the 650–950 m/z range. This range is dominated by glycerophospholipids and glycerolipids that could suppress the signal from low abundant species. Indeed, lipids from this m/z range account for 87% of identified species when gas-phase fractionation is not used, whereas only 43% of lipids identified using gas-phase fractionation are from this m/z range. Figure 4 shows the overlap between the lipids identified using both acquisition modes. It can be seen that the majority of ions that were identified without using gas-phase fractionation are part of the more comprehensive dataset obtained by employing gas-phase fractionation. A small fraction of lipids were identified only when gas-phase fractionation was not used. This could be attributed to the random fashion that precursor ions are selected for fragmentation in DDA. Furthermore, the grades for identified lipids in each analysis mode (with and without gas-phase fractionation) can be used to investigate the effect of gas-phase fractionation on the quality of MS/MS spectra obtained, and in turn the accuracy of the identification. These grades for all identified lipids are shown in Figure S1, where a clear increase in the number of lipid IDs with each grade can be observed. For instance, it can be seen that the number of lipids identified with a grade of “A” is doubled when gas-phase fractionation is employed. On the subject of number of lipids identified, it is also important to note that all lipid IDs in this study were supported by their MS/MS fragmentation patterns. Using accurate mass of precursor as the only means of identification resulted in the putative assignment of more than 1,400 lipids in both ionization modes using the LipidSearch software.
Figure 4.
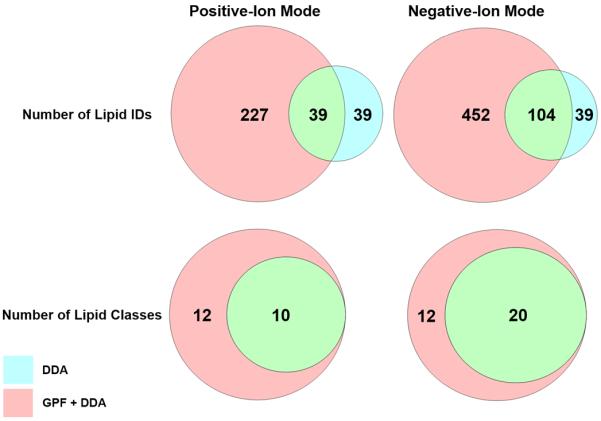
Venn diagrams demonstrating the utility of gas-phase fractionation for obtaining a comprehensive lipid coverage in both ionization modes. It is evident that more lipids across a wider range of lipid classes were identified by utilizing gas-phase fractionation.
The gain in sensitivity using gas-phase fractionation also helps with achieving a more comprehensive lipid coverage across more classes of lipids (Figure 4). As discussed above, a class of low-abundance glycerophospholipids are cardiolipins, which are predominantly present in mitochondrial membranes of eukaryotic cells [37]. Cardiolipins are a class of glycerophospholipids (often observed at m/z range 1300–1800), and are often difficult to characterize using DDA during shotgun analyses due to their significantly lower abundance compared to other glycerophospholipids such as PCs or PEs. Han and coworkers reported the utility of shotgun lipidomics for analysis of cardiolipins, but mentioned that the lipid extract solution needs to be “appropriately diluted” in order to circumvent ion suppression resulting from the presence of more abundant lipids in the solution [38]. Cardiolipins were readily identified in our analyses by simply employing gas-phase fractionation, without performing any sample-specific preparation steps. Since the sample was not diluted prior to analysis of cardiolipins, these lipids were observed as singly charged ions, instead of their double charged states, presumably due to suppression of ions in the 600–900 m/z range. Figure 5 shows the lipid profiles for m/z range of 1450-1600 with and without gas-phase fractionation in both positive- and negative-ion modes. It can be seen that employing gas-phase fractionation results in an increase in ion abundance by 2 orders of magnitude in positive-ion mode and 3 orders of magnitude in negative-ion mode, which in turn results in the identification of 25 cardiolipins in this m/z range. Therefore, utilizing gas-phase fractionation allows for obtaining a much more comprehensive lipid profile for a given biological sample (Figure 4). This comprehensive coverage is the direct result of the increased sensitivity afforded by gas-phase fractionation, and cannot be achieved by simply increasing the analysis time or the amount of time highly abundant ions are excluded from selection. The ability to survey more lipids without sample-specific preparation steps is crucial in untargeted shotgun analyses, since the same lipid extract can be used to obtain information about lipids that differ by orders of magnitude in abundance without the need for further dilution, enrichment, and/or derivatization steps.
Figure 5.
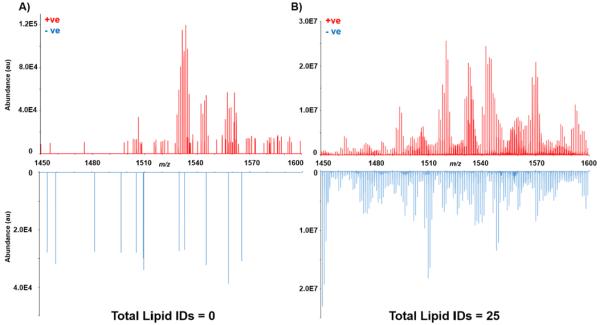
Lipid profiles in m/z range of 1450-1600 obtained without (A) and with (B) performing gas-phase fractionation. Utilizing gas-phase fractionation resulted in improved sensitivity in both ionization modes by at least two orders of magnitude, which in turn allowed for identification of a total of 28 cardiolipins in this m/z range.
A minor disadvantage of using gas-phase fractionation in shogun lipidomics is the longer data acquisition times and larger data files acquired. However, when performing untargeted shotgun analyses, obtaining the most comprehensive lipid profile is crucial since some of the less abundant ions could be the ones that are biologically relevant in the onset and/or progression of a certain disease. Once the lipidome has been surveyed comprehensively using this method and potential biomarkers have been identified, high throughput assays for quantitative analysis can be developed. The overall analysis time using gas-phase fractionation is not significantly longer than traditional shotgun analyses once sample preparation steps for different classes of lipids are taken into account. The improvement in sensitivity that is afforded by employing gas-phase fractionation allows investigators to bypass specific sample preparation steps needed for analysis of low abundant lipids, and lowers financial costs associated with sample preparation. It is worth noting that gas-phase fractionation does not improve ionization of lipids, and therefore, preparation steps such as chemical derivatization are needed to analyze those lipids that are not readily ionizable.
This work serves as a proof-of-concept for obtaining more comprehensive coverage of lipids in untargeted shotgun analyses using gas-phase fractionation. Current studies are focused on applying this method to analyze lipid extracts from tissues in a biorepository generated in our laboratory, which contains healthy and cancerous tissue sections (stages I-IV) from 150 hens. Furthermore, tissues from the same hens will be analyzed by mass spectrometry imaging (MSI) using infrared matrix-assisted laser desorption electrospray ionization (IR-MALDESI), a novel ionization source developed in our laboratory [29, 39], to discern spatial distribution of the lipids observed in shotgun analyses. The lipid data obtained using gas-phase fractionation will also be used to develop a tissue-specific database of lipids present in hen ovary tissues, which will be integrated with our open-source MSI data processing software, MSiReader [40], to confidently annotate ions observed during MSI analyses. Comprehensive untargeted shotgun analyses of lipid extracts from these tissues, in tandem with MSI experiments, are expected to provide a deeper insight into the aberrations in lipidome during onset and/or progression of ovarian cancer.
Conclusions
The work presented here demonstrates the utility of gas-phase fractionation for simultaneous and highly sensitive analysis of diverse classes of lipids in shotgun lipidomics studies. Gas-phase fractionation resulted in significant increase in sensitivity in both positive- and negative-ion modes. Furthermore, utilizing gas-phase fractionation enabled the identification of more comprehensive lipid profiles in hen ovarian tissues. A ~4-fold increase in the number of lipid IDs was observed, and the number of lipid classes surveyed increased by 50%. Coupling of shotgun lipidomics and gas-phase fractionation shows a significant potential for biomarker discovery studies, since the lipidome can be surveyed in an untargeted, comprehensive, and sensitive manner and changes in abundance across different samples can be monitored.
Supplementary Material
Acknowledgements
The authors would like to thank Prof. James Petitte from NCSU Department of Poultry Science for providing the hen ovary tissues. The authors also gratefully acknowledge financial assistance received from the National Institutes of Health (R01GM087964), the W. M. Keck foundation, and North Carolina State University.
References
- 1.Wenk MR. The emerging field of lipidomics. Nat. Rev. Drug Discov. 2005;4:594–610. doi: 10.1038/nrd1776. [DOI] [PubMed] [Google Scholar]
- 2.Blanksby SJ, Mitchell TW. Advances in mass spectrometry for lipidomics. Annu. Rev. Anal. Chem. 2010;3:433–465. doi: 10.1146/annurev.anchem.111808.073705. [DOI] [PubMed] [Google Scholar]
- 3.Khalil MB, Hou W, Hu Z, Elisma F, Swayne LA, Blanchard AP, Yao Z, Bennett SAL, Figeys D. Lipidomics Era: Accomplishments and Challeneges. Mass Spectrom. Rev. 2010;29:877–929. doi: 10.1002/mas.20294. [DOI] [PubMed] [Google Scholar]
- 4.Pulfer M, Murphy RC. Electrospray mass spectrometry of phospholipids. Mass Spectrom. Rev. 2003;22:332–64. doi: 10.1002/mas.10061. [DOI] [PubMed] [Google Scholar]
- 5.Cui Z, Thomas MJ. Phospholipid profiling by tandem mass spectrometry. J. Chromatogr. B Anal. Technol. Biomed. Life Sci. 2009;877:2709–2715. doi: 10.1016/j.jchromb.2009.06.034. [DOI] [PubMed] [Google Scholar]
- 6.Han X, Gross RW. Global analyses of cellular lipidomes directly from crude extracts of biological samples by ESI mass spectrometry: a bridge to lipidomics. J. Lipid Res. 2003;44:1071–1079. doi: 10.1194/jlr.R300004-JLR200. [DOI] [PubMed] [Google Scholar]
- 7.Han X, Gross RW. Shotgun lipidomics: Electrospray ionization mass spectrometric analysis and quantitation of cellular lipidomes directly from crude extracts of biological samples. Mass Spectrom. Rev. 2005;24:367–412. doi: 10.1002/mas.20023. [DOI] [PubMed] [Google Scholar]
- 8.Yang K, Cheng H, Gross RW, Han X. Automated lipid identification and quantification by multidimensional mass spectrometry-based shotgun lipidomics. Anal. Chem. 2009;81:4356–4368. doi: 10.1021/ac900241u. [DOI] [PMC free article] [PubMed] [Google Scholar]
- 9.Hsu FF, Turk J. Charge-remote and charge-driven fragmentation processes in diacyl glycerophosphoethanolamine upon low-energy collisional activation: a mechanistic proposal. J. Am. Soc. Mass Spectrom. 2000;11:892–899. doi: 10.1016/S1044-0305(00)00159-8. [DOI] [PubMed] [Google Scholar]
- 10.Hsu F-F, Turk J, Stewart ME, Downing DT. Structural Studies on Ceramides as Lithiated Adducts by Low Energy Collisional-Activated Dissociation Tandem Mass Spectrometry with Electrospray Ionization. J. Am. Soc. Mass Spectrom. 2002;13:680–695. doi: 10.1016/S1044-0305(02)00362-8. [DOI] [PubMed] [Google Scholar]
- 11.Hsu FF, Turk J. Electrospray ionization/tandem quadrupole mass spectrometric studies on phosphatidylcholines: The fragmentation processes. J. Am. Soc. Mass Spectrom. 2003;14:352–363. doi: 10.1016/S1044-0305(03)00064-3. [DOI] [PubMed] [Google Scholar]
- 12.Michalski A, Damoc E, Hauschild J-P, Lange O, Wieghaus A, Makarov A, Nagaraj N, Cox J, Mann M, Horning S. Mass spectrometry-based proteomics using Q Exactive, a high-performance benchtop quadrupole Orbitrap mass spectrometer. Mol. Cell. Proteomics. 2011;10 doi: 10.1074/mcp.M111.011015. M111.011015. [DOI] [PMC free article] [PubMed] [Google Scholar]
- 13.Ejsing CS, Sampaio JL, Surendranath V, Duchoslav E, Ekroos K, Klemm RW, Simons K, Shevchenko A. Global analysis of the yeast lipidome by quantitative shotgun mass spectrometry. Proc. Natl. Acad. Sci. U. S. A. 2009;106:2136–2141. doi: 10.1073/pnas.0811700106. [DOI] [PMC free article] [PubMed] [Google Scholar]
- 14.Schuhmann K, Almeida R, Baumert M, Herzog R, Bornstein SR, Shevchenko A. Shotgun lipidomics on a LTQ Orbitrap mass spectrometer by successive switching between acquisition polarity modes. J. mass Spectrom. 2012;47:96–104. doi: 10.1002/jms.2031. [DOI] [PubMed] [Google Scholar]
- 15.Fhaner CJ, Liu S, Ji H, Simpson RJ, Reid GE. Comprehensive lipidome profiling of isogenic primary and metastatic colon adenocarcinoma cell lines. Anal. Chem. 2012;84:8917–8926. doi: 10.1021/ac302154g. [DOI] [PMC free article] [PubMed] [Google Scholar]
- 16.Goldberg IJ, Trent CM, Schulze PC. Lipid metabolism and toxicity in the heart. Cell Metab. 2012;15:805–812. doi: 10.1016/j.cmet.2012.04.006. [DOI] [PMC free article] [PubMed] [Google Scholar]
- 17.Santos CR, Schulze A. Lipid metabolism in cancer. FEBS J. 2012;279:2610–2623. doi: 10.1111/j.1742-4658.2012.08644.x. [DOI] [PubMed] [Google Scholar]
- 18.Maceyka M, Spiegel S. Sphingolipid metabolites in inflammatory disease. Nature. 2014;510:58–67. doi: 10.1038/nature13475. [DOI] [PMC free article] [PubMed] [Google Scholar]
- 19.Schwudke D, Liebisch G, Herzog R, Schmitz G, Shevchenko A. Shotgun Lipidomics by Tandem Mass Spectrometry under Data-Dependent Acquisition Control. Methods Enzymol. 2007;433:175–191. doi: 10.1016/S0076-6879(07)33010-3. [DOI] [PubMed] [Google Scholar]
- 20.Spahr C, Davis M, McGinley MD, Robinson JH, Bures EJ, Beierle J, Mort J, Courchesne PL, Chen K, Wahl RC, Yu W, Luethy R, Patterson SD. Towards defining the urinary proteome using liquid chromatography-tandem mass spectrometry I. Profiling an unfractionated tryptic digest. Proteomics. 2001;1:93–107. doi: 10.1002/1615-9861(200101)1:1<93::AID-PROT93>3.0.CO;2-3. [DOI] [PubMed] [Google Scholar]
- 21.Breci L, Hattrup E, Keeler M, Letarte J, Johnson R, Haynes P. a. Comprehensive proteomics in yeast using chromatographic fractionation, gas phase fractionation, protein gel electrophoresis, and isoelectric focusing. Proteomics. 2005;5:2018–2028. doi: 10.1002/pmic.200401103. [DOI] [PubMed] [Google Scholar]
- 22.Kennedy J, Yi EC. Use of Gas-Phase Fractionation to Increase Protein Identifications. Methods Mol. Biol. 2008;432:217–228. doi: 10.1007/978-1-59745-028-7_15. [DOI] [PubMed] [Google Scholar]
- 23.Calderon-Santiago M, Priego-Capote F, Luque de Castro M. Enhanced Detection and Identification in Metabolomics by Use of LC–MS/MS Untargeted Analysis in Combination with Gas-Phase Fractionation. Anal. Chem. 2014;86:7558–7565. doi: 10.1021/ac501353n. [DOI] [PubMed] [Google Scholar]
- 24.Yan Z, Yan R. Improved Data-Dependent Acquisition for Untargeted Metabolomics Using Gas-Phase Fractionation with Staggered Mass Range. Anal. Chem. 2015;87:2861–2868. doi: 10.1021/ac504325x. [DOI] [PubMed] [Google Scholar]
- 25.Fahy E, Subramaniam S, Brown HA, Glass CK, Merrill AH, Murphy RC, Raetz CRH, Russell DW, Seyama Y, Shaw W, Shimizu T, Spener F, van Meer G, VanNieuwenhze MS, White SH, Witztum JL, Dennis E. a. A comprehensive classification system for lipids. J. Lipid Res. 2005;46:839–61. doi: 10.1194/jlr.E400004-JLR200. [DOI] [PubMed] [Google Scholar]
- 26.Fahy E, Subramaniam S, Murphy RC, Nishijima M, Raetz CRH, Shimizu T, Spener F, van Meer G, Wakelam MJO, Dennis E. a. Update of the LIPID MAPS comprehensive classification system for lipids. J. Lipid Res. 2009;50(Suppl):S9–S14. doi: 10.1194/jlr.R800095-JLR200. [DOI] [PMC free article] [PubMed] [Google Scholar]
- 27.Liebisch G, Vizcaíno JA, Köfeler H, Trötzmüller M, Griffiths WJ, Schmitz G, Spener F, Wakelam MJO. Shorthand notation for lipid structures derived from mass spectrometry. J. Lipid Res. 2013;54:1523–30. doi: 10.1194/jlr.M033506. [DOI] [PMC free article] [PubMed] [Google Scholar]
- 28.Folch J, Lees M, Sloane Stanley GH. A Simple Method for the Isolation and Purification of Total Lipides From Animal Tissues. J. Bol. Chem. 1957;226:497–509. [PubMed] [Google Scholar]
- 29.Nazari M, Muddiman DC. Polarity Switching Mass Spectrometry Imaging of Healthy and Cancerous Hen Ovarian Tissue Sections by Infrared Matrix-Assisted Laser Desorption Electrospray Ionization (IR-MALDESI) Analyst. 2016;141:595–605. doi: 10.1039/c5an01513h. [DOI] [PMC free article] [PubMed] [Google Scholar]
- 30.Johnson P. a, Giles JR. The hen as a model of ovarian cancer. Nat. Rev. Cancer. 2013;13:432–6. doi: 10.1038/nrc3535. [DOI] [PubMed] [Google Scholar]
- 31.Hawkridge AM. The Chicken Model for Spontaneous Ovarian Cancer. Proteomics Clin. Appl. 2014;8:689–699. doi: 10.1002/prca.201300135. [DOI] [PMC free article] [PubMed] [Google Scholar]
- 32.Nepomuceno AI, Shao H, Jing K, Ma Y, Petitte JN, Idowu MO, Muddiman DC, Fang X, Hawkridge AM. In-depth LC-MS/MS analysis of the chicken ovarian cancer proteome reveals conserved and novel differentially regulated proteins in humans. Anal. Bioanal. Chem. 2015;407:6851–6863. doi: 10.1007/s00216-015-8862-4. [DOI] [PMC free article] [PubMed] [Google Scholar]
- 33.Andrews Kingon GL, Petitte JN, Muddiman DC, Hawkridge AM. Multi-peptide nLC-PC-IDMS-SRM-based assay for the quantification of biomarkers in the chicken ovarian cancer model. Methods. 2013;61:323–30. doi: 10.1016/j.ymeth.2013.04.004. [DOI] [PMC free article] [PubMed] [Google Scholar]
- 34.Han X, Yang K, Gross RW. Multi-dimensional mass spectrometry-based shotgun lipidomics and novel strategies for lipidomic analyses. Mass Spectrom. Rev. 2012;31:134–178. doi: 10.1002/mas.20342. [DOI] [PMC free article] [PubMed] [Google Scholar]
- 35.Olsen JV, de Godoy LMF, Li G, Macek B, Mortensen P, Pesch R, Makarov A, Lange O, Horning S, Mann M. Parts per million mass accuracy on an Orbitrap mass spectrometer via lock mass injection into a C-trap. Mol. Cell. Proteomics. 2005;4:2010–21. doi: 10.1074/mcp.T500030-MCP200. [DOI] [PubMed] [Google Scholar]
- 36.Zubarev R. a, Makarov A. Orbitrap mass spectrometry. Anal. Chem. 2013;85:5288–96. doi: 10.1021/ac4001223. [DOI] [PubMed] [Google Scholar]
- 37.Schlame M, Rua D, Greenberg ML. The biosynthesis and functional role of cardiolipin. Prog. Lipid Res. 2000;39:257–288. doi: 10.1016/s0163-7827(00)00005-9. [DOI] [PubMed] [Google Scholar]
- 38.Han X, Kui Y, Yang J, Cheng H, Gross RW. Shotgun lipidomics of cardiolipin molecular species in lipid extracts of biological samples. J. Lipid Res. 2006;47:864–879. doi: 10.1194/jlr.D500044-JLR200. [DOI] [PMC free article] [PubMed] [Google Scholar]
- 39.Robichaud G, Barry JA, Muddiman DC. IR-MALDESI Mass Spectrometry Imaging of Biological Tissue Sections Using Ice as a Matrix. J. Am. Soc. Mass Spectrom. 2014;25:319–328. doi: 10.1007/s13361-013-0787-6. [DOI] [PMC free article] [PubMed] [Google Scholar]
- 40.Robichaud G, Garrard KP, Barry JA, Muddiman DC. MSiReader: an open-source interface to view and analyze high resolving power MS imaging files on Matlab platform. J. Am. Soc. Mass Spectrom. 2013;24:718–721. doi: 10.1007/s13361-013-0607-z. [DOI] [PMC free article] [PubMed] [Google Scholar]
Associated Data
This section collects any data citations, data availability statements, or supplementary materials included in this article.