Abstract
The oral anticoagulant prodrug dabigatran etexilate (DABE) is sequentially metabolized by intestinal carboxylesterase 2 (CES2) and hepatic carboxylesterase 1 (CES1) to form its active metabolite dabigatran (DAB). A recent genome-wide association study reported that the CES1 single nucleotide polymorphisms (SNPs) rs2244613 and rs8192935 were associated with lower DAB plasma concentrations in the Randomized Evaluation of Long-term Anticoagulation Therapy (RE-LY) study participants. In addition, gender differences in exposure to DAB were observed in clinical studies. The aim of this study was to examine the effect of CES1 genetic polymorphisms and gender on DABE activation using several in vitro approaches. The genotypes of the CES1 SNPs rs2244613, rs8192935, and the known loss-of-function CES1 variant rs71647871 (G143E), and the activation of DABE and its intermediate metabolites M1 and M2 were determined in 104 normal human liver samples. DABE, M1, and M2 activations were found to be impaired in human livers carrying the G143E variant. However, neither rs2244613 nor rs8192935 was associated with the activation in human livers. The incubation study of DABE with supernatant fractions (S9) prepared from the G143E-transfected cells showed that the G143E is a loss-of-function variant for DABE metabolism. Moreover, hepatic CES1 activity on M2 activation was significantly higher in female liver samples than male. Our data suggest that CES1 genetic variants and gender are important contributing factors to variability in DABE activation in humans. A personalized DABE treatment approach based on patient-specific CES1 genotypes and sex may have the potential to improve the efficacy and safety of DABE pharmacotherapy.
Keywords: Dabigatran etexilate, activation, pharmacogenetics, gender difference, carboxylesterase 1, carboxylesterase 2
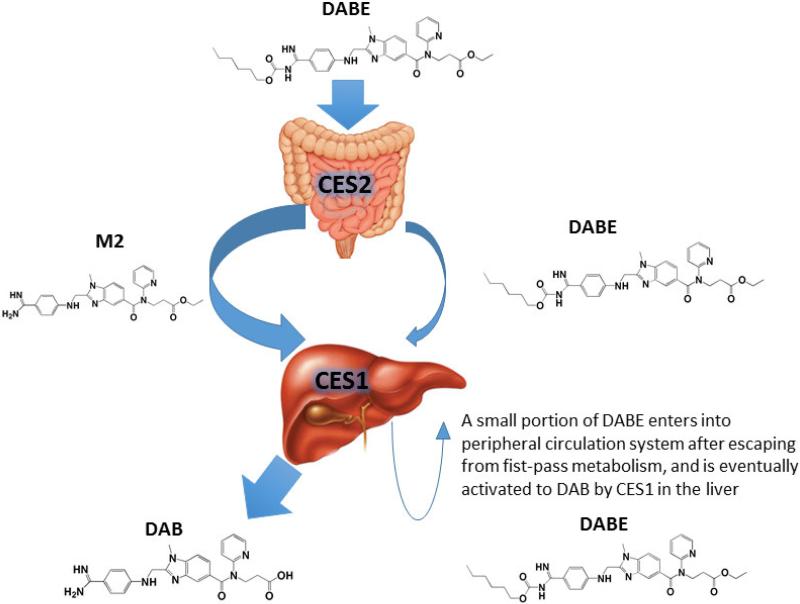
Graphical abstract
1. Introduction
Dabigatran etexilate (DABE) is a new competitive, direct thrombin inhibitor widely used to treat and prevent deep venous thrombosis and pulmonary embolism and to reduce the risk of stroke and systemic embolism [1]. DABE is given in fixed doses without the need for coagulation monitoring, which is a major advantage over warfarin. Clinical studies have demonstrated that DABE was highly effective for stroke prevention in patients with nonvalvular atrial fibrillation, and the treatment was also associated with less major and minor bleeding relative to warfarin [2, 3]. However, significant interindividual variability in both pharmacokinetics and pharmacodynamics of DABE have been consistently reported [2-8]. Thus, a better understanding of the factors contributing to the variability will lead to the development of a personalized DABE treatment and improved therapeutic outcome.
As an ester prodrug, DABE undergoes two sequential activation steps to form its pharmacologically active metabolite dabigatran (DAB). Following oral administration, DABE is first metabolized to its intermediate metabolite dabigatran ethyl ester (M2) by carboxylesterase 2 (CES2) in the intestine, and M2 is further converted to the final active metabolite DAB by carboxylesterase 1 (CES1) in the liver [9]. Plasma concentrations of DAB varied considerably among individuals [5, 7], which may have contributed to interindividual variability in response to DABE pharmacotherapy. A genome-wide association study conducted by Pare and colleagues reported that the CES1 single-nucleotide polymorphisms (SNPs) rs2244613 and rs8192935 were associated with lower exposure to the active metabolite DAB in the Randomized Evaluation of Long-term Anticoagulation Therapy (RE-LY) study participants, and the SNP rs2244613 was also associated with a lower risk of bleeding [4]. In addition, a recently published clinical study showed that the trough concentrations of DAB were significantly lower in the carriers of the SNP rs8192935 relative to the non-carriers [10]. Although there is ample evidence that CES1 genetic variants, such as the loss-of-function variant G143E (rs71647871) originally discovered in our laboratory [11], can markedly affect CES1 function and consequently alter pharmacokinetics and pharmacodynamics of various CES1 substrate drugs, it remains undetermined whether the SNPs rs2244613 and rs8192935 may affect the expression/activity of the CES1 enzyme.
In addition to genetic polymorphisms, gender could also affect CES1 expression and activity on the metabolism of CES1 substrates. Our previous study demonstrated that hepatic CES1 expression was significantly higher in females than males [12]. Consistent with the sex-dependent expression pattern, metabolic rates of CES1 substrate drugs, such as methylphenidate and oseltamivir, were significantly greater in females relative to males [13, 14]. Interestingly, two clinical studies indicated that plasma concentrations of DAB were significantly higher in females than males [5, 7], yet the underlying mechanism has not been investigated.
In the present study, we utilized a large set of individual human liver samples and cell lines transfected with wild type (WT) CES1 and the G143E variant to determine the impact of the CES1 variants rs2244613, rs8192935, and G143E on CES1 expression and DABE activation in human livers. Additionally, incubation studies with recombinant human CES1 and CES2 were conducted to elucidate the roles of the two enzymes in DABE activation. Furthermore, the gender difference in activation of DABE and its intermediate metabolites was determined in human livers. Revealing the effects of genetic variation and gender on CES1-mediated DABE activation provides a better understanding of interindividual variability in response to DABE and enables the development of a personalized therapeutic strategy to improve the outcomes of DABE pharmacotherapy.
2. Materials and Methods
2.1. Materials
DABE, DAB, and dabigatran ethyl ester (M2) were purchased from MedChem Express (Princeton, NJ). Desethyl dabigatran etexilate (M1) and dabigatran-d3 (DAB-d3) were obtained from Toronto Research Chemicals (Toronto, Canada). Fluorescein diacetate, fluorescein, LC–MS grade methanol, acetonitrile, and formic acid were all purchased from Sigma–Aldrich (St. Louis, MO). Taq DNA polymerase with standard Taq buffer and deoxynucleotide (dNTP) solution mix were products from New England Biolabs (Ipswich, MA). Recombinant human CES1 and CES2 were obtained from R&D Systems Inc. (Minneapolis, MN). All other chemicals and reagents were of analytical grade and commercially available.
A total of 104 individual normal human liver samples were obtained from XenoTech LLC (Kansas City, KS) and the Cooperative Human Tissue Network (Columbus, OH). Two samples had demographic information that was unknown. The 102 liver samples consisted of 46 males and 56 females with ages ranging from 1 to 83 years (56.5 ± 16.6 years). The donors included 94 Caucasians, 5 African-Americans, 1 Hispanic and 2 classified as ‘other’.
2.2. CES1 Genotyping
Genomic DNA was extracted from human liver samples using a PureLink® Genomic DNA Mini Kit (Life Technologies, CA) in accordance with manufacturer's instruction. DNA concentrations were determined by a Qubit® dsDNA High Sensitivity Assay (Life Technologies, CA) using Qubit® 2.0 Fluorometer (Invitrogen, CA). PCR was carried out to amplify the desired DNA fragments of the CES1 gene using the PCR conditions detailed in a previous study [12]. PCR products were purified (PureLink® PCR Purification Kit, Life Technologies, CA) and analyzed with 2% agarose gel electrophoresis before being subjected to Sanger sequencing. The CES1/CES1P1 haplotypes were determined by a previously established PCR-restriction fragment length polymorphism analysis (PCR-RFLP) [15].
2.3. Preparation of S9 fractions from human livers and CES1 transfected cells
Individual human liver S9 fractions (HLS9) were prepared according to the method we previously reported [15]. Protein concentrations were determined using a Pierce BCA protein assay kit (Pierce, Rockford, IL). The Flp-In™ 293 cell lines stably expressing WT CES1 and the variant G143E were developed in our previous study [11]. Cells were cultured in Dulbecco's modified Eagle's medium containing 10% fetal bovine serum. After reaching approximately 95% confluence, cells were washed and harvested in phosphate buffered saline (PBS) buffer. Cells were then sonicated and centrifuged at 9,000g for 30 min at 4°C. The supernatant (S9 fraction) was collected and stored at −80°C until use.
2.4. Enzymatic Activity Assays
In vitro incubation studies were conducted to determine the hydrolysis (activation) of DABE and its intermediate metabolites M1 and M2 by recombinant human CES1 and CES2, and S9 fractions from CES1 transfected cells and individual human livers.
Incubations were carried out in 1.5 ml tubes with a total volume of 60 μl. Substrate solutions and S9 fractions were all prepared in PBS buffer. Hydrolytic reactions were initiated by mixing 30 μl of substrates (i.e. DABE, M1, M2 or fluorescein diacetate solution, a positive control to measure CES2 activity) with 30 μl of recombinant enzymes or S9 fractions. For the recombinant CES1 and CES2 incubation study, 200 nM of DABE, M1 or M2 was incubated with 25 ng/μl of recombinant CES1 or CES2 at 37°C for 5 min. The experimental conditions of the HLS9 incubation study for different substrates were the following: DABE: 56 μM, HLS9: 0.06 mg/ml, incubation time: 10 min; M1: 100 μM, HLS9: 0.1 mg/ml, incubation time: 240 min; M2: 50 μM, HLS9: 0.1 mg/ml, incubation time: 10 min. All incubation experiments were carried out at 37°C. For the cell S9 fraction incubation study, 50 μM of DABE, M1 and M2 were incubated with a series concentrations (0.25, 0.125, and 0.0625mg/ml) of S9 fractions prepared from the transfected cells (WT CES1, vector, or the variant G143E) at 37°C for 10 and 20 min. The reactions were terminated by the addition of 120 μl acetonitrile containing the internal standard (IS) DAB-d3 (500 nM). The mixture was vortexed for 5 min and centrifuged at 17,000g for 10 min to remove the precipitated proteins. The supernatant was collected and analyzed for the active metabolite DAB using an LC-MS/MS assay as described below. The hydrolysis rates of DABE, M1 and M2 were calculated based on the formation of DAB.
Incubation studies of fluorescein diacetate with HLS9 were conducted to determine CES2 activity in human liver samples. The hydrolytic metabolite fluorescein was detected using a Synergy™ 2 Multi-Mode Microplate Reader (BioTek Inc., Winooski, VT) with excitation at 485 nm and emission at 525 nm as reported by Wang et al [16]. Experimental conditions of all in vitro incubation studies were determined by preliminary experiments to ensure the rates of the formation of metabolites were linear with the concentrations of the enzymes and S9 fractions as well as the incubation times. All incubation experiments were performed in triplicate except for the study of individual HLS9 samples for which experiments were duplicated.
2.5. LC-MS/MS Analysis
LC–MS/MS analysis was performed on a Shimadzu HPLC system (Shimadzu, Tokyo, Japan) coupled with an Applied Biosystems API 4000 triple quadrupole/linear ion trap (QTRAP) mass spectrometer (Foster City, CA, USA). Analytes were separated on a Shimadzu VP-ODS column (5um, 150×2.0mm, Shimadzu, Tokyo, Japan). DAB was quantified based on a previously reported method with some minor modifications [9]. The mobile phase consisted of methanol/water (1:99, v/v) containing 2.5 mM formic acid (A) and methanol/water (99:1, v/v) containing 2.5 mM formic acid (B), and was delivered at a flow rate of 0.2 ml/min. A gradient elution was applied to the separation with the following time program: mobile phase B was 10% for the first 1 min, increased from 10% to 90% during the time period of 1 to 6 min, maintained at 90% for 2 min, then returned to 10% at 9 min, and maintained at 10% until the end of the elution at 12 min. MS was operated on a positive ion mode using turbo electrospray ionization. The following parameters were used for the MS analysis: curtain gas: 20 psi; ion source gas 1: 30 psi; ion source gas 2: 45 psi; ionspray voltage: 5500 V; source temperature: 400 °C; entrance potential: 10 V; dwell time: 50 ms; collision cell exit potential: 11 V; declustering potential: 90 V; and collision energy: 40 V. The following transitions were monitored on a Multiple Reaction Monitoring (MRM) mode: DAB, m/z 472.2 > 289.3; DAB-d3 (IS), m/z 475.2 > 292.3. Quantifications were based on the peak area ratios of DAB to the IS. The regression coefficients of calibration curves were greater than 0.99. Three quality controls (125, 500, and 2500 nM) representing low, medium, and high concentrations of DAB, respectively, were included in every batch of the samples. The inter-day and intra-day relative standard deviations were less than 10%.
Absolute CES1 protein expressions in individual human liver samples were quantified using a novel targeted LC-MS/MS proteomics assay in a study we recently published [17].
2.6. Data analysis
Data are presented as mean ± standard deviation (SD). Mann–Whitney test was utilized to analyze differences in CES1 expression and the metabolic rates of DABE, M1, and M2 between different CES1 genotype groups (GraphPad Prism software version 6.0; GraphPad Software, San Diego, CA, USA). Correlations of the metabolic rates between DABE, M1, and M2 and CES1 and CES2 activities were analyzed using simple linear regression. A P-value less than 0.05 was considered statistically significant.
3. Results
3.1. CES1 metabolizes both the ethyl and carbamate ester bonds of DABE while CES2 can only metabolize the carbamate ester
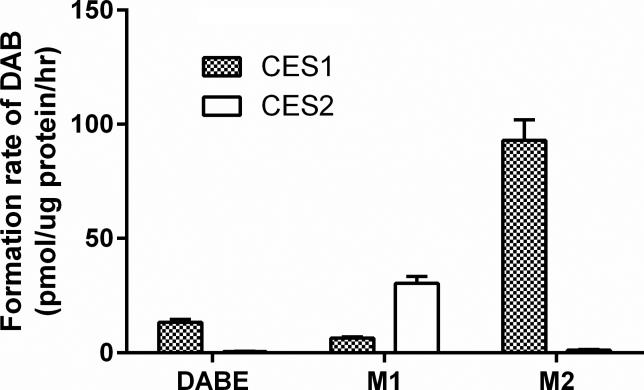
DAB was rapidly formed after incubation of recombinant human CES1 with DABE (13.3 ± 1.2 pmol/μg protein/hr), indicating that CES1 can cleave both the ethyl and carbamate ester bonds of DABE (Figure 1). Furthermore, CES1 hydrolyzed both the intermediate metabolites M1 and M2 to DAB, though the catalytic efficiency on the carbamate ester (M1) was markedly lower than that on the ethyl ester (M2) (6.5 ± 0.5 pmol/μg protein/hr vs 92.9 ± 9.0 pmol/μg protein/hr). DAB formation was observed following incubation of recombinant human CES2 with M1 but not with DABE and M2, suggesting that CES2 can only hydrolyze the carbamate ester (M1) but not the ethyl ester (M2). However, the catalytic efficiency of CES2 on the hydrolysis of the M1 carbamate ester was significantly greater than CES1 (30.4 ± 3.0 pmol/μg protein/hr vs 6.5 ± 0.5 pmol/μg protein/hr).
Figure 1.
Activation of DABE, M1, and M2 by recombinant human CES1 and CES2. The concentrations of active metabolite DAB were determined after incubation of DABE, M1 or M2 with CES1 and CES2 at 37 °C for 5 min. The final protein concentration of the enzymes was 25 ng/μl, and the concentration of all three substrates was 200 nM. Data are expressed as the rates of DAB formation (Mean ± S.D., n=3).
3.2. Metabolisms of DABE, M1, and M2 to DAB in human livers were highly correlated to CES1 activity
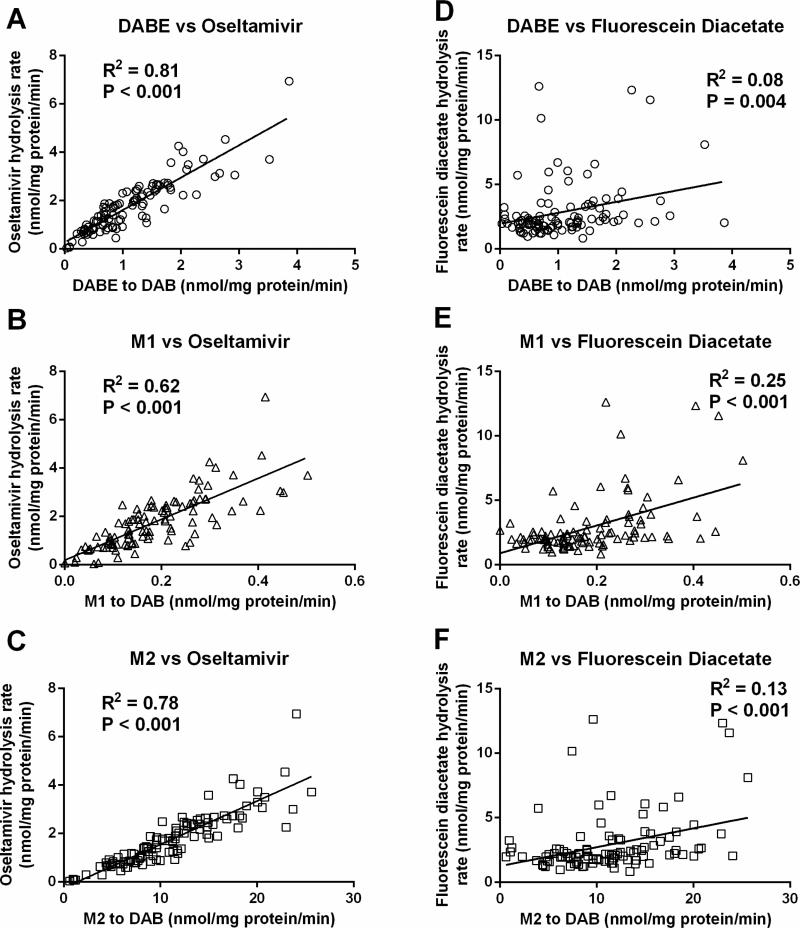
CES1 and CES2 activities in individual human liver samples were determined using the selective CES1 substrate oseltamivir and the selective CES2 substrate fluorescein diacetate, respectively. The oseltamivir data were derived from a study we recently published [12]. As shown in Figure 2, the activation rates of DABE, M1, and M2 were highly correlated to the CES1 activity determined from oseltamivir hydrolysis among the tested human liver samples. The R squared values of the correlations between the activation rates of DABE, M1, and M2 to DAB and the CES1 activity were 0.81, 0.62, and 0.78, respectively. As a comparison, the R squared values of the correlation between DABE, M1, and M2 activation and the CES2 activity were only 0.08, 0.25, and 0.13, respectively. The data suggest that CES1 is the primary enzyme activating DABE, M1, and M2 in human livers.
Figure 2.
Correlations between DABE, M1, M2 activations and CES1 and CES2 activities in 104 individual human liver samples. CES1 and CES2 activities were measured using the selective CES1 substrate oseltamivir and the selective CES2 substrate fluorescein diacetate, respectively. Data are the means from two independent experiments. (A) DABE vs oseltamivir; (B) M1 vs oseltamivir; (C) M2 vs oseltamivir; (D) DABE vs fluorescein diacetate; (E) M1 vs fluorescein diacetate; (F) M2 vs fluorescein diacetate.
3.3. The effect of the CES1 SNPs rs2244613, rs8192935, and G143E on CES1 expression and the activation of DABE, M1 and M2 in human livers
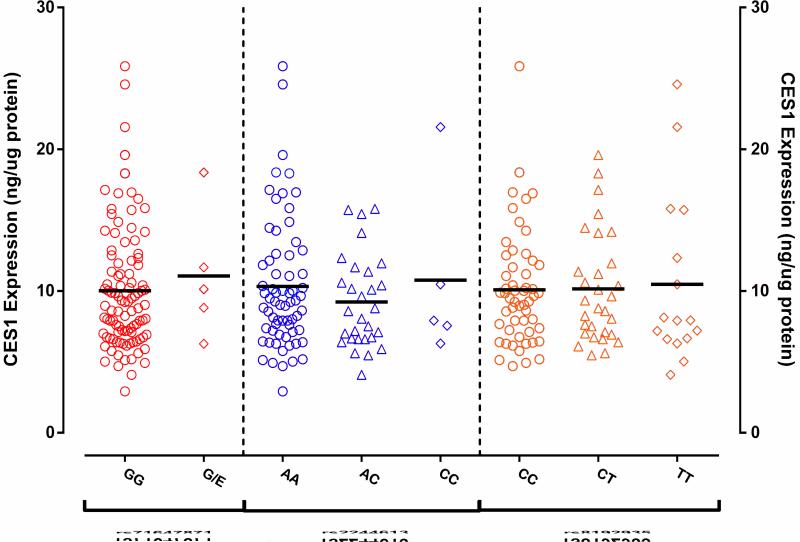
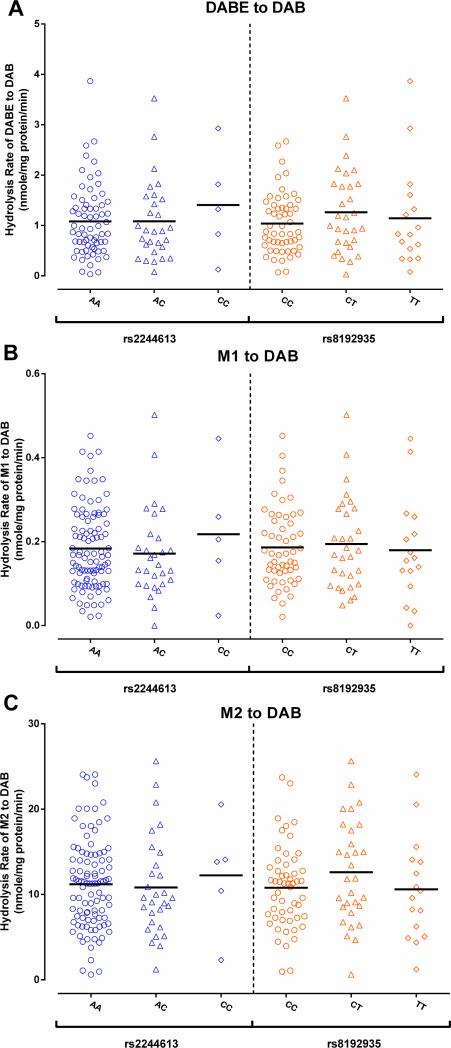
A total of 104 human liver samples were determined for the genotypes of the CES1 SNPs rs2244613, rs8192935, and the G143E. The data for the absolute CES1 protein expressions in the liver samples were from a study we recently published [17]. Among the tested subjects, the minor allele frequencies (MAFs) were 0.193, 0.310, and 0.024 for the variants rs2244613, rs8192935, and G143E, respectively. All 143E carriers were heterozygotes. None of the three SNPs were associated with CES1 expression in human liver (Figure 3). Furthermore, the genotypes of the SNPs rs2244613 and rs8192935 were not associated with the metabolism of DABE, M1, and M2 in human liver (Figure 4).
Figure 3.
No associations between the CES1 SNPs rs71647871, rs2244613, and rs9182935 and CES1 protein expression in human livers. Absolute CES1 protein expression was determine in 104 human livers by a targeted MS-based targeted proteomics assay. Data are the means from duplicate measurements.
Figure 4.
The CES1 SNPs rs2244613 and rs8192935 were not associated with metabolism of DABE, M1, and M2 in human livers. The formation of the active metabolite DAB was determined after incubation of DABE (A), M1 (B), and M2 (C) with 104 HLS9 fractions. Data are the means from two independent experiments.
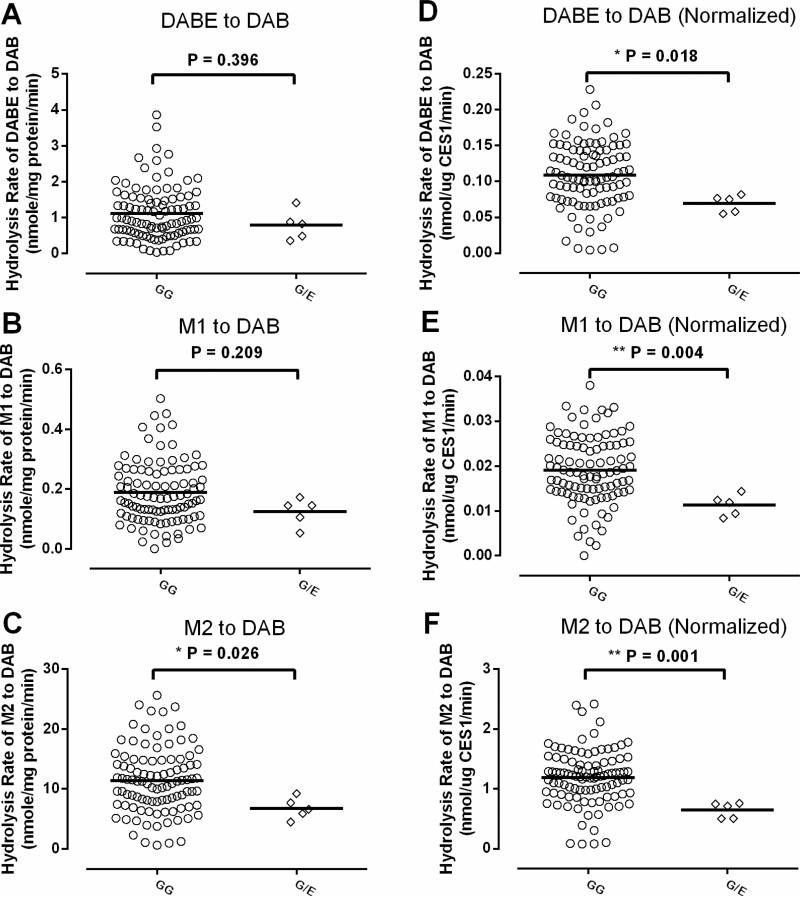
The mean values for activation rates of DABE, M1 and M2 in the liver samples with the 143G/E genotype were 71% (P=0.396), 66% (P=0.209) and 59% (P=0.026), respectively, of the samples with the 143G/G genotype, though the differences didn't reach a statistical significance level for DABE and M1 due to large inter-individual variability (Figure 5 A, B, C). After being normalized to CES1 expressions of individual livers, the mean activation rates of DABE, M1, and M2 in the 143E carriers were 53% (P= 0.018), 43% (P= 0.004), and 37% (P= 0.001), respectively, of the non-carriers, and the differences between the carriers and non-carriers were statistically significant for all three substrates (Figure 5 D, E, F).
Figure 5.
The effect of the CES1 variant G143E on DABE, M1, and M2 activation in human livers. The formation rates of DAB following incubation of DABE (A), M1 (B), and M2 (C) with HLS9 samples were compared between five 143G/E heterozygotes and 99 non-carriers. The comparison between the two genotypes was also conducted after the metabolic rates of DABE (D), M1 (E), and M2 (F) were normalized to CES1 protein expression. The study was duplicated, and the mean values are presented.
The impact of the G143E variant on the metabolism of DABE, M1 and M2 was further studied using Flp-In™ 293 cells stably expressing WT CES1 and the mutant G143E. Similar to recombinant human CES1, the S9 fractions prepared from WT CES1 cells efficiently hydrolyzed DABE, M1 and M2 to the active metabolite DAB. However, no appreciable DAB formation was observed after incubation of DABE, M1 and M2 with the S9 fractions from the G143E expressing cells. The results suggest that the G143E is a loss-of-function variant for the activation of DABE, M1, and M2 (Figure 6).
Figure 6.
Determination of the function of the CES1 variant G143E on DABE, M1, and M2 activation using transfected cell lines. No appreciable activation of DABE (A), M1 (B), and M2 (C) was observed after incubation of the substrates with the S9 fractions from the G143E transfected cells, whereas S9 fractions from the WT CES1 transfected cells readily activated all three substrates. Data are means ± S.D. (n=3).
3.4. Differences in hepatic metabolism for DABE, M1, and M2 between males and females
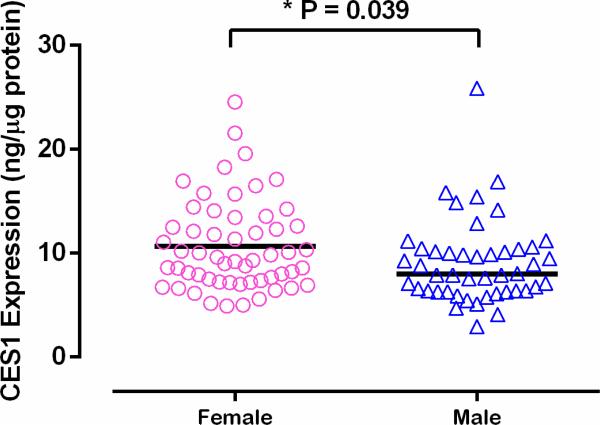
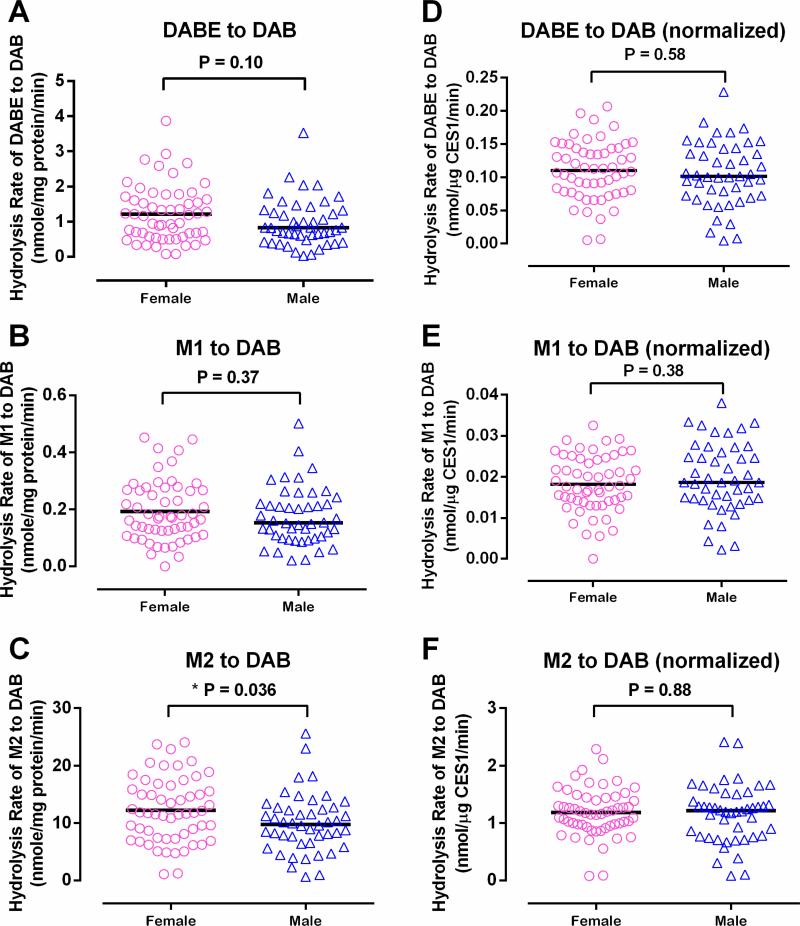
Mean absolute CES1 protein expression in female livers was 17.3% higher than that in male (10.7 ± 4.4 vs 9.1 ± 4.1 ng/μg protein, P = 0.039) (Figure 7). Consistent with CES1 expression, the mean hydrolytic rate of M2 was 22.0% higher in females than males (12.3 ± 5.6 vs 10.0 ± 5.1 nmole/min/mg protein, P = 0.036) (Figure 8). The metabolic rates of DABE and M1 were also higher in females than males (1.2 ± 0.8 vs 1.0 ± 0.7 nmole/min/mg protein and 0.19 ± 0.11 vs 0.18 ± 0.10 nmole/min/mg protein). However, the differences did not reach a statistically significant level. After the activities were normalized to CES1 expression, the gender differences no longer existed (DABE: 0.110 ± 0.044 vs 0.104 ± 0.048 nmol/μg CES1/min, P = 0.58; M1: 0.018 ± 0.007 vs 0.020 ± 0.008 nmol/μg CES1/min, P = 0.38; M2: 1.190 ± 0.418 vs 1.162 ± 0.502 nmol/μg CES1/min, P = 0.88) (Figure 8). Thus, the differences in CES1 expression between genders appear to be the driving force for the greater M2 activation in female livers than that in male.
Figure 7.
Hepatic absolute CES1 protein expression was significantly higher in females than males. Sample size: female: 56; male: 46.
Figure 8.
Gender differences in DABE, M1, and M2 activation in human livers. The activation rates of DABE (A), M1 (B), and M2 (C) in human livers were compared between males and females. The data were also reanalyzed after the activation rates were normalized to the CES1 protein expression levels (D, E, and F). Data are presented as the means from two independent experiments.
4. Discussion
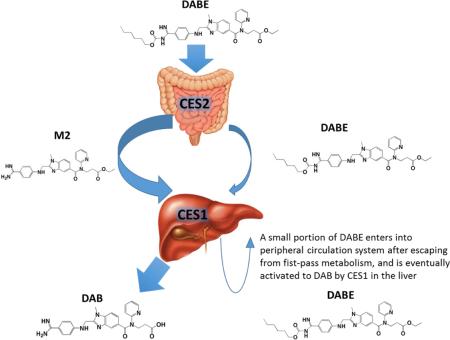
CES1 and CES2 are major hydrolases in humans, and play a critical role in the metabolism of many therapeutic agents, environmental toxins, and endogenous substances [18]. Human CES1 and CES2 differ in expression profiles and substrate preferences [19, 20]. For example, although both CES1 and CES2 are expressed in the liver, CES1 contributes to approximately 90% of hepatic hydrolytic activity in human livers. In comparison, CES2 is highly expressed in the intestine where CES1 is absent. Previous in vitro incubation study suggested that the ethyl and carbamate ester bonds of DABE are hydrolyzed by CES1 and CES2, respectively [9]. Therefore, it was proposed that DABE is converted to the intermediate metabolite M2 after the cleavage of the carbamate bond by CES2 during intestinal absorption. The M2 metabolite is then metabolized by CES1 to the final active metabolite DAB in the liver [9]. In the present study, the formation of DAB was observed after incubation of DABE with purified recombinant human CES1. In addition, CES1 was able to hydrolyze both intermediate metabolites M1 and M2 to DAB. Thus, CES1 is capable of catalyzing the cleavage of both the carbamate (M1) and ethyl (M2) ester bonds of DABE. Consistent with a previous report [9], CES2 can only hydrolyze the carbamate bond. Furthermore, we found that, following incubation of DABE with individual human liver S9 fractions, the rates of DAB formation were much more significantly correlated with CES1 activity relative to CES2 activity, indicating that CES1 is the primary enzyme activating DABE in the liver. Although DABE plasma concentrations have not been determined in patients treated with DABE, a pharmacokinetic study in rats revealed that the prodrug DABE was present in peripheral circulation [21], indicating a portion of DABE can escape from CES2-medicated metabolism in the intestine during absorption, and reach the liver and peripheral circulation system. Thus, we propose a modified DABE activation pathway, in which a small portion of DABE remains intact during intestinal absorption, and then is metabolized to its active form DAB by CES1 in the liver (Figure 9).
Figure 9.
Activation pathway of DABE in humans. DABE is extensively metabolized to the intermediate metabolite M2 by CES2 in the intestine during absorption. M2 and remaining DABE are then metabolized to the active metabolite DAB by CES1 in the liver. A small portion of DABE enters into peripheral circulation system after escaping from fist-pass metabolism, and is eventually activated to DAB by CES1 in the liver.
Hepatic CES1 expression and activity vary markedly among individuals, which is in part due to CES1 genetic polymorphisms [22]. The CES1 SNP G143E is the first clinically significant CES1 variant, and was originally discovered in a poor methylphenidate metabolizer [11, 13]. This SNP is a loss-of-function variant for the metabolism of a number of CES1 substrates [11, 22-24], and was associated with significantly altered pharmacokinetics and/or pharmacodynamics of many drugs metabolized by CES1, such as methylphenidate, oseltamivir, clopidogrel, and several angiotensin-converting enzyme inhibitors [11, 25-29]. In addition to the G143E, other CES1 variations such as the −816A>C (rs3785161) and functional CES1 gene copy numbers were suggested by several clinical studies to be associated with the metabolism of some CES1 substrate drugs [30-32]. However, our recent in vitro CES1 pharmacogenetic studies utilizing individual human livers demonstrated that neither CES1 expression nor activity was affected by the −816AA>C and functional CES1 gene copy variants [22, 33]. Pare and associates conducted a genome-wide association study in RE-LY study participants, and reported that the CES1 SNPs rs2244613 and rs8192935 were associated with lower plasma concentrations of DAB, and the rs2244613 was also associated with a lower risk of bleeding [4]. In addition, a recently published clinical study showed that the SNP rs8192935 carriers exhibited significantly lower plasma trough concentrations of DAB relative to non-carriers [10].
In the present study, the genotypes of the CES1 variants G143E, rs2244613 and rs8192935, and CES1 expression and activity on DABE, M1, and M2 activations were determined in 104 normal human liver samples. As expected, the activations of DABE and the intermediate metabolite M1 and M2 were impaired in samples with the heterozygous143G/E genotype. In particular, the mean activation rate of M2 was decreased by 41% in the 143G/E heterozygotes relative to non-carriers (P=0.026), while the decreases of DABE and M1 metabolisms in heterozygotes didn't reach a statistical significant level when compared to non-carriers. It should be noted that M2 is the most abundant relative to DABE and M1 in the liver before undergoing CES1-mediated metabolism [9]. Thus, the impact of the CES1 variant on M2 activation is more clinically relevant than its effect on the metabolism of DABE and M1. The differences in the activations of all three substrates (i.e., DABE, M1, and M2) between the 143E carriers and non-carriers reached a statistical significance level after the activity was normalized to individual CES1 expression levels, indicating that variability in CES1 expression among the individuals may have partially masked the effect of the G143E on activation of DABE, M1, and M2. Further in vitro study based on CES1-transfected cell lines demonstrated that the G143E is a loss-of-function variant for metabolisms of DABE, M1, and M2. However, contrary to that suggested by two previous clinical studies [4, 10], no association was found between the SNPs rs2244613 and rs8192935 and CES1 expression and activity on DABE activation. Thus, further study is warranted to elucidate the effect of these two CES1 SNPs on CES1 function and their consequent impact on DABE activation.
Sex differences in the expression of drug-metabolizing enzymes exist in humans, which have contributed to gender differences in metabolism and pharmacodynamics of some medications [34]. Previous clinical studies have revealed that plasma concentrations of DAB were significantly higher in females than males [5, 7]. Our recently published study demonstrated that hepatic CES1 expression is greater in females relative to males [12], which may have partially explained the observed sex-dependent metabolisms of several CES1 substrates, such as oseltamivir and methylphenidate, in clinical studies [13, 14]. The present study showed that the metabolisms of DABE and its two intermediate metabolites M1 and M2 were greater in the livers from female donors than that from males, and the gender difference in the activation of M2, the most clinically relevant entity in hepatic DABE metabolism, reached a statistically significant level. The data suggest that higher DAB exposure in females relative to males observed in previous clinical studies might be, at least in part, attributed to gender differences in CES1 expression. However, it remains an open question whether the sex difference in DABE activation can be translated into a different anti-coagulation effect of DABE between genders.
In summary, our present study demonstrated that the CES1 SNP G143E is a loss-of-function variant for DABE, M1, and M2 activation. Based on the effect of the G143E variant on the pharmacokinetics and/or pharmacodynamics of several CES1 substrate drugs reported in previous clinical studies [25-29], it is likely that this variant can impair DABE activation in humans. However, the CES1 SNPs rs2244613 and rs8192935, which were found to be associated with DAB exposure in a genome-wide association study, were not associated with CES1 expression and the activation of DABE and its intermediate metabolites in human livers. It should be noted that over 2000 CES1 genetic polymorphisms have been identified to date. The majority of these variants have not been studied for their potential effects on CES1 function. Thus, a thorough basic CES1 pharmacogenetic study is urgently needed to identify functional CES1 variants and determine the impact of those variants on metabolism and therapeutic outcome of DABE and many other medications metabolized by CES1. Furthermore, this study suggests that hepatic DABE activation occurs at a significantly greater rate in females than males. Thus, further studies about the contribution of specific CES1 variants and gender to interindividual variability in response to DABE will assist in the development of personalized DABE therapy and eventually lead to improved therapeutic outcomes.
Acknowledgments
Funding
This study was supported in part by the National Center for Advancing Translational Sciences of the National Institutes of Health [2UL1TR000433] (Hao-Jie Zhu), the National Institute on Aging [R21AG048500] (Hao-Jie Zhu), the National Heart, Lung, and Blood Institute [R01HL126969] (Hao-Jie Zhu).
Footnotes
Publisher's Disclaimer: This is a PDF file of an unedited manuscript that has been accepted for publication. As a service to our customers we are providing this early version of the manuscript. The manuscript will undergo copyediting, typesetting, and review of the resulting proof before it is published in its final citable form. Please note that during the production process errors may be discovered which could affect the content, and all legal disclaimers that apply to the journal pertain.
Conflict of interests
The authors declare no conflict of interest exists.
Reference
- 1.Blommel ML, Blommel AL. Dabigatran etexilate: A novel oral direct thrombin inhibitor. American journal of health-system pharmacy : AJHP : official journal of the American Society of Health-System Pharmacists. 2011;68:1506–19. doi: 10.2146/ajhp100348. [DOI] [PubMed] [Google Scholar]
- 2.Schulman S, Kearon C, Kakkar AK, Mismetti P, Schellong S, Eriksson H, et al. Dabigatran versus warfarin in the treatment of acute venous thromboembolism. N Engl J Med. 2009;361:2342–52. doi: 10.1056/NEJMoa0906598. [DOI] [PubMed] [Google Scholar]
- 3.Connolly SJ, Ezekowitz MD, Yusuf S, Eikelboom J, Oldgren J, Parekh A, et al. Dabigatran versus warfarin in patients with atrial fibrillation. N Engl J Med. 2009;361:1139–51. doi: 10.1056/NEJMoa0905561. [DOI] [PubMed] [Google Scholar]
- 4.Pare G, Eriksson N, Lehr T, Connolly S, Eikelboom J, Ezekowitz MD, et al. Genetic determinants of dabigatran plasma levels and their relation to bleeding. Circulation. 2013;127:1404–12. doi: 10.1161/CIRCULATIONAHA.112.001233. [DOI] [PubMed] [Google Scholar]
- 5.Stangier J, Stahle H, Rathgen K, Fuhr R. Pharmacokinetics and pharmacodynamics of the direct oral thrombin inhibitor dabigatran in healthy elderly subjects. Clin Pharmacokinet. 2008;47:47–59. doi: 10.2165/00003088-200847010-00005. [DOI] [PubMed] [Google Scholar]
- 6.Blech S, Ebner T, Ludwig-Schwellinger E, Stangier J, Roth W. The metabolism and disposition of the oral direct thrombin inhibitor, dabigatran, in humans. Drug Metab Dispos. 2008;36:386–99. doi: 10.1124/dmd.107.019083. [DOI] [PubMed] [Google Scholar]
- 7.Stangier J, Eriksson BI, Dahl OE, Ahnfelt L, Nehmiz G, Stahle H, et al. Pharmacokinetic profile of the oral direct thrombin inhibitor dabigatran etexilate in healthy volunteers and patients undergoing total hip replacement. J Clin Pharmacol. 2005;45:555–63. doi: 10.1177/0091270005274550. [DOI] [PubMed] [Google Scholar]
- 8.Reilly PA, Lehr T, Haertter S, Connolly SJ, Yusuf S, Eikelboom JW, et al. The effect of dabigatran plasma concentrations and patient characteristics on the frequency of ischemic stroke and major bleeding in atrial fibrillation patients: the RE-LY Trial (Randomized Evaluation of Long-Term Anticoagulation Therapy). J Am Coll Cardiol. 2014;63:321–8. doi: 10.1016/j.jacc.2013.07.104. [DOI] [PubMed] [Google Scholar]
- 9.Laizure SC, Parker RB, Herring VL, Hu ZY. Identification of carboxylesterase-dependent dabigatran etexilate hydrolysis. Drug Metab Dispos. 2014;42:201–6. doi: 10.1124/dmd.113.054353. [DOI] [PMC free article] [PubMed] [Google Scholar]
- 10.Dimatteo C, D'Andrea G, Vecchione G, Paoletti O, Cappucci F, Tiscia GL, et al. Pharmacogenetics of dabigatran etexilate interindividual variability. Thromb Res. 2016;144:1–5. doi: 10.1016/j.thromres.2016.05.025. [DOI] [PubMed] [Google Scholar]
- 11.Zhu HJ, Patrick KS, Yuan HJ, Wang JS, Donovan JL, DeVane CL, et al. Two CES1 gene mutations lead to dysfunctional carboxylesterase 1 activity in man: clinical significance and molecular basis. Am J Hum Genet. 2008;82:1241–8. doi: 10.1016/j.ajhg.2008.04.015. [DOI] [PMC free article] [PubMed] [Google Scholar]
- 12.Shi J, Wang X, Eyler RF, Liang Y, Liu L, Mueller BA, et al. Association of Oseltamivir Activation with Gender and Carboxylesterase 1 Genetic Polymorphisms. Basic Clin Pharmacol Toxicol. 2016 doi: 10.1111/bcpt.12625. [DOI] [PMC free article] [PubMed] [Google Scholar]
- 13.Patrick KS, Straughn AB, Minhinnett RR, Yeatts SD, Herrin AE, DeVane CL, et al. Influence of ethanol and gender on methylphenidate pharmacokinetics and pharmacodynamics. Clin Pharmacol Ther. 2007;81:346–53. doi: 10.1038/sj.clpt.6100082. [DOI] [PMC free article] [PubMed] [Google Scholar]
- 14.Wattanagoon Y, Stepniewska K, Lindegardh N, Pukrittayakamee S, Silachamroon U, Piyaphanee W, et al. Pharmacokinetics of high-dose oseltamivir in healthy volunteers. Antimicrob Agents Chemother. 2009;53:945–52. doi: 10.1128/AAC.00588-08. [DOI] [PMC free article] [PubMed] [Google Scholar]
- 15.Wang X, Wang G, Shi J, Aa J, Comas R, Liang Y, et al. CES1 genetic variation affects the activation of angiotensin-converting enzyme inhibitors. The pharmacogenomics journal. 2015 doi: 10.1038/tpj.2015.42. [DOI] [PMC free article] [PubMed] [Google Scholar]
- 16.Wang J, Williams ET, Bourgea J, Wong YN, Patten CJ. Characterization of recombinant human carboxylesterases: fluorescein diacetate as a probe substrate for human carboxylesterase 2. Drug Metab Dispos. 2011;39:1329–33. doi: 10.1124/dmd.111.039628. [DOI] [PubMed] [Google Scholar]
- 17.Wang X, Liang Y, Liu L, Shi J, Zhu HJ. Targeted absolute quantitative proteomics with SILAC internal standards and unlabeled full-length protein calibrators (TAQSI). Rapid communications in mass spectrometry : RCM. 2016;30:553–61. doi: 10.1002/rcm.7482. [DOI] [PMC free article] [PubMed] [Google Scholar]
- 18.Satoh T, Taylor P, Bosron WF, Sanghani SP, Hosokawa M, La Du BN. Current progress on esterases: from molecular structure to function. Drug Metab Dispos. 2002;30:488–93. doi: 10.1124/dmd.30.5.488. [DOI] [PubMed] [Google Scholar]
- 19.Imai T, Taketani M, Shii M, Hosokawa M, Chiba K. Substrate specificity of carboxylesterase isozymes and their contribution to hydrolase activity in human liver and small intestine. Drug Metab Dispos. 2006;34:1734–41. doi: 10.1124/dmd.106.009381. [DOI] [PubMed] [Google Scholar]
- 20.Imai T. Human carboxylesterase isozymes: catalytic properties and rational drug design. Drug Metab Pharmacokinet. 2006;21:173–85. doi: 10.2133/dmpk.21.173. [DOI] [PubMed] [Google Scholar]
- 21.Li J, Fang J, Zhong F, Li W, Tang Y, Xu Y, et al. Development and validation of a liquid chromatography/tandem mass spectrometry assay for the simultaneous determination of dabigatran etexilate, intermediate metabolite and dabigatran in 50muL rat plasma and its application to pharmacokinetic study. J Chromatogr B Analyt Technol Biomed Life Sci. 2014;973c:110–9. doi: 10.1016/j.jchromb.2014.09.025. [DOI] [PubMed] [Google Scholar]
- 22.Wang X, Wang G, Shi J, Aa J, Comas R, Liang Y, et al. CES1 genetic variation affects the activation of angiotensin-converting enzyme inhibitors. Pharmacogenomics J. 2016;16:220–30. doi: 10.1038/tpj.2015.42. [DOI] [PMC free article] [PubMed] [Google Scholar]
- 23.Zhu HJ, Wang X, Gawronski BE, Brinda BJ, Angiolillo DJ, Markowitz JS. Carboxylesterase 1 as a determinant of clopidogrel metabolism and activation. J Pharmacol Exp Ther. 2013;344:665–72. doi: 10.1124/jpet.112.201640. [DOI] [PubMed] [Google Scholar]
- 24.Zhu HJ, Appel DI, Johnson JA, Chavin KD, Markowitz JS. Role of carboxylesterase 1 and impact of natural genetic variants on the hydrolysis of trandolapril. Biochem Pharmacol. 2009;77:1266–72. doi: 10.1016/j.bcp.2008.12.017. [DOI] [PubMed] [Google Scholar]
- 25.Nemoda Z, Angyal N, Tarnok Z, Gadoros J, Sasvari-Szekely M. Carboxylesterase 1 gene polymorphism and methylphenidate response in ADHD. Neuropharmacology. 2009;57:731–3. doi: 10.1016/j.neuropharm.2009.08.014. [DOI] [PubMed] [Google Scholar]
- 26.Tarkiainen EK, Backman JT, Neuvonen M, Neuvonen PJ, Schwab M, Niemi M. Carboxylesterase 1 polymorphism impairs oseltamivir bioactivation in humans. Clin Pharmacol Ther. 2012;92:68–71. doi: 10.1038/clpt.2012.13. [DOI] [PubMed] [Google Scholar]
- 27.Tarkiainen EK, Tornio A, Holmberg MT, Launiainen T, Neuvonen PJ, Backman JT, et al. Effect of carboxylesterase 1 c.428G > A single nucleotide variation on the pharmacokinetics of quinapril and enalapril. Br J Clin Pharmacol. 2015;80:1131–8. doi: 10.1111/bcp.12667. [DOI] [PMC free article] [PubMed] [Google Scholar]
- 28.Tarkiainen EK, Holmberg MT, Tornio A, Neuvonen M, Neuvonen PJ, Backman JT, et al. Carboxylesterase 1 c.428G>A single nucleotide variation increases the antiplatelet effects of clopidogrel by reducing its hydrolysis in humans. Clin Pharmacol Ther. 2015;97:650–8. doi: 10.1002/cpt.101. [DOI] [PubMed] [Google Scholar]
- 29.Lewis JP, Horenstein RB, Ryan K, O'Connell JR, Gibson Q, Mitchell BD, et al. The functional G143E variant of carboxylesterase 1 is associated with increased clopidogrel active metabolite levels and greater clopidogrel response. Pharmacogenet Genomics. 2013;23:1–8. doi: 10.1097/FPC.0b013e32835aa8a2. [DOI] [PMC free article] [PubMed] [Google Scholar]
- 30.Zou J-J, Chen S-L, Fan H-W, Tan J, He B-S, Xie H-G. The CES1A -816C as a genetic marker to predict greater platelet clopidogrel response in patients with percutaneous coronary intervention. Journal of Cardiovascular Pharmacology. 2014;63:178–83. doi: 10.1097/FJC.0000000000000037. [DOI] [PubMed] [Google Scholar]
- 31.Xie C, Ding X, Gao J, Wang H, Hang Y, Zhang H, et al. The effects of CES1A2 A (− 816) C and CYP2C19 loss-of-function polymorphisms on clopidogrel response variability among Chinese patients with coronary heart disease. Pharmacogenet Genomics. 2014;24:204–10. doi: 10.1097/FPC.0000000000000035. [DOI] [PubMed] [Google Scholar]
- 32.Geshi E, Kimura T, Yoshimura M, Suzuki H, Koba S, Sakai T, et al. A single nucleotide polymorphism in the carboxylesterase gene is associated with the responsiveness to imidapril medication and the promoter activity. Hypertens Res. 2005;28:719–25. doi: 10.1291/hypres.28.719. [DOI] [PubMed] [Google Scholar]
- 33.Zhu HJ, Langaee TY, Gong Y, Wang X, Pepine CJ, Cooper-DeHoff RM, et al. CES1P1 variant -816A>C is not associated with hepatic carboxylesterase 1 expression and activity or antihypertensive effect of trandolapril. Eur J Clin Pharmacol. 2016;72:681–7. doi: 10.1007/s00228-016-2029-x. [DOI] [PMC free article] [PubMed] [Google Scholar]
- 34.Waxman DJ, Holloway MG. Sex differences in the expression of hepatic drug metabolizing enzymes. Mol Pharmacol. 2009;76:215–28. doi: 10.1124/mol.109.056705. [DOI] [PMC free article] [PubMed] [Google Scholar]


