Fig. 1.

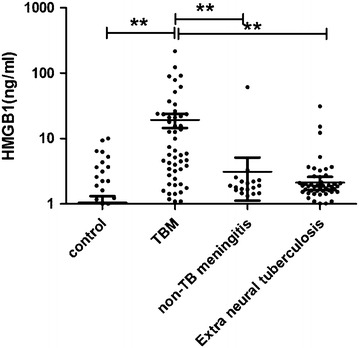
Dot plots of CSF HMGB1 in TBM, non-TB meningitis, extra neural tuberculosis, and control groups. The mean CSF HMGB1 was significantly higher in TBM group than others (p < 0.001)

Dot plots of CSF HMGB1 in TBM, non-TB meningitis, extra neural tuberculosis, and control groups. The mean CSF HMGB1 was significantly higher in TBM group than others (p < 0.001)