

Abstract
Aim
Daclizumab high yield process (HYP) is a humanized IgG1 monoclonal antibody that binds to the α‐subunit of the interleukin‐2 receptor and is being developed for treatment of multiple sclerosis (MS). This manuscript characterized the pharmacokinetic–pharmacodynamic (PK–PD) relationships of daclizumab HYP in subjects with MS.
Methods
Approximately 1400 subjects and 7000 PD measurements for each of three biomarkers [CD25 occupancy, CD56bright natural killer (NK) cell count, regulatory T cell (Treg) count] from four clinical trials were analyzed using non‐linear mixed effects modelling. Evaluated regimens included 150 or 300 mg subcutaneous (s.c.) every 4 weeks.
Results
CD25 occupancy was characterized using a sigmoidal maximum response (Emax) model. Upon daclizumab HYP treatment, CD25 saturation was rapid with complete saturation occurring after approximately 7 h and maintained when daclizumab HYP serum concentration was ≥5 mg l‐1. After the last 150 mg s.c. dose, unoccupied CD25 returned to baseline levels in approximately 24 weeks, with daclizumab HYP serum concentration approximately ≤1 mgl‐11L. CD56bright NK cell expansion was characterized using an indirect response model. Following daclizumab HYP 150 mg s.c. every 4 weeks, expansion plateaus approximately at week 36, at which the average maximum expansion ratio is 5.2. After the last dose, CD56bright NK cells gradually declined to baseline levels within 24 weeks. Treg reduction was characterized by a sigmoidal Emax model. Average maximum reduction of 60% occurred approximately 4 days post 150 mg s.c. dose. After the last dose, Tregs were projected to return to baseline levels in approximately 20 weeks.
Conclusions
Robust PK–PD models of CD25 occupancy, CD56bright NK cell expansion and Treg reduction by daclizumab HYP were developed to characterize its key pharmacodynamic effects in the target patient population.
Keywords: CD56bright NK cells, daclizumab HYP, multiple sclerosis, PK–PD, CD25 occupancy, regulatory T cells
What is Already Known about this Subject
Daclizumab high yield process (DAC HYP) is a humanized monoclonal antibody that selectively blocks the α‐subunit (CD25) of the high affinity interleukin‐2 receptors.
Treatment with daclizumab HYP results in expansion of the CD56bright NK cells and reduction of Tregs.
In a large phase 3 trial, daclizumab HYP showed efficacy that was superior to interferon β‐1a and a manageable safety profile with patient monitoring, in treatment of relapsing remitting MS (RRMS).
What this Study Adds
This study characterized the relationships between DAC HYP serum exposure and its PD effects including CD25 occupancy on target T cells, CD56bright NK cell expansion and reduction of Tregs in subjects with RRMS.
These analyses integrate available PD data of daclizumab HYP from its phase 2 and 3 clinical trials in subjects with RRMS.
Introduction
Multiple sclerosis (MS) is a chronic inflammatory autoimmune disease of the central nervous system, characterized by focal areas of demyelination, astrogliosis, the relative preservation of axons and varying degrees of inflammation 1.
The interleukin‐2 (IL‐2) pathway plays a central role in the activation and regulation of immune responses and therefore might be important in the pathogenesis of MS. The IL‐2 receptor exists as both an intermediate‐affinity receptor and a high‐affinity receptor 2, 3. Both receptor complexes utilize identical signalling molecules CD122 and CD132, but the high affinity IL‐2 receptor includes an accessory α‐subunit, CD25, which does not contain a signalling domain but does increase the affinity of the receptor for IL‐2. CD25 is expressed at low levels on resting T cells but is rapidly upregulated after T cell activation, which enhances high affinity interleukin‐2 signalling 2, 3.
Daclizumab high yield process (DAC HYP) is a humanized IgG1 monoclonal antibody that binds to the α subunit of the human high affinity IL‐2 receptor (CD25) expressed on the surface of activated T cells, thereby inhibiting high affinity but not intermediate affinity IL‐2 receptor signalling 4, 5, 6. Daclizumab HYP was tested as a potential treatment for MS, based on the assumption that it would block the activation and expansion of activated T cells that are central to the pathogenesis of MS. In a phase 2 monotherapy study (SELECT) in subjects with replasing remitting MS (RRMS), subcutaneous (s.c.) daclizumab HYP significantly reduced the annualized relapse rate (ARR) compared with placebo 7. A phase 3 study (DECIDE) of daclizumab HYP in subjects with RRMS demonstrated a consistently superior efficacy to IFN β‐1a, along with a manageable safety profile 8.
Several pharmacodynamic (PD) parameters have been explored in daclizumab HYP MS studies based on their relationship to IL‐2 signalling modulation. In clinical studies of MS subjects, the PD responses observed included sustained CD25 saturation on peripheral T cells, a decrease in regulatory T cells (Tregs) and an an increase in serum IL‐2 and CD56bright natural killer (NK) cells during daclizumab HYP treatment 9. T cell and B cell counts decreased ≤10% from baseline during the first year of daclizumab HYP treatment, while total NK cell counts increased approximately 1.5‐fold as a result of the change in CD56bright NK cells 10. Overall, the PD responses observed had a rapid onset of action after the first dose of daclizumab HYP, sustained during daclizumab HYP treatment and reversible during a 6 month washout period 9. This manuscript aims to characterize the population PK–PD relationships quantitatively for CD25 occupancy on target T cells, CD56bright NK cell expansion and regulatory T cell reduction by daclizumab HYP in subjects with MS from four clinical trials.
Methods
Clinical studies
Two phase 2, one immunogenicity and one phase 3 studies were included in the population PK–PD analyses. 205MS201 (SELECT) was a phase 2, multicentre, randomized, double‐blind, placeb ‐controlled, dose finding study in subjects with MS that tested 150 or 300 mg daclizumab HYP given s.c. every 4 weeks for 1 year. A total of 621 subjects were enrolled in a 52 week treatment phase. Subjects who completed the 52 week treatment phase without a major change in their medical status were eligible to enrol in the blinded extension study 205MS202 (SELECTION) to continue dosing with daclizumab HYP. In 205MS202 (SELECTION), a systematic evaluation of a treatment washout period was performed to determine the impact of treatment discontinuation. A total of 517 subjects were randomized to three treatment cohorts: subjects with continuing exposure to daclizumab HYP, subjects randomized to washout followed by re‐initiation of daclizumab HYP and subjects with first exposure to daclizumab HYP. Subjects received either daclizumab HYP 150 or 300 mg s.c. every 4 weeks for a total of 13 doses or placebo s.c. every 4 weeks for a total of five doses (24 week washout) followed by daclizumab HYP 150 or 300 mg s.c. every 4 weeks for a total of eight doses. The trial design for SELECT and SELECTION is illustrated in Appendix S1 and was previously presented 7, 11.
205MS302 (OBSERVE) was a multicentre, single arm, open label study to assess the immunogenicity, PK, PD and tolerability of daclizumab HYP when administered s.c. using a pre‐filled syringe in subjects with RRMS. A total of 113 subjects were enrolled, of whom 26 subjects were enrolled in the intensive PK/PD substudy. Eligible subjects received daclizumab HYP 150 mg s.c. injections every 4 weeks for a total of six injections in the main study. Following a screening period, subjects received daclizumab HYP over a 24 week treatment period and then entered a 20 week washout period for monthly assessment of immunogenicity, PK, PD, safety and tolerability.
205MS301 (DECIDE) was a phase 3, multicentre, double‐blind, randomized, parallel group, monotherapy, active control study to determine the efficacy and safety of daclizumab HYP vs. IFN β‐1a (Avonex®) in subjects with RRMS. A total of 919 subjects were enrolled in the daclizumab HYP treatment group and the dosing regimen was 150 mg s.c. every 4 weeks for 96 to 144 weeks 8.
PD sampling schedules for the clinical studies are summarized in Table 1.
Table 1.
PD sampling schedule
| Study | PD sampling schedule |
|---|---|
| 205MS302 (OBSERVE) | Intensive PK/PD subgroup: predose, 8 h, 24 h, 72 h, 120 h, day 7, 10, 14, 21 and post‐dose at week 20 |
| Non‐intensive PK/PD subgroup: Week 0, 2, 4, 8, 12, 16, 20, 24, (28, 32, 36, 44, 188)† | |
| 205MS201 (SELECT) | Week 0, 4, 8, 16, 24, 32, 40, 48, (52, 56, 64, 72)‡ |
| 205MS202 (SELECTION) | Week 0, 4, 8, 12, 16, 20, 24, 32, 40, 52, (72)§ |
| 205MS301 (DECIDE) | Week 0, 4, 12, 24, 36, 48, 60, 72, 84, 96, 108, 120, 132, 144, 156, 164 |
Follow‐up visits;
Subjects who do not rollover to 205MS202, follow‐up period;
Subjects who do not rollover to 205MS203 (SELECTON extension), follow‐up period.
Bioanalysis
CD25 occupancy was measured by a validated fluorescence‐activated cell sorter (FACS) assay, which detects CD25 expression and occupancy in the presence of anti‐CD25 therapeutic antibody daclizumab HYP on the surface of peripheral blood T cells, by specifically gating on CD3+, CD4+ or CD8+ T cells. The CD25 assay utilized an anti‐CD25 antibody that competes with daclizumab for binding to CD25 to assess receptor occupancy and a daclizumab non‐competing anti‐CD25 antibody to assess receptor expression and detect the CD25+ T cell population in the presence of daclizumab. Briefly, 100 μl whole blood aliquots were incubated with appropriate antibody cocktails containing antibodies to CD25 (competing or non‐competing), CD3, CD4 and CD8, for 20 min in the dark at room temperature. After incubation, red blood cells (RBCs) were lyzed and the remaining leukocytes washed with 1x phosphate buffered saline with 2% normal calf serum (PBS‐NCS). The samples were then resuspended, fixed (1% paraformaldehyde) and analyzed on a BD FACSCaliburTM flow cytometer. PD measurement is the percentage of CD4+ T cells staining positive for unoccupied CD25. Saturation of the CD25 occupancy is defined as ≤1% of the CD4+ T cells stained positive for unoccupied CD25 12.
Validated FACS assays were used to quantify CD56bright NK cells and regulatory T cells (Tregs). The PD measurements are percentage of CD56bright NK cells among all lymphocytes (T, B and NK cells) and percentage of Tregs (CD4+CD127low/−/Foxp3+) among all CD4+ T cells.
Population PK–PD modelling
A sequential approach was implemented for the PK–PD modelling where the PK component was fixed based on the prior population PK analysis 13. In summary, a two compartment model with first order absorption and elimination adequately described the PK of daclizumab HYP in subjects with RRMS. Clearance was 0.212 l day–1 and central volume of distribution was 3.92 l, scaled by [body weight(kg)/68] with exponents of 0.87 and 1.12, respectively. Peripheral volume of distribution was 2.42 l. Subcutaneous absorption half‐life, lag time and bioavailability were 5 days, 1.61 h and 88% (100–300 mg), respectively. Time‐varying neutralizing antibody positive status increased the daclizumab HYP CL by 19%. Inter‐individual variability (IIV) for CL, V 2 and K a were 27.2, 50.9 and 94.4%, respectively.
Both PK and PD observations were included in the PK–PD modelling to derive the PD parameters. nonmem (version 7.2, ICON Development Solutions, Ellicott City, MD, USA), run within a UNIX‐based cluster of computers, was used for the modelling. Perl Speaks NONMEM (PsN, Version 3.5.3) was used to conduct bootstrapping. Xpose4 (version 4.3.2, Pharmacometrics Research Group, Uppsala University, Sweden), a module written for the statistical program R, was used to assist in diagnostics plotting. First order conditional estimation with interaction (FOCEI) was used as the estimation method. Inter‐individual variability (IIV) was modelled using log normal or normal distribution as appropriate. Residual variability was modelled with proportional and/or additive errors as appropriate.
Potential outliers were identified as observations with extreme CWRES in the base model. If these observations looked discordant, they were excluded from the dataset prior to the modelling. Seventy‐one (0.9%), 15(0.2%) and 11(0.1%) PD records were excluded as outliers from the CD25, CD56bright NK and Treg datasets, respectively.
The statistical criterion for the model selection is based on comparison of the minimum objective function value (OFV), a value representative of minus twice the log likelihood value. Comparisons of nested models were based on the likelihood ratio test, which follows a chi‐square distribution. A decrease in nonmem OFV of 6.63 points was necessary to consider the improvement in model performance statistically significant at P< 0.01 and one degree of freedom.
Model selection was further aided by goodness‐of‐fit plots, including DV (observed PD measurement) vs. population prediction (PRED), DV vs. individual prediction (IPRED), conditional weighted residual (CWRES) vs. TIME and CWRES vs. PRED plots. Other diagnostics also were utilized to help select the appropriate model, including parameter precision, IIV and CWRES distribution and IIV shrinkage.
Model evaluations
Robustness of the model was evaluated using a non‐parametric bootstrap. Subjects were randomly sampled with replacement from the original dataset to form 2000 new datasets. The model parameters were then estimated using the bootstrap datasets. The median and 95% confidence interval (2.5th to 97.5th percentiles) for each parameter were calculated from the successfully converging runs and compared with point estimates from the original dataset.
Visual predictive check (VPC) was used to check the adequacy of the model. The final model PK parameters were utilized to simulate 2000 replicates of the observed data. Simulations were stratified by study, dose and group (intensive vs. non‐intensive in OBSERVE; washout vs. non‐washout in SELECT/SELECTION). Median, 10th and 90th percentiles of the observed and simulated were plotted along with the observations.
Results
Demographics and subject disposition
The number of subjects and records included in the PK–PD datasets are summarized in Table 2. Demographics and immunogenicity of subjects for the three studies (SELECT/SELECTION, OBSERVE and DECIDE) can be found in a population PK analysis published previously 13. Twenty‐five subjects in OBSERVE had intensive PK profiles and 174 subjects in SELECTION had a 24 week washout period. The treatment–withdrawal design of SELECT/SELECTION provided an opportunity to evaluate the effect of interruption of daclizumab HYP treatment on PD parameters during the daclizumab HYP washout period.
Table 2.
Summary of the number of subjects and records in the PK–PD datasets
| PD biomarker | Number | SELECT/SELECTION | OBSERVE | DECIDE | Total |
|---|---|---|---|---|---|
| CD25 | Subject | 580 | 113 | 766 | 1459 |
| PD record | 5123 | 974 | 1525 | 7622 | |
| NK | Subject | 561 | 107 | 737 | 1405 |
| PD record | 5071 | 922 | 3637 | 9630 | |
| Treg | Subject | 545 | 106 | 702 | 1353 |
| PD record | 4835 | 891 | 3016 | 8742 |
Modelling of CD25 occupancy
Because target T cells are in the blood stream instead of tissues, binding of daclizumab HYP in the circulation to CD25 is a direct rather than indirect effect. A sigmoidal maximum response (Emax) model was utilized to characterize unoccupied CD25 (denoted as CD25 in equation (1)) on peripheral T cells in subjects with RRMS upon treatment with daclizumab HYP. C p denotes daclizumab HYP serum concentration. Since CD25 occupancy can be completely saturated by daclizumab HYP, the Emax value was fixed at 1 in the model.
| (1) |
Since the OBSERVE intensive substudy contained the most informative sampling schedule about the saturation phase of CD25 occupancy, OBSERVE intensive data were singled out to characterize the saturation of CD25 occupancy by daclizumab HYP. However, the PD model estimates from the OBSERVE intensive data cannot describe well the desaturation phase for the SELECTION washout period (data not shown). Separate parameters were needed to characterize the rapid saturation of CD25 occupancy for the first dose and the apparently slower desaturation during the treatment discontinuation. This finding was consistent with a previous analysis of CD25 occupancy in healthy volunteers in phase 1 studies 14.
In the final model, the Hill coefficient and IC 50 for the saturation phase were fixed as those from OBSERVE intensive data and for the SELECTION washout desaturation phase, separate Hill coefficients and IC 50 were estimated. The parameter estimates are listed in Table 3. The mean (SD) for the baseline CD25 occupancy (percentage of CD4+ T cells staining positive for unoccupied CD25) was 56 (11). IC 50 and Hill coefficient for the saturation phase were 0.0135 mg l–1 (estimated for the OBSERVE intensive subgroup data) and 1 (fixed), respectively. A higher IC 50 was estimated for CD25 desaturation during daclizumab HYP washout period (2.07 mg l–1, with a Hill coefficient of 4.4 and IIV of 46.9%) than during the initial binding. A covariance step was not successful for the final model, therefore, the % relative standard error for the parameters are not presented. Bootstrap results for model 3 are listed in Table 3, which indicate that the model is stable. The diagnostic plots for this model are included in Appendix S2. The VPC plots are described in Appendix S3, which demonstrate consistency between simulated data and the observations. However, there were some outliers with faster CD25 desaturation resulting in some apparent bias in the diagnostic plots.
Table 3.
Summary of CD25 occupancy model
| Parameter | Value* | Bootstrap median (2.5th, 97.5th)† |
|---|---|---|
| Baseline E0 ‡, % | 56 | 56 (55, 56) |
| IIV (additive) | 11 | 11 (10, 11) |
| Saturation | ||
| IC50 (mg l–1) | 0.0135 (FIXED)§ | ‐‐‐ |
| Hill coefficient (γ) | 1 (FIXED)§ | ‐‐‐ |
| Desaturation | ||
| IC50 (mg l–1) | 2.07 | 2.02 (1.50, 2.39) |
| IIV, % | 47 | 47 (36, 79) |
| Hill coefficient (γ) | 4.44 | 4.35 (3.19, 5.19) |
| Residual error (additive) | 4.02 | 4.03 (3.13, 4.72) |
Summary from 1454 successful runs out of 2000 runs;
Percentage of CD4+ T cells staining positive for unoccupied CD25;
IC 50 and γ fixed as that estimated using OBSERVE intensive subgroup PK data and 1, respectively;
ETA shrinkages for baseline E0 and desaturation IC 50 are 10.4% and 76.1%, respectively. EPS shrinkage for additive residual error is 9.1%
CD25 occupancy saturation following the first 150 mg s.c. dose for a typical subject is simulated in Figure 1A. Onset of CD25 occupancy is predicted to be rapid with complete saturation occurring after approximately 7 h, which is consistent with the data from the OBSERVE substudy, which demonstrates 100% CD25 occupancy by daclizumab HYP for the majority of the subjects at the earliest time point 8 h post‐dose. Saturation of CD25 occupancy is predicted to be maintained when daclizumab HYP serum concentration ≥ 5 mg l–1.
Figure 1.
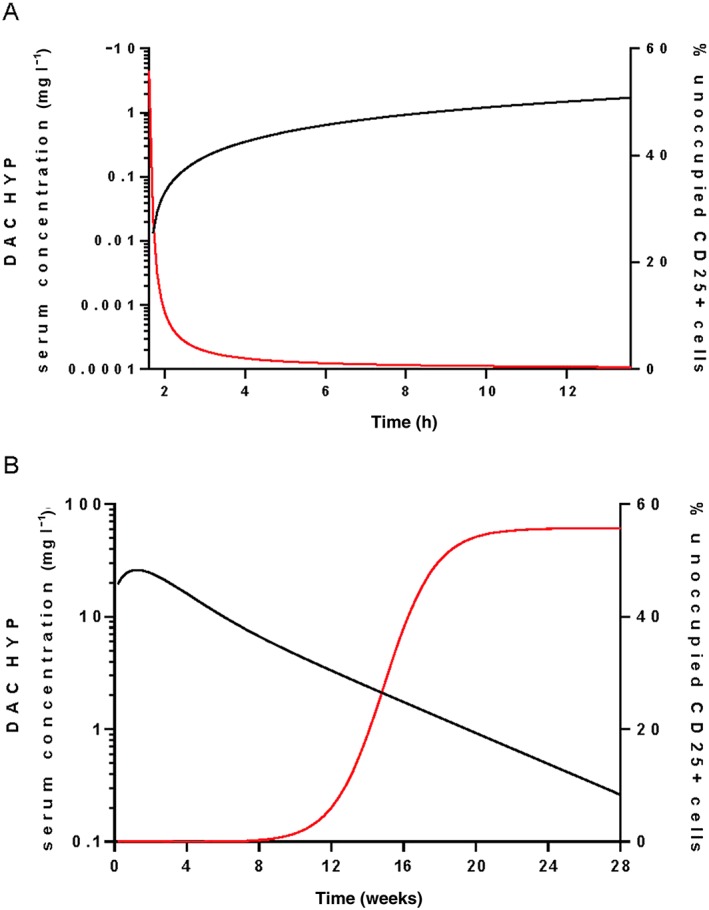
Simulated CD25 occupancy profile following A) the first daclizumab HYP s.c. 150 mg dose and B) the last daclizumab HYP s.c. 150 mg dose every 4 weeks at steady‐state. ― DAC HYP, ― Unoccupied CD25
Desaturation of CD25 occupancy after the last 150 mg s.c. dose at steady‐state for a typical subject is plotted in Figure 1B. After the last 150 mg s.c. dose at steady‐state, unoccupied CD25 returned to baseline levels in approximately 24 weeks, with a daclizumab HYP serum concentration of approximately ≤1 mg l–1.
Modelling of CD56bright NK cell expansion
Expansion of CD56bright NK cells by daclizumab HYP is hypothesized through the increased availability of T cell‐derived IL‐2 for NK cell signalling 15. Thus an indirect response model was utilized with the drug effect modelled using a stimulatory Smax function on the zero order rate K in of production of NK cells (Equation (2)). In the equation, K out is the first order rate constant for elimination of CD56bright NK cells, C p denotes daclizumab HYP serum concentration and Smax is the maximum stimulatory factor attributed to daclizumab HYP.
| (2) |
K out was expressed as a function of K in using baseline information in the modelling and therefore was not independently estimated. The model estimates are listed in Table 4. Diagnostic plots are presented in Appendix S4. The median and mean baselines for CD56bright NK cell percentage are 0.6% and 0.75% among all the lymphocytes, respectively. A covariance step was not successful for the final model, therefore, the % relative standard error for the parameters are not presented. Median and 95% CI for the PD parameters, as well as IIV and residual variability from the bootstrap, are consistent with model estimates indicating that the model is stable. VPC plots also indicate the good performance of the model (Appendix S5).
Table 4.
Summary of CD56bright NK cell expansion model
| Parameter | Value * | Bootstrap median (2.5th, 97.5th)† |
|---|---|---|
| Kin, %/h | 4.12E‐04 | 4.1E‐04 (3.7E‐04, 4.5E‐04) |
| IIV (%) | 97 | 97 (90, 104) |
| Smax | 7.89 | 7.88 (7.12, 8.89) |
| IIV(%) | 67 | 67 (64, 71) |
| EC50 (mg l–1) | 18.0 | 17.8 (14.2, 22.8) |
| Residual error (proportional), % | 29.1 | 29.0 (28.2, 29.9) |
Summary from 1978 successful runs out of 2000 runs;
ETA shrinkages for K in and Smax are 25% and 10.6%, respectively. EPS shrinkage for proportional residual error is 9.7%
The CD56bright NK cell expansion time profile was simulated following daclizumab HYP 150 mg s.c. every 4 weeks for 48 weeks, then treatment discontinuation for 24 weeks and re‐initiation of 150 mg s.c. every 4 weeks for 48 weeks (Figure 2). There is a significant expansion plateauing approximately at week 36, at which the CD56bright NK cell maximum expansion ratio is 5.2. After dosing discontinuation at week 48, CD56bright NK cell percentage gradually declines to approximately the baseline in 24 weeks. After re‐initiation of treatment at week 72, CD56bright NK cell expansion mirrored the first year of treatment.
Figure 2.
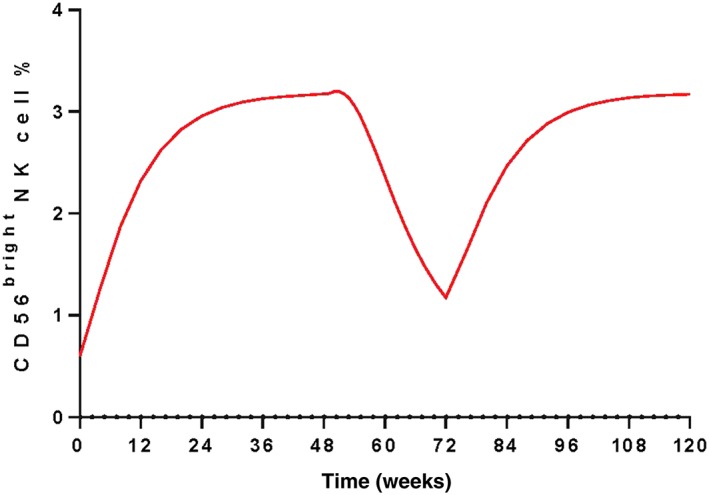
Simulated CD56bright NK cell percent following daclizumab HYP 150 mg s.c. every 4 weeks for 48 weeks, then the treatment discontinuation for 24 weeks and re‐initiation of daclizumab HYP 150 mg s.c. every 4 weeks at week 72 for another 48 weeks
Modelling of Treg reduction
A sigmoidal Emax model was utilized to characterize the reduction of Treg (equation (3)).
| (3) |
Model parameters are listed in Table 5 and the diagnostic plots are presented in Appendix S6. An Emax value of 0.610 indicates that the average maximum reduction by daclizumab HYP is approximately 60%.
Table 5.
Summary of Treg reduction model
| Parameter | Value* | Bootstrap median (2.5th, 97.5th)† |
|---|---|---|
| Baseline E0 ‡, % | 12.1 | 12.2 (11.8, 12.6) |
| IIV (%) | 42 | 42 (39, 44) |
| IC50 (mg l–1) | 3.97 | 3.98 (3.34, 4.66) |
| IIV (%) | 65 | 63 (46, 78) |
| Hill coefficient (γ) | 2 | 1.92 (1.39, 2.91) |
| Emax | 0.610 | 0.614 (0.584, 0.654) |
| IIV (%) | 12 | 12 (9, 14) |
| Residual error (proportional), % | 50.1 | 50.2 (48.8, 51.2) |
| Residual error (additive) | 0.416 | 0.420 (0.154, 0.628) |
Summary from 1561 successful runs out of 2000 runs;
Percentage of Tregs (CD4 + CD127low/−/Foxp3+) among all CD4+ T cells;
ETA shrinkages for baseline E0, IC 50 and Emax are 15.6%, 60.5% and 57.7%, respectively. EPS shrinkages for proportional and additive residual errors are both 6.1%
To investigate whether there is a potential delay of effect of daclizumab HYP on Tregs relative to daclizumab HYP serum profile, a delay compartment was tested in the sigmoidal Emax model. However, adding such a delay compartment did not improve the model fit.
A covariance step was not successful for the final model. Therefore, the % relative standard error for the parameters were not presented. Bootstrap results for the sigmoidal Emax model are listed in Table 5. Median and 95% confidence interval for the PD parameters, as well as IIV and residual variability, were consistent with model estimates indicating that the model is stable. VPC stratified by study and subgroups also indicated the good performance of the model (Appendix S7).
Treg reduction following the first s.c. dose of daclizumab HYP 150 mg was simulated. Onset of Treg reduction upon daclizumab HYP treatment is slower than CD25 occupancy. The time to achieve 50% of the maximum effect after administering the 150 mg s.c. regimen for CD25 occupancy and Treg reduction are 1.7 h and 2.6 days, respectively. The onset of Treg reduction and CD25 occupancy is also reflected through IC 50 comparison. The IC 50 of the CD25 occupancy saturation process is 0.0135 mg l–1 while the IC 50 of Treg reduction is higher at 3.97 mg l–1. Maximum Treg reduction of 60% occurs approximately 4 days post‐150 mg s.c. dose (Figure 3A). After treatment discontinuation, Tregs are predicted to return to the baseline levels at approximately week 20 (Figure 3B).
Figure 3.
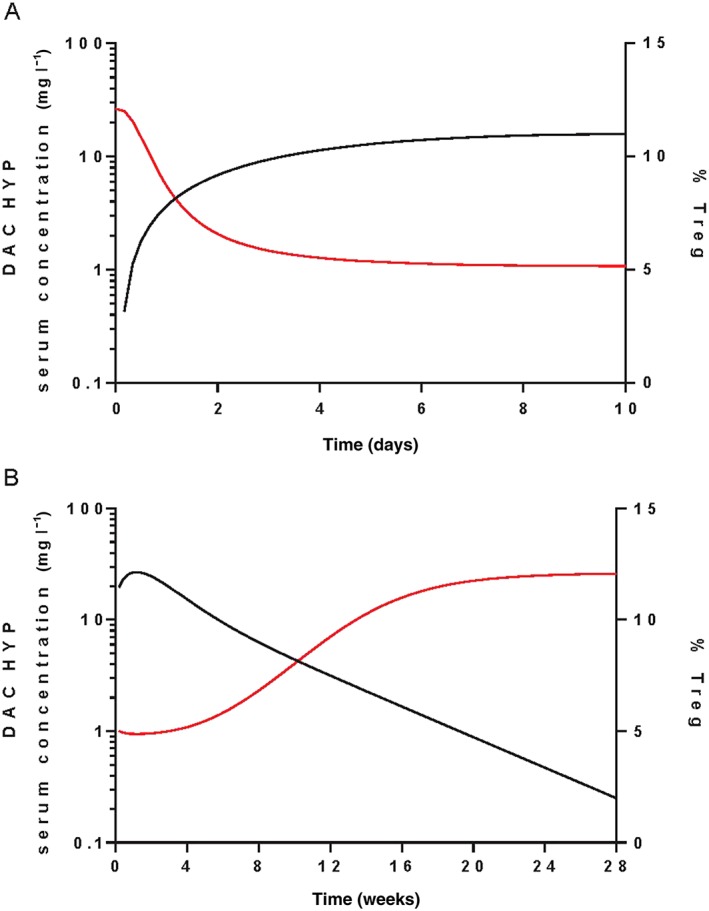
Simulated Treg percent following A) the first daclizumab HYP s.c. 150 mg dose and B) the last daclizumab HYP s.c. 150 mg dose every 4 weeks at steady‐state. ― DAC HYP, ― Treg
Discussion
Daclizumab HYP (Zinbryta™) was approved by the U.S. Food and Drug Administration (FDA) on May 27, 2016 for the treatment of RRMS and is under review with other health authorities. In a phase 3 (DECIDE) study, daclizumab HYP demonstrated superior efficacy to IFN β‐1a across key clinical, radiographic and patient reported MS outcome measures, and has the potential to provide a new treatment option for subjects with RRMS as a once‐monthly s.c. injection 8.
Three PD measurements, i.e. CD25 occupancy on peripheral T cells, CD56bright NK cells and Tregs, were evaluated for subjects with RRMS treated with daclizumab HYP from four clinical studies. Examination of observed data indicated that saturation of CD25 occupancy by daclizumab HYP was rapid with complete saturation achieved within 8 h of dosing (the first sampling time point in OBSERVE intensive subgroup). Significant reductions in Treg and increases in CD56bright NK cells from baseline levels were detected in the first 2 weeks of treatment. The effects of daclizumab HYP were sustained. Treatment with daclizumab HYP maintained the CD25 occupancy saturation, reduced Treg and expanded CD56bright NK cell populations during the treatment period. The effects of daclizumab HYP were reversible. CD25 occupancy, CD56bright NK cell expansion and Treg reduction were reversible to the baselines during a 6 month washout period. After re‐initiation of treatment, the PD effects mirrored the initial treatment phase (as demonstrated by the data in the SELECT/SELECTION studies).
The importance of target engagement with CD25 by daclizumab in treating MS was highlighted in a previous study which evaluated an investigational form of daclizumab (Daclizumab Penzberg, manufactured using a different process and different cell line) in subjects on stable interferon beta therapy for RRMS 16. The effect of daclizumab Penzberg on new gadolinium contrast‐enhancing lesions, the primary endpoint of that study, relative to placebo was robust and statistically significant in the high dose arm 2 mg kg–1 s.c. every 2 weeks, but was marginal and not statistically significant in the low dose arm 1 mg kg–1 s.c. every 4 weeks 16. Population modelling predicted CD25 desaturation in patients whose serum daclizumab concentrations were in the lower fifth percentile for the low dose daclizumab group, but not the high dose daclizumab group.
Using a sigmoidal Emax model, two sets of IC 50 and Hill coefficients were needed to characterize the saturation and desaturation phases of CD25 occupancy and a higher IC 50 was estimated for CD25 desaturation during the daclizumab HYP washout period than during the initial binding. The majority of the subjects had CD25 rapidly occupied upon daclizumab HYP administration. The slope of the saturation part was very steep and the majority of unoccupied CD25 were close to zero at the first sampling point (8 h) in the OBSERVE intensive group. The desaturation during the drug discontinuation was apparently slower. This finding was consistent with a previous analysis of CD25 occupancy by daclizumab HYP in healthy volunteers from phase 1 studies 14. As discussed previously, it is possible that the rapid occupancy of CD25 is driven by CD25 binding in the lymphatic system, where daclizumab HYP concentrations are higher than those in the serum shortly after s.c. administration 14. Saturation of CD25 occupancy was predicted to be maintained when daclizumab HYP serum concentration was more than 5 mg l–1 while the unoccupied CD25 returned to baseline levels when daclizumab HYP serum concentration decreased to approximately less than 1 mg l–1. Unoccupied CD25 return to baseline levels around week 24 after dosing discontinuation. Overall, the kinetics of CD25 saturation and desaturation with the treatment of daclizumab HYP in this analysis including an extensive dataset of monotherapy treatment in MS patients were consistent with previous analyses of CD25 occupancy by daclizumab HYP in healthy volunteers 14.
CD56bright NK cells represent an important immune regulatory population capable of selectively killing autologous, activated T cells 17. The expansion of CD56bright NK cells upon daclizumab HYP treatment is believed to be due to increased IL‐2 bioavailability after CD25 blockade and the high concentration of intermediate affinity IL‐2 receptors expressed on these cells 15. In smaller published studies, higher numbers of the CD56bright NK cells upon treatment were correlated with fewer new or newly enlarging MS lesions 16, 17. In a recent analysis with SELECT/SELECTION data, CD56bright NK cells appeared to mediate some of the treatment‐related effects of daclizumab HYP, but their numbers do not account for the full effect of daclizumab HYP on MS‐related outcomes 10. CD56bright NK cell expansion upon daclizumab HYP treatment was quantitatively characterized using an indirect response model and the drug effect was expressed as a stimulatory Smax function on K in, the zero order rate constant for production of CD56bright NK cells. The expansion of CD56bright NK cells upon daclizumab HYP treatment was slow as indicated by the relatively high EC 50 (18 mg l–1). The time to reach 50% of the maximum CD56bright NK cell expansion following initiation of the 150 mg s.c. every 4 weeks regimen was approximately week 8. Following daclizumab HYP 150 mg s.c. every 4 weeks, the expansion plateaus were reachedapproximately at week 36 and the ratio of expansion at plateau was 5.2.
In addition to being expressed on activated T cells, CD25 is expressed constitutively at high levels on Tregs, which mediate immune tolerance and depend on IL‐2 for homeostasis 18. Treg deficiency, instability, and dysfunction are implicated in the pathogenesis of numerous autoimmune diseases, including RRMS 19. However, reduction of circulating Tregs was observed in subjects with RRMS treated with daclizumab HYP despite its clinical efficacy in subjects with RRMS 20, 21, 22. These seemingly contradictory observations were evaluated for SELECT data and it was found that Treg measurements did not associate with daclizumab HYP treatment response or the development of adverse events of interest such as skin rashes 22. Treg phenotype and lineage stability can be maintained despite CD25 blockade by daclizumab HYP 22. In this analysis, Treg reduction was characterized by a sigmoidal Emax model. A model linking the effect directly without a delay to daclizumab HYP serum concentrations was adequate. The rapid decline in Treg counts (maximum decline in approximately 4 days following 150 mg s.c. dose) as well as their rapid return to the baseline at approximately week 24 when unoccupied target CD25 return to baseline levels suggest that the mechanism of the Treg effect by daclizumab HYP may be an indirect effect related to Treg trafficking, as opposed to direct effects on the development or survival of Tregs.
CD25 occupancy, CD56bright NK cell expansion and Treg reduction represent important pharmacodynamic markers during daclizumab HYP treatment in subjects with MS. Therefore, the quantitative integration and understanding of the PK–PD data is a first essential step to allow future clinical utility of these PD markers. Further investigations of the daclizumab HYP effect on the balance of regulatory and effector immune cells and additional analyses linking the biomarker responses to clinical outcome measures are also warranted 15, 22.
In conclusion, the quantitative PK–PD relationships were characterized for CD25 occupancy on target T cells, CD56bright NK cell expansion, and regulatory T cell reduction by daclizumab HYP in subjects with MS. CD25 occupancy data were characterized by a sigmoidal Emax model. Upon daclizumab HYP 150 mg s.c. treatment, CD25 saturation was rapid with complete saturation occurring approximately 7 h and maintained when daclizumab HYP serum concentration was ≥5 mg l–1. After the last 150 mg s.c. dose at steady‐state, unoccupied CD25 returned to baseline levels in approximately 24 weeks, with daclizumab HYP serum concentrations approximately ≤1 mg l–1. CD56bright NK cell expansion was characterized by an indirect response model. Simulation for a typical subject showed that treatment of daclizumab HYP 150 mg s.c. every 4 weeks resulted in a significant CD56bright NK cell expansion, with the maximum expansion ratio relative to baseline of approximately 5 at week 36. After the last dose at steady‐state, CD56bright NK cells gradually declined to approximately the baseline level within 24 weeks. Daclizumab HYP induced decrease in Tregs was characterized by a sigmoidal Emax model.A maximum reduction of 60% occurred approximately 4 days post‐150 mg s.c. dose. After the last dose at steady‐state, Tregs were projected to return to the baseline levels in approximately 20 weeks.
Competing Interests
All authors contributed to the analysis and interpretation of the data, writing, reviewing and approving the manuscript. HY, IN and DM are employees of and hold equity interest in Biogen. LD, JQT and LA are previous employees of Biogen. AO is an employee and holds equity interest in Abbvie. The study was funded by Biogen (Cambridge, MA, USA) and AbbVie (North Chicago, IL, USA). All authors have completed the Unified Competing Interest form (available on request from the corresponding author) and declare no support from any other organization for the submitted work, no financial relationships with any other organizations that might have an interest in the submitted work in the previous 3 years and no other relationships or activities that could appear to have influenced the submitted work.
We would like to acknowledge Wei Liu and Vineeth Kurnala for dataset preparation, Jacob Elkins for trial management and the physicians and subjects with MS for their participation in the clinical studies.
Supporting information
Appendix S1 Phase 2 Clinical Studies 205M S201 (Select) and 205MS202 (Selection) Trial Design
Appendix S2 Diagnostic plots for the CD25 occupancy model. Black solid line is the unit line; red dashed line represents the linear regression line in (a) and (b) and the LOESS smoother in (c) and (d); DV is observed unoccupied CD25 percent; PRED is the population predicted unoccupied CD25 percent; IPRED is the individual predicted unoccupied CD25 percent; CWRES is conditional weighted residual; TIME is the time after dose and unit is h
Appendix S3 VPC for CD25 occupancy model. (Solid line: median; Dotted line: 10th and 90th percentiles; Black lines: observed; Red lines: simulated; Blue dots: observed.)
Appendix S4 Diagnostic plots for the CD56bright NK cell expansion model. Black solid line is the unit line; red dashed line represents the linear regression line in (a) and (b) and the LOESS smoother in (c) and (d); DV is observed CD56bright NK cell percent; PRED is the population predicted CD56bright NK cell percent; IPRED is the individual predicted CD56bright NK cell percent; CWRES is conditional weighted residual; TIME is the time after dose and unit is h
Appendix S5 VPC for CD56bright NK cell expansion Model. (Solid line: median; Dotted line: 10th and 90th percentiles; Black lines: observed; Red lines: simulated; Blue dots: observed.) A. SELECT/?SELECTION (Upper left: 150 mg no washout; Upper right: 150 mg washout; Lower left: 300 mg no washout; Lower right: 300 mg washout). B. OBSERVE (Left: intensive; Right: Non‐intensive) C. DECIDE
Appendix S6 Diagnostic plots for the Treg reduction model. Black solid line is the unit line; red dashed line represents the linear regression line in (a) and (b) and the LOESS smoother in (c) and (d); DV is observed Treg percent; PRED is the population predicted Treg percent; IPRED is the individual predicted Treg percent; CWRES is conditional weighted residual; TIME is the time after dose and unit is h
Appendix S7 VPC for Treg reduction model. (Solid line: median; Dotted line: 10th and 90th percentiles; Black lines: observed; Red lines: simulated; Blue dots: observed.) A. SELECT/?SELECTION (Upper left: 150 mg no washout; Upper right: 150 mg washout; Lower left: 300 mg no washout; Lower right: 300 mg washout). B. OBSERVE (Left: intensive; Right: Non‐intensive) C. DECIDE
Supporting info item
Diao, L. , Hang, Y. , Othman, A. A. , Mehta, D. , Amaravadi, L. , Nestorov, I. , and Tran, J. Q. (2016) Population PK–PD analyses of CD25 occupancy, CD56bright NK cell expansion, and regulatory T cell reduction by daclizumab HYP in subjects with multiple sclerosis. Br J Clin Pharmacol, 82: 1333–1342. doi: 10.1111/bcp.13051.
References
- 1. Noseworthy JH, Lucchinetti C, Rodriguez M, Weinshenker BG. Multiple sclerosis. N Engl J Med 2000; 343: 938–952. [DOI] [PubMed] [Google Scholar]
- 2. Malek TR. The biology of interleukin‐2. Annu Rev Immunol 2008; 26: 453–479. [DOI] [PubMed] [Google Scholar]
- 3. Waldmann T, Tagaya Y, Bamford R. Interleukin‐2, interleukin‐15, and their receptors. Int Rev Immunol 1998; 16: 205–226. [DOI] [PubMed] [Google Scholar]
- 4. Pfender N, Martin R. Daclizumab (anti‐CD25) in multiple sclerosis. Exp Neurol 2014; 262 Pt A: 44–51. [DOI] [PubMed] [Google Scholar]
- 5. Oh J, Calabresi PA. Emerging injectable therapies for multiple sclerosis. Lancet Neurol 2013; 12: 1115–1126. [DOI] [PubMed] [Google Scholar]
- 6. Vincenti F, Kirkman R, Light S, Bumgardner G, Pescovitz M, Halloran P, et al. Interleukin‐2‐receptor blockade with daclizumab to prevent acute rejection in renal transplantation. Daclizumab Triple Therapy Study Group. N Engl J Med 1998; 338: 161–165. [DOI] [PubMed] [Google Scholar]
- 7. Gold R, Giovannoni G, Selmaj K, Havrdova E, Montalban X, Radue EW, et al. Daclizumab high‐yield process in relapsing–remitting multiple sclerosis (SELECT): a randomised, double‐blind, placebo‐controlled trial. Lancet 2013; 381: 2167–2175. [DOI] [PubMed] [Google Scholar]
- 8. Kappos L, Wiendl H, Selmaj K, Arnold DL, Havrdova E, Boyko A, et al. Daclizumab HYP versus Interferon Beta‐1a in Relapsing Multiple Sclerosis. N Engl J Med 2015; 373: 1418–1428. [DOI] [PubMed] [Google Scholar]
- 9. Mehta D RK, Sheridan J, Elkins J, Amaravadi L. Rapid, sustained and reversible pharmacodynamics of DAC HYP in MS patients supports mechanism of action via modulation of the IL‐2 pathway. In: ACTRIMS‐ECTRIMS, 2014.
- 10. Elkins J, Sheridan J, Amaravadi L, Riester K, Selmaj K, Bielekova B, et al. CD56(bright) natural killer cells and response to daclizumab HYP in relapsing‐remitting MS. Neurol Neuroimmunol Neuroinflamm 2015; 2: e65. [DOI] [PMC free article] [PubMed] [Google Scholar]
- 11. Giovannoni G, Gold R, Selmaj K, Havrdova E, Montalban X, Radue EW, et al. Daclizumab high‐yield process in relapsing–remitting multiple sclerosis (SELECTION): a multicentre, randomised, double‐blind extension trial. Lancet Neurol 2014; 13: 472–481. [DOI] [PubMed] [Google Scholar]
- 12. Othman AA, Tran JQ, Tang MT, Dutta S. Population pharmacokinetics of daclizumab high‐yield process in healthy volunteers: integrated analysis of intravenous and subcutaneous, single‐ and multiple‐dose administration. Clin Pharmacokinet 2014; 53: 907–918. [DOI] [PubMed] [Google Scholar]
- 13. Diao L, Hang Y, Othman AA, Nestorov I, Tran JQ. Population pharmacokinetics of daclizumab high‐yield process in healthy volunteers and subjects with multiple sclerosis: analysis of phase I–III clinical trials. Clin Pharmacokinet 2016; 55: 943–955. [DOI] [PubMed] [Google Scholar]
- 14. Minocha M, Tran JQ, Sheridan JP, Othman AA. Blockade of the high‐affinity interleukin‐2 receptors with daclizumab high‐yield process: pharmacokinetic/pharmacodynamic analysis of single‐ and multiple‐dose phase I trials. Clin Pharmacokinet 2015; 55: 121–130. [DOI] [PubMed] [Google Scholar]
- 15. Martin JF, Perry JS, Jakhete NR, Wang X, Bielekova B. An IL‐2 paradox: blocking CD25 on T cells induces IL‐2‐driven activation of CD56(bright) NK cells. J Immunol 2010; 185: 1311–1320. [DOI] [PMC free article] [PubMed] [Google Scholar]
- 16. Wynn D, Kaufman M, Montalban X, Vollmer T, Simon J, Elkins J, et al. Daclizumab in active relapsing multiple sclerosis (CHOICE study): a phase 2, randomised, double‐blind, placebo‐controlled, add‐on trial with interferon beta. Lancet Neurol 2010; 9: 381–390. [DOI] [PubMed] [Google Scholar]
- 17. Bielekova B, Catalfamo M, Reichert‐Scrivner S, Packer A, Cerna M, Waldmann TA, et al. Regulatory CD56(bright) natural killer cells mediate immunomodulatory effects of IL‐2R alpha‐targeted therapy (daclizumab) in multiple sclerosis. Proc Natl Acad Sci U S A 2006; 103: 5941–5946. [DOI] [PMC free article] [PubMed] [Google Scholar]
- 18. Sakaguchi S. Naturally arising CD4(+) regulatory T cells for immunologic self‐tolerance and negative control of immune responses. Annu Rev Immunol 2004; 22: 531–562. [DOI] [PubMed] [Google Scholar]
- 19. Zozulya AL, Wiendl H. The role of regulatory T cells in multiple sclerosis. Nat Clin Pract Neurol 2008; 4: 384–398. [DOI] [PubMed] [Google Scholar]
- 20. Oh U, Blevins G, Griffith C, Richert N, Maric D, Lee CR, et al. Regulatory T cells are reduced during anti‐CD25 antibody treatment of multiple sclerosis. Arch Neurol 2009; 66: 471–479. [DOI] [PMC free article] [PubMed] [Google Scholar]
- 21. Milo R. The efficacy and safety of daclizumab and its potential role in the treatment of multiple sclerosis. Ther Adv Neurol Disord 2014; 7: 7–21. [DOI] [PMC free article] [PubMed] [Google Scholar]
- 22. Huss DJ, Mehta DS, Sharma A, You X, Riester KA, Sheridan JP, et al. In vivo maintenance of human regulatory T cells during CD25 blockade. J Immunol 2015; 194: 84–92. [DOI] [PubMed] [Google Scholar]
Associated Data
This section collects any data citations, data availability statements, or supplementary materials included in this article.
Supplementary Materials
Appendix S1 Phase 2 Clinical Studies 205M S201 (Select) and 205MS202 (Selection) Trial Design
Appendix S2 Diagnostic plots for the CD25 occupancy model. Black solid line is the unit line; red dashed line represents the linear regression line in (a) and (b) and the LOESS smoother in (c) and (d); DV is observed unoccupied CD25 percent; PRED is the population predicted unoccupied CD25 percent; IPRED is the individual predicted unoccupied CD25 percent; CWRES is conditional weighted residual; TIME is the time after dose and unit is h
Appendix S3 VPC for CD25 occupancy model. (Solid line: median; Dotted line: 10th and 90th percentiles; Black lines: observed; Red lines: simulated; Blue dots: observed.)
Appendix S4 Diagnostic plots for the CD56bright NK cell expansion model. Black solid line is the unit line; red dashed line represents the linear regression line in (a) and (b) and the LOESS smoother in (c) and (d); DV is observed CD56bright NK cell percent; PRED is the population predicted CD56bright NK cell percent; IPRED is the individual predicted CD56bright NK cell percent; CWRES is conditional weighted residual; TIME is the time after dose and unit is h
Appendix S5 VPC for CD56bright NK cell expansion Model. (Solid line: median; Dotted line: 10th and 90th percentiles; Black lines: observed; Red lines: simulated; Blue dots: observed.) A. SELECT/?SELECTION (Upper left: 150 mg no washout; Upper right: 150 mg washout; Lower left: 300 mg no washout; Lower right: 300 mg washout). B. OBSERVE (Left: intensive; Right: Non‐intensive) C. DECIDE
Appendix S6 Diagnostic plots for the Treg reduction model. Black solid line is the unit line; red dashed line represents the linear regression line in (a) and (b) and the LOESS smoother in (c) and (d); DV is observed Treg percent; PRED is the population predicted Treg percent; IPRED is the individual predicted Treg percent; CWRES is conditional weighted residual; TIME is the time after dose and unit is h
Appendix S7 VPC for Treg reduction model. (Solid line: median; Dotted line: 10th and 90th percentiles; Black lines: observed; Red lines: simulated; Blue dots: observed.) A. SELECT/?SELECTION (Upper left: 150 mg no washout; Upper right: 150 mg washout; Lower left: 300 mg no washout; Lower right: 300 mg washout). B. OBSERVE (Left: intensive; Right: Non‐intensive) C. DECIDE
Supporting info item