

ABSTRACT
During sowing of pesticide-treated seeds, pesticide-laden dust and abraded seed particles may be emitted to the environment, possibly leading to environmental contamination and posing health risks. In many countries there is currently no legislation concerning the acceptable amount of dust of treated seeds. This study aimed to gain insight in the abrasion potential of available pesticide-treated seeds and its associated factors. The abrasion potential of 45 seed samples of 7 different species (viz. sugar beet, oat, barley, wheat, spelt, pea, and maize) was determined using the Heubach test and amounts of dust were expressed as g 100 kgseeds −1, g 100,000 seeds−1, and g ha−1. The abrasion potential fell generally within the boundaries of maximum permissible values adopted by different countries. Species, seed treatment company, number of active ingredient (AIs) and combination of AIs had significant effects on the abrasion potential, whereas little or no effect of agitation and conservation was found. However, species were situated differently with respect to each other depending on the unit in which the abrasion potential was expressed. A standard unit that takes into account the species’ seed rate is suggested to give the fairest assessment of dust drift risk and would allow international comparison.
KEYWORDS: Crop protection; seed treatment; seed coating; dust, drift; seed drilling
1. Introduction
Many factors determine the successful establishment of crops and other plants, such as the species, the soil type, the climatic conditions, sowing depth, and the presence or absence of other organisms including weeds, insects, bacteria, or fungi (Scott 1989). Over time, farmers have learned to control some of these factors to a certain extent and agriculture practices have evolved drastically. For example, seeds can be treated to facilitate precision sowing by improving and uniformizing their shape, size and weight, to enhance plant development by direct application of nutrients and regulators or by indirect enhancement of nutrient uptake through beneficial microorganisms, and to reduce stress associated with the soil environment (Taylor & Harman 1990; Kaufman 1991). A very common treatment to reduce biotic stress is the application of fungicides and insecticides onto seeds, thus creating a protective zone of active ingredient (AI) in the soil against soilborne pathogens and insects (Nuyttens et al. 2013).
Pesticide seed treatment has many advantages, including a reduced environmental impact due to the close contact of the pesticide with the target site in treated seeds and smaller doses of AI required compared to field applications (Nuyttens et al. 2013). In addition, the potential exposure to non-target organisms is reduced because the seed is planted into the soil (Alix et al. 2009). However, environmental and health risks are not completely eliminated. Systemic pesticides are translocated to various parts of the plant, such as pollen and nectar, and may induce sublethal effects or mortality to non-target organisms foraging and feeding on those plants (Girolami et al. 2009; Blacquiere et al. 2012; Pettis et al. 2013; Gontijo et al. 2014). Moreover, during the preparation and coating of seeds, and during storage and subsequent handling of the treated seeds, such as transport or sowing, small particles containing AI can be generated due to mechanical stress and changes in environmental conditions. Depending on the type of seed drill used, the pesticide-laden dust that is produced in that way may be emitted to the environment through the outlet fan of the seeder (Biocca et al. 2011). Dust may consequently drift over short or long distances to off-target positions (Forster et al. 2012) and possibly affect non-target organisms (Greatti et al. 2003; Krupke et al. 2012; Pochi et al. 2012; Tapparo et al. 2012 ).
Indeed, pesticide-laden dust emission has been identified as a causative factor of honey bee losses in springtime (Bortolotti et al. 2009; Pistorius et al. 2009). Although this effect is mainly attributed to neonicotinoid insecticide treated seeds, this phenomenon and the environmental risks of seed treatments in general have received increased attention in recent years. In addition, the overall awareness of beneficial ecosystem services provided to agriculture and wild plants by different non-target invertebrates, e.g. pollination, biological pest control and several soil processes (Potts et al. 2010; Pettis et al. 2013; Gontijo et al. 2014; Zimmermann & Stout 2016), has been rising as well. As both airborne dust and pesticides are well known for their adverse effects on the environment (Grantz et al. 2003; Relyea 2005), and human and animal health (Cambra-Lopez et al. 2010; Lee et al. 2011), drift of pesticide-laden dust may pose considerable risks for workers, bystanders and other organisms as well.
As a direct result of the unusually high bee mortalities observed in Europe in the last few years, several (joint) actions have been undertaken by seed breeding companies, the agrochemical and the machine manufacturing industry to improve the seed treatment quality and the seed drilling techniques as those factors largely affect pesticide-laden dust production, emission and drift. Among others, “Good Seed Treatment Practices” have been identified and standard test procedures and quality standards have been implemented (Nikolakis et al. 2009). For example, the abrasion potential of the seed dressing can be determined by the Heubach test. This test, which is internationally accepted as a reference technique, assesses the amount of free floating dust and abraded particles of pesticide-treated seeds in controlled and repeatable conditions by simulating the mechanical stress that seeds experience in practice, such as bagging, transporting and sowing (Nikolakis et al. 2009; ESA STAT Dust Working Group 2011). Moreover, several authorities have adopted maximum permissible Heubach values based on this test (Forster 2009; Giffard & Dupont 2009; Biocca et al. 2011; ESTA 2014). In many countries there is currently no legislation concerning the acceptable amount of dust in batches of treated seeds.
Overall, dust emission during drilling of treated seeds has initiated a new research area. Consequently, there are many gaps in the current knowledge, and guidelines, standards and test procedures might still require improvement or even establishment. The aim of this study was therefore to gain insight in the abrasion potential of available pesticide-treated seeds using the Heubach test, to position the current situation relative to guidelines stated in different countries, and to determine the effect of factors potentially associated with the abrasion potential of treated seeds.
2. Material and methods
2.1. Heubach test
The abrasion potential or Heubach value (HV) of different bags of treated seeds was determined using the Heubach dustmeter according to the internationally accepted protocol described by the European Seed Association (ESA STAT Dust Working Group 2011). An overview of the 45 tested seed samples of 7 different species [viz. 5 sugar beet (Beta vulgaris L. vulgaris), 1 oat (Avena sativa L.), 2 barley (Hordeum vulgare L.), 15 wheat (Triticum aestivum L.), 1 spelt (T. spelta L.), 3 pea (Pisum sativum L.), and 18 maize (Zea mays L.)] is given in Table 1. Most of the samples were obtained from seed treatment companies (dependent samples). In addition, some independent samples were bought from specialized seed shops, farmers or contractors. These seeds might have contained more dust than the dependent samples because of the additional handling and storage. Prior to the Heubach tests, the seeds were placed in non-airtight paper bags and stored in a chamber at 20 ± 2°C and 50 ± 10% relative humidity for at least 48 hours, as required by the protocol. The temperature and relative humidity in the chamber used for tests and storage room were kept within the prescribed limits by electric heaters and a humidifier (AOS U650, Air-O-Swiss, Plaston AG, Widnau, Switzerland) and constantly monitored by a logger (ABI 20-Th logger, Winlog Basic, ebro Electronic, WTW GmbH, Ingolstadt, Germany). From the seed bags (up to 25 kg), working samples of 100 ± 1 g were obtained per seed sample using the spoon method, a soft method suggested by the European Seed Association (ESA) to prepare representative subsamples (ESA STAT Dust Working Group 2011). The weight of the working sample was determined with an analytic balance (Sartorius M-Pact AX224, Sartorius AG, Goettingen, Germany; accuracy: 0.0001 g).
Table 1.
Overview of the tested seed samples. Independent samples are indicated by IS and seed samples with neonicotinoids are shown in italics because of their importance in the dust drift history.
| Species | Seed sample | Company | AI | Species | Seed sample | Company | AI |
|---|---|---|---|---|---|---|---|
| Sugar beet | BVV-1 c | B | clothianidin | Spelt | TS-IS1 | A | fludioxonil |
| BVV-2 c | B | thiamethoxam | Pea | PS-1 | H | cymoxanil + fludioxonil + metalaxyl-M + thiamethoxam | |
| BVV-3 c | B | clothianidin | PS-2 | I | cymoxanil + fludioxonil + metalaxyl-M | ||
| BVV-4 | B | thiamethoxam | PS-3 | H | cymoxanil + fludioxonil + metalaxyl-M | ||
| BVV-5 | C | clothianidin + β-cyfluthrin | Maize | ZM-IS1 | C | methiocarb + fludioxonil + metalaxyl-M + thiram | |
| Oat | AS-1 | A | prothioconazole | ZM-IS2 | E | methiocarb + fludioxonil + metalaxyl-M + thiram | |
| Barley | HV-IS1 | D | clothianidin + prothioconazole | ZM-IS3 | F | methiocarb + fludioxonil + metalaxyl-M + thiram | |
| HV-1 | A | prothioconazole | ZM-IS4 | G | methiocarb + thiram | ||
| Wheat | TA-IS1 | D | prochloraz + triticonazole | ZM-IS5 b | C | methiocarb + fludioxonil + metalaxyl-M + thiram | |
| TA-1 | C | prothioconazole | ZM-IS6 b | E | methiocarb + fludioxonil + metalaxyl-M + thiram | ||
| TA-2 c | D | prochloraz + triticonazole | ZM-IS7 b | F | methiocarb + fludioxonil + metalaxyl-M + thiram | ||
| TA-3 c | D | prochloraz + triticonazole | ZM-IS8 b | G | methiocarb + thiram | ||
| TA-4 | D | silthiofam | ZM-1 | C | methiocarb + fludioxonil + metalaxyl-M | ||
| TA-5 | D | clothianidin + prothioconazole | ZM-2 | D | methiocarb | ||
| TA-6 | D | fludioxonil | ZM-3 | D | methiocarb + fludioxonil + metalaxyl-M + thiram | ||
| TA-7 a | A | prothioconazole | ZM-4 c | C | methiocarb + fludioxonil + metalaxyl-M + thiram | ||
| TA-8 c | A | fludioxonil + tefluthrin | ZM-5 c | C | clothianidin + fludioxonil + metalaxyl-M + thiram | ||
| TA-9 | A | prothioconazole | ZM-6 c | C | fludioxonil + metalaxyl-M + thiram | ||
| TA-10 | A | prothioconazole + silthiofam | ZM-7 c | C | fludioxonil + metalaxyl-M + thiram | ||
| TA-11 | A | clothianidin + prothioconazole | ZM-8 | G | methiocarb + thiram | ||
| TA-12 | A | prothioconazole | ZM-9 | A | methiocarb + thiram | ||
| TA-13 | E | prothioconazole | ZM-10 | G | methiocarb + thiram | ||
| TA-14 | A | prochloraz + triticonazole |
aRecoated seed sample.
bAgitated sample of seed bag driven around on top of a pneumatic drilling machine during one seed drilling day.
cSample retested after 467 ± 90 days of conservation.
In accordance with the standard protocol (ESA STAT Dust Working Group 2011), the working sample was then placed in the rotating drum of a Heubach dustmeter (Type 1, Heubach GmbH, Langelsheim, Germany, http://www.heubachcolor.de/fileadmin/documents/downloads/Brochures/Dustmeter.pdf) set at a 30 rpm rotation speed. Inside the rotating drum the treated seeds were mechanically stressed for 120 s. A continuous air flow of 20 L min−1 running through the Heubach dustmeter, provided by a vacuum pump, transported the abraded dust particles out of the rotating drum and through a connected glass cylinder and attached filter unit. The coarse non-floating particles were collected in the glass cylinder while the floating dust particles were deposited on a glass fibre filter-disc (ALBET Labscience, GF 9 050, Hahnemühle FineArt GmbH, Dassel/Relliehausen, Germany) mounted inside the filter unit. Before and after every loading cycle the filter unit including the filter disc was weighed using the analytic balance. Per seed sample at least three successful repetitions were performed. Between every test, all parts were thoroughly cleaned using a vacuum cleaner designed to handle toxic compounds (Kärcher NT 35/1 Eco H, Alfred Kärcher GmbH & Co. KG, Winnenden, Germany). After each test day, the rotating drum and glass cylinder were cleaned with water and soap, rinsed with demineralized water and allowed to dry.
2.2. Heubach value calculations
Per repetition, the abrasion potential, expressed as grams of dust per 100 kg of treated seeds (g 100 kgseeds −1) and grams of dust per 100,000 treated seeds (g 100,000 seeds−1), was calculated as
| (1) |
or
| (2) |
where  is the Heubach value,
  is the weight of the loaded filter unit including filter disc (g),
  is the weight of the unloaded filter unit including filter disc (g),
  is the weight of the working sample of treated seeds (g), and TGW is the thousand grain weight (g 1,000 seeds–1), determined per seed sample by weighing 3 times 100 seeds and extrapolating the mean weight to 1,000 seeds.
Finally, the Heubach values of the seed samples were determined by calculating the mean value of the repetitions.
In addition to the classic calculations described above, the Heubach values were also expressed as grams of dust per hectare of sown field (g ha−1):
| (3) |
and/or
| (4) |
where Mean SR is the mean seed rate determined based on values found in literature and drilling machine user manuals (Table 2).
Table 2.
Seed rate values found in literature and drilling machine user manuals, and calculation of the mean seed rate, expressed in kg ha−1 and seeds ha−1.
| Species | Reference | Seed rate (kg ha−1) | Mean Seed rate (kg ha−1) | SD Seed rate (kg ha−1) | Reference | Seed rate (seeds ha−1) | Mean Seed rate (seeds ha−1) | SD Seed rate (seeds ha−1) |
|---|---|---|---|---|---|---|---|---|
| Sugar beet | Cattanach et al. (2015) | 1 | 1.5 | 0.71 | Heimbach (2011) | 100,000 | 100,000 | – |
| 2 | ||||||||
| Oat | User manual a | 160 | 160 | – | ||||
| Barley | User manual a | 150 | 165 | 21 | ||||
| Heimbach (2011) | 180 | |||||||
| Wheat | User manual a | 200 | 225 | 35 | ||||
| Heimbach (2011) | 250 | |||||||
| Spelt | 225 c | 35 | ||||||
| Pea | J. Hanssens, pers. comm. | 900,000 | 900,000 | – | ||||
| Maize | User manual b | 22 | 22 | – | Friessleben et al. (2010) | 80,000 | 75,000 | 2,608 |
| Balsari et al. (2013) | 75,000 | |||||||
| Biocca et al. (2011) | 75,000 | |||||||
| Herbst et al. (2010) | 73,000 | |||||||
| Marzaro et al. (2011) | 73,000–74,000 |
aUser manual Amazon D9 3000 Special
bUser manual Kuhn Venta nc 3000
cNo reference found; therefore, the same mean seed rate as for wheat was used.
The variation in TGW determined in this study and the seed rates found in the literature and user manuals were taken into account by computing a propagation of uncertainty on the standard deviations of the Heubach values expressed as g 100,000 seeds−1 and g ha−1.
2.3. Conversion of international Heubach value standards
As mentioned in the introduction, several authorities have adopted maximum permissible Heubach values for pesticide-treated seeds. An overview of those values for the tested species is given in Table 3. The maximum permissible values ( are currently expressed as either g 100 kgseeds
−1 or g 100,000 seeds−1. By using the mean TGW per species, those
are currently expressed as either g 100 kgseeds
−1 or g 100,000 seeds−1. By using the mean TGW per species, those  were also converted to the other HV unit. Subsequently, the conversion to g ha−1 was based on the species mean seed rates, determined as described above.
Table 3.
Overview of maximum permissible and converted Heubach values for pesticide-treated seeds of species tested in this study in several countries. In bold, the maximum permissible values expressed in the HV unit in which they are or will be adopted.
 |
Mean TGW
a
|
Mean SR
b
|
 |
|||||
|---|---|---|---|---|---|---|---|---|
| Species | Country | Reference | (g 100 kgseeds−1) | (g 100,000 seeds−1) | (g 1,000 seeds−1) | (seeds ha−1) | (kg ha−1) | (g ha−1) |
| Sugar beet | ESA Member States | ESTA (2014) | 9.8 | 0.25 | 25.6 ± 2.51 | 100,000 | 1.5 ± 0.71 | 0.20 ± 0.12 |
| Oat | ESA Member States | ESTA (2014) | 4.0 c | 0.16 | 40.8 ± 0.98 | 160 | 6.4 | |
| Barley | ESA Member States | ESTA (2014) | 4.0 c | 0.22 | 54.2 ± 3.15 | 165 ± 21 | 6.6 ± 0.9 | |
| Wheat | ESA Member States | ESTA (2014) | 4.0 c | 0.20 | 49.9 ± 6.08 | 225 ± 35 | 9.0 ± 1.8 | |
| Spelt | ESA Member States | ESTA (2014) | 4.0 c | 0.27 | 68.2 ± 5.92 | 225 ± 35 | 9.0 ± 1.6 | |
| Pea | ESA Member States | ESTA (2014) | 0.5 | 0.10 c | 185.9 ± 23.14 | 900,000 | 0.90 | |
| Maize | ESA Member States | ESTA (2014) | 2.6 | 0.75 | 286 ± 40.8 | 75,000 ± 2,608 | 22 | 0.57 ± 0.08 |
| Germany | Forster (2009) | 2.6 | 0.75 | 0.57 ± 0.08 | ||||
| Italy | Biocca et al. (2011) | 3.0 | 0.86 | 0.65 ± 0.1 | ||||
| France | Giffard and Dupont (2009) | 4.0 | 1.1 | 0.87 ± 0.13 | ||||
aMean thousand grain weight.
bMean seed rate.
cMaximum permissible value that will be implemented in July 2016 by ESTA.
As before, propagations of uncertainty on the standard deviations of  (g ha−1) were conducted by taking into account the variation in TGW determined in this study and the seed rates found in literature and user manuals.
For example, for a mean TGW of sugar beet of 25.6 ± 2.51 g 1,000 seeds−1, a HV of 0.25 g 100,000 seeds−1 equals 9.8 g 100 kgseeds −1. At mean seed rates of 100,000 seeds ha−1 and 1.5 ± 0.71 kg ha−1 this results in a converted maximum permissible Heubach value of 0.20 ± 0.12 g ha−1.
2.4. Experiment 1: effect of agitation, species, seed sample, seed treatment company, AI, and TGW
The abrasion potential determined using the Heubach test was used to evaluate the effect of agitation, species, seed sample, seed treatment company, (in)dependency of the seed samples, number of AIs applied to the seeds, combination of AIs, and TGW. One bag of wheat was recoated before bringing it to the market again (Table 1). Four maize seed bags, produced by four different seed treatment companies and coated with comparable seed treatments, were bought in duplex from the same contractor. To investigate the effect of agitation, one bag of each duplicate was left unharmed (ZM-IS1 to 4) while the other bag was put on top of a pneumatic drilling machine and driven around during one seed drilling day (ZM-IS5 to 8) before being subjected to the Heubach test. During the maize planting season, this is a method often used by contractors to transport seeds between different fields.
Prior to statistical analyses, data were checked for normality using the Shapiro-Wilk test and by visual assessment of the P–P plots using Statistica 11 (StatSoft Inc., Tulsa, OK, USA). This was done for the duplicate maize sample data, the whole dataset and the dataset per species separately because the dataset that was used in further statistical analysis depended on the tested effect. No transformation was required for the duplicate maize samples, whereas square root transformations of the three Heubach values [sqrtHV(g 100 kgseeds −1), sqrtHV(g 100,000 seeds−1), sqrtHV(g ha−1)] were used to obtain normal distributions of the whole dataset.
First, to determine the effect of agitation, t-tests were performed on the three HV's for the duplicate maize samples. In addition, one-way ANOVA's with seed sample and Tukey post-hoc tests were performed on this reduced dataset. As no significant effects of agitation were found, the agitated samples were included in further analysis. Second, differences in species and seed samples were determined for the three sqrtHV's using ANOVA's with species and seed sample nested within species as independent variables. If significant, Tukey post-hoc tests were performed. Third, a general linear multivariable model with species and seed treatment company, (in)dependency of the seed samples, number of AIs applied to the seeds, and combination of AIs nested within species was fitted for sqrtHV(g ha−1). Again, Tukey post-hoc tests were performed when significant. Finally, separate analyses were performed to determine the effect of TGW on sqrtHV(g ha−1) because including the continuous variable and its interaction with species in the general linear model prevented estimation of the intercept. This was done by performing a one-way ANOVA per species for wheat and maize. For sugar beet, oat, barley, spelt and pea no effect was tested due to too little data. When significant, additional regression and correlation analyses were done. The fit of both models was assessed by examination of the normal probability plots of the residuals.
2.5. Experiment 2: effect of conservation
To investigate the effect of conservation, an additional experiment was conducted in which the abrasion potential of 10 samples from experiment 1, i.e. 3 sugar beet, 3 wheat, and 4 maize (Table 1), was redetermined after 467 ± 90 days of conservation using the Heubach test as described above. Only HV(g ha−1) was calculated and used in this experiment. To obtain normality, a natural logarithmic transformation was used. A general linear model with species, seed sample nested within species, conservation and the interaction between seed sample and conservation was fitted for lnHV(g ha−1). When significant, Tukey post-hoc tests were performed. To assess the fit of the model the normal probability plot of the residuals was studied.
3. Results and discussion
3.1. Experiment 1
3.1.1. Effect of agitation
The t-tests showed no effect of agitation on the abrasion potential of the duplicate maize samples [P = 0.81, 0.75, 0.69 for HV(g 100 kgseeds −1), HV(g 100,000 seeds−1), and HV(g ha−1), respectively]. This was supported by the one-way ANOVA's and Tukey post-hoc tests which revealed significant effects of seed sample but not between duplicates, i.e. agitated vs. non-agitated sample of the seed bags bought in duplex (data not shown). The results thus suggest that repeated vibration of seed bags situated on top of the drilling machine during seed drilling would probably not cause higher Heubach values. It should furthermore be noted that the Heubach values only consider the (very) fine dust fraction. Albeit the exact size of the fine dust particles collected with the Heubach test is unknown, it is undoubtedly very small compared to the size range of total driftable dust in field conditions due to the very low air velocities in the glass cylinder (± 0.04 m s−1) at the prescribed air flow rate (Nuyttens et al. 2013). A substantial amount of coarser dust is often deposited in the glass cylinder. According to Biocca et al. (2011) the coarse dust fraction deposited in the glass cylinder of the Heubach dustmeter could be 5.3 to 12.6 times higher than the fine fraction collected by the filter. The Heubach test thus underestimates the total dust load or the abrasion potential of seed samples and agitation might possibly cause mainly coarser abraded particles which are not measured by the Heubach test. Future studies should include the coarse and fine dust fraction as well as more species and samples to verify the effect of agitation on the abrasion potential of seeds. Nevertheless, because no correction factors can be estimated, the term “abrasion potential” is hereafter used to indicate the amount of fine dust collected by the filter unit with the Heubach test.
3.1.2. Effect of species
Descriptive statistics of the abrasion potential, expressed as g 100 kgseeds −1, g 100,000 seeds−1, and g ha−1, for the different species are presented in Table 4. Spelt had the highest mean Heubach values over all HV units, although not always significantly higher than oat or maize, whereas sugar beet had generally the lowest values. Oat always produced more dust than wheat, and wheat more than barley. Pea had low or intermediate Heubach values depending on the HV unit. The results support the findings of Heimbach et al. (2011) who found generally comparable results for HV(g ha−1) with best resistance to abrasion in sugar beet, followed by maize and cereals.
Table 4.
Descriptive statistics of the abrasion potential, expressed as g 100 kgseeds −1, g 100,000 seeds−1, and g ha−1, and TGW (in g 1,000 seeds−1) for the different species.
| Sugar beet (n = 5) | Oat (n = 1) | Barley (n = 2) | Wheat (n = 15) | Spelt (n = 1) | Pea (n = 3) | Maize (n = 18) | ||
|---|---|---|---|---|---|---|---|---|
| HV (g 100 kgseeds−1) | Mean | 0.52d | 2.80a | 1.55b | 1.95b | 4.07a | 0.39d | 0.83c |
| SD | 0.34 | 0.26 | 0.40 | 0.88 | 0.51 | 0.36 | 0.56 | |
| CV (%) | 64.98 | 9.45 | 26.03 | 44.91 | 12.61 | 93.25 | 67.67 | |
| Min. | 0.00 | 2.50 | 1.10 | 0.50 | 3.50 | 0.00 | 0.00 | |
| Max. | 1.10 | 3.00 | 2.10 | 4.00 | 4.50 | 1.10 | 2.00 | |
| HV (g 100,000 seeds−1) | Mean | 0.01c | 0.11ab | 0.09b | 0.10b | 0.28a | 0.07b | 0.23a |
| SD | 0.01 | 0.01 | 0.03 | 0.05 | 0.04 | 0.06 | 0.15 | |
| CV (%) | 67.58 | 9.72 | 31.75 | 48.49 | 15.32 | 85.79 | 64.75 | |
| Min. | 0.00 | 0.10 | 0.06 | 0.03 | 0.24 | 0.00 | 0.00 | |
| Max. | 0.03 | 0.12 | 0.12 | 0.22 | 0.31 | 0.17 | 0.54 | |
| HV (g ha−1) | Mean | 0.01f | 4.48b | 2.56c | 4.39b | 9.15a | 0.60d | 0.18a |
| SD | 0.01 | 0.42 | 0.92 | 2.98 | 1.99 | 0.72 | 0.23 | |
| CV (%) | 136.61 | 9.45 | 35.81 | 67.76 | 21.73 | 120.58 | 131.73 | |
| Min. | 0.00 | 4.00 | 1.81 | 1.12 | 7.88 | 0.00 | 0.00 | |
| Max. | 0.03 | 4.80 | 3.46 | 9.00 | 10.13 | 1.54 | 0.44 | |
| TGW (g 1,000 seeds−1) | Mean | 25.55 | 40.77 | 54.24 | 49.88 | 68.21 | 185.93 | 286.01 |
| SD | 2.51 | 0.98 | 3.15 | 6.08 | 5.92 | 23.14 | 40.88 | |
| CV (%) | 9.84 | 2.41 | 5.81 | 12.19 | 8.68 | 12.44 | 14.29 | |
| Min. | 21.83 | 40.19 | 50.91 | 34.85 | 63.79 | 149.68 | 217.13 | |
| Max. | 28.59 | 41.90 | 57.89 | 57.86 | 74.94 | 206.51 | 358.58 |
Note: Means in the same row with different superscripts differ significantly (P < 0.05, Tukey post-hoc test).
The variation in abrasion potential between species is most likely determined by a combination of factors, such as the coating process and seed characteristics. Depending on the size, structure and commercial value of the seeds, different seed treatment techniques are used (Pistorius et al. 2009). Cereals are generally treated with a dry powder coating, whereas maize and pea seeds receive a slurry or liquid treatment and sugar beets are pelleted. Dry powder formulations adhere less to the seed surface and tend to loosen and drift more easily (EFSA 2012), consistent with the large HV found for cereals. Furthermore, the extent of seed cleaning before, during and after the coating process also affects dust values. For example, the presence of dust particles before treatment hampers the adherence of coating onto the seeds (EFSA 2012). Glume particles may also affect the coating quality (Pistorius et al. 2009). In this study, seed cleaning after the coating process was only reported for sugar beet pills, possibly contributing to the very low Heubach values of this species besides the pelleting itself. With regards to the very low dust values of sugar beet pills, Heubach measurements of certain seeds might certainly benefit from the use of more accurate balances with 5-decimal scales as recommended by ESA (ESA STAT Dust Working Group 2011).
Variation in HV(g ha−1) between different studies may be due to differences in seed rates used to calculate the Heubach values. For wheat, Heimbach et al. (2011) reported considerably lower mean Heubach values than this study (2.84 g ha−1 at a seeding rate of 250 kg ha−1 vs. 4.39 g ha−1 at a seeding rate of 225 kg ha−1). The higher values in this study might be explained by differences in the seed coating process. For example, powder coating of cereal seeds is still more common in certain countries compared to Germany.
Importantly, species were situated differently with respect to each other depending on the HV unit. For example, per 100 kg of seeds, spelt and oat produced considerably more dust than the other species, including maize. In contrast, the dust production of 100,000 maize seeds exceeded that of oat due to the large size and weight difference of the seeds, as indicated by the TGW given in Table 4. These differences denote the relevance of a standard unit for comparison. Both HV(g 100 kgseeds −1) and HV(g 100,000 seeds−1) give little information about the actual dust production of the seed samples when applied to the field because some species weigh more or are applied in larger numbers than others. Taking into account the species’ seed rate, as done by expressing HV as g ha−1, therefore gives a fairer assessment of the dust drift risk and eventually allows to assess the sowing-related risk for human health and the impact on the environment. This of course only holds if the captured fine fraction in the Heubach test is representative of the true drift potential that may include larger particles than those measured.
In addition, EFSA (2012) already suggested to recalculate the Heubach values as “dust AI ha−1” but in time a full risk assessment could be performed as suggested by Forster et al. (2012). In order to do so, among other factors the amount of AI in dust, the toxicity of the AI, and the drift potential of the dust particles should be determined per crop species and application technique in future studies in addition to the total amount of dust. The physicochemical properties of the dust should therefore be characterized as well.
3.1.3. Effect of seed sample
Figure 1–3 present the mean Heubach values of the different seed samples for HV(g 100 kgseeds −1), HV(g 100,000 seeds−1), and HV(g ha−1), respectively, with indication of the corresponding maximum permissible Heubach values.
Figure 1.
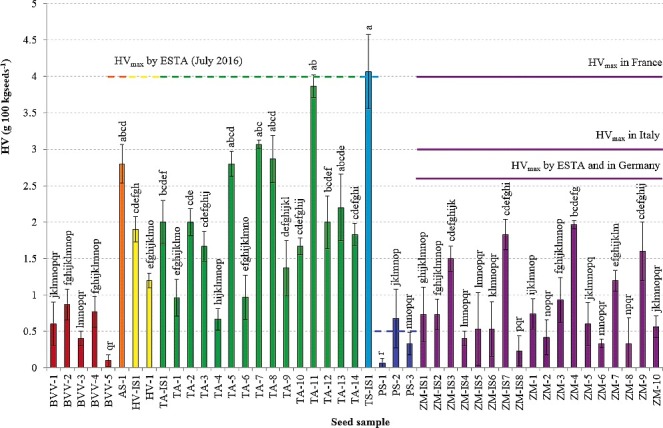
Heubach values (mean ± SD), expressed as g 100 kgseeds −1, of the different seed samples, with indication of the maximum permissible Heubach values (_____ adopted, ----- to be implemented by ESA Member States in July 2016). Different superscripts denote statistical significance at P < 0.05.
Figure 3.
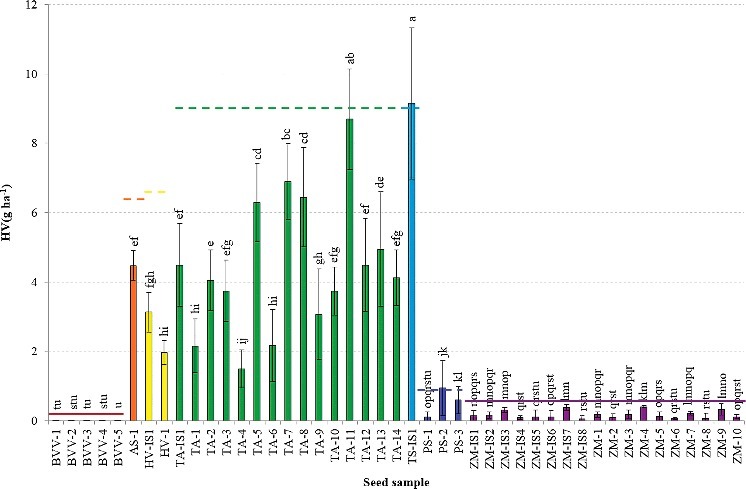
Heubach values (mean ± SD), expressed as g ha−1, of the different seed samples, with indication of the maximum permissible Heubach values by ESTA (_____ adopted, ----- to be implemented by ESA Member States in July 2016). Different superscripts denote statistical significance at P < 0.05.
In accordance with the results from Table 4, the highest HV expressed in g 100 kgseeds −1 were generally found for the cereals, i.e. spelt, wheat, oat and barley, although variation within species was large. Due to some outliers, the maize samples resulted in rather intermediate dust production, while sugar beet and pea had intermediate to very low dust production. The Heubach values of the maize seed samples expressed as g 100,000 seeds−1 (Figure 2) were often higher than those of the cereal samples, in contrast to the values expressed as g 100 kgseeds −1 (Figure 1). Cereals and pea had intermediate Heubach values and the dust abrasion of the sugar beet samples was very low. Again, considerable variation occurred within species. The amount of dust potentially generated by dressed seeds during sowing of one hectare (Figure 3) displayed three distinct groups of seeds, i.e. cereals with high to intermediate dust production, maize and pea with intermediate to low dust production, and beet with very low dust production.
Figure 2.
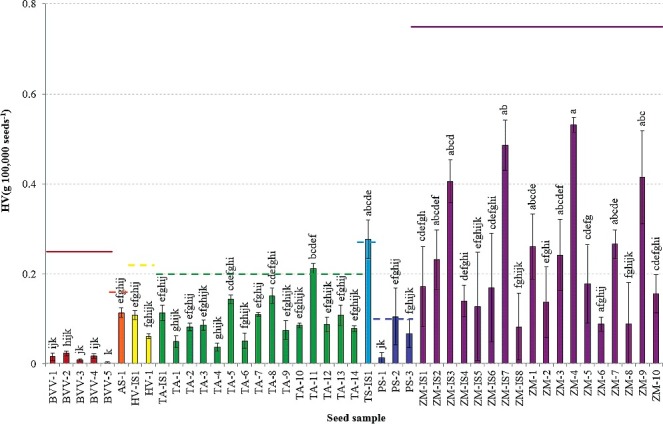
Heubach values (mean ± SD), expressed as g 100,000 seeds−1, of the different seed samples, with indication of the maximum permissible Heubach values by ESTA (_____ adopted, ----- to be implemented by ESA Member States in July 2016). Different superscripts denote statistical significance at P < 0.05.
Currently, maximum permissible values are mainly reported for maize, sugar beet, sunflower and oil seed rape in HV(g 100 kgseeds −1) and HV(g 100,000 seeds−1), whereas no international guidelines exist for HV(g ha−1), although, as discussed above, all HV units can be converted to the other units. Based on the crop specific maximum permissible Heubach values expressed as either HV unit, no sugar beet or maize samples would be excluded from the market (Figures 1–3). The implementation of the maximum permissible values for pea and cereals in July 2016 would however ban two seed samples (PS-2 and TS-IS1) when HV(g 100 kgseeds −1) or HV(g ha−1) are considered, while three samples (PS-2, TS-IS1 and TA-11) would be excluded from the market when HV(g 100,000 seeds−1) is considered.
Given the variation in maximum permissible Heubach values between species and countries, and the free movement of treated seeds in Europe, the amount of dust and AI potentially drifting to adjacent non-target areas during sowing of a specific field may differ depending on the application. The threshold for environmental impact is thus allowed to vary from country to country, which is rather peculiar. Harmonization between different countries is more logical. In addition, seed rates may differ between regions and even locally depending on the local conditions and drilling equipment. Regarding risk assessment it seems interesting to list the maximum European sowing rates per hectare in order to determine a worst case scenario per crop. The European Commission already suggests in their Draft Guidance Document on Authorisation of Plant Protection Products for Seed Treatment that experimental data for the exposure assessment of specific products should be generated according to the worst case seed density in the EU (European Commission 2014). In respect of the free movement of treated seeds in Europe, future studies would gain from expanding their focus to pesticide-treated seeds on a European or even global level.
3.1.4. Effect of recoating
Based on the results from two wheat samples from the same company, coated (TA-9) and recoated (TA-7) with the same AI (prothioconazole), we suggest that the use of recoated samples should be discouraged. Recoatings might be more prone to abrasion because of less solid adhesions between two layers of coating polymer than between seed skin and polymer. The recoated sample (TA-7) led to a dust production per hectare of a factor 2.2 higher compared to the non-recoated sample (TA-9). The higher dust production might, however, also be partly explained by the difference in wheat variety and TGW.
Furthermore, recent information from Bayer CropScience suggests that adding an extra film coating without AI on the treated seeds could be a good dust mitigation strategy as well (Pers. Comm.). Further experiments are therefore needed to accurately advise good seed treatment practices.
3.1.5. Effect of seed treatment company and AI
The seed treatment company (P < 0.001), the (in)dependency of the seed samples (P < 0.001), the number of AIs (P < 0.01), and the combination of AIs (P < 0.001) had a significant effect on HV(g ha−1). This supports the common belief that besides the species, seed treatment and handling also have a large effect on the abrasion of dust particles. Nikolakis et al. (2009) outlined various factors that may influence the quality of the seed coating such as quality of the seeds (cleanliness of the seeds before treatment), formulation (particle size of the solids, presence of “stickers”), seed treatment machinery, and application recipe (combination of AIs, application rate of AIs). The European Seed Association also recommends cleaning the seeds after coating to produce seeds with low dust values [ESA (http://esta.azurewebsites.net/Standard/Dust)]. All these factors may be reflected in the overall significant effect of the seed treatment company.
In this study, some factors of the application recipe were investigated, i.e. the number of AIs and the combination of AIs, although trends were not always clear due to the effect of seed treatment company, which could not be accounted for in these statistical analyses. With regard to the number of AIs in the seed coating, the amount of dust significantly increased in wheat from 1 AI to 2 AIs, whereas no significant effect was found in sugar beet and barley. In maize, a significant increase was found from 2 to 3 AIs, while in pea the amount of dust significantly decreased from 3 to 4 AIs (data not shown). More seed samples should be analysed to elucidate the effect of number of AIs. The significant increase of HV with the number of AIs observed for some species suggests a possibly poorer abrasion resistance due to less solid adhesion between 2 layers of coating polymer, as mentioned above.
In addition to the number of AIs, the combination of AIs also affected the abrasion potential (P < 0.001). Figure 4 shows the mean HV(g ha−1) of the AI combinations in the various species. The sugar beet samples coated with thiamethoxam had slightly larger Heubach values than those coated with clothianidin from the same seed treatment company. Adding β-cyfluthrin to the clothianidin coated sugar beet pills decreased the fine dust production although no significant differences were found. However, this sample came from a different company what may also have caused the lower Heubach values.
Figure 4.
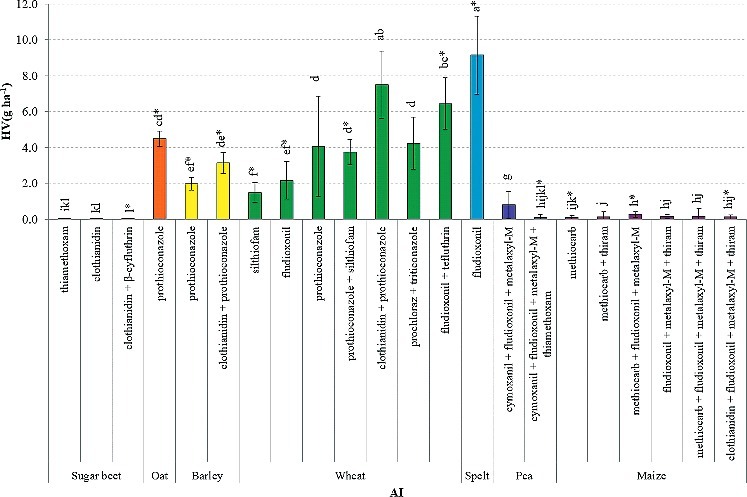
Heubach values (mean ± SD), expressed as g ha−1, of the different AI combinations. Different superscripts denote statistical significance at P < 0.05. Bars with an asterisk comprise of only one seed sample.
In pea, the addition of thiamethoxam to a coating with cymoxanil+fludioxonil+metalaxyl-M significantly decreased the Heubach values, probably because insecticides are often coated with an additional sticker (Nikolakis et al. 2009). This might explain the reduction in fine dust production of those samples. However, the addition of clothianidin to prothioconazole treated seeds significantly increased the Heubach values in wheat. In barley, this effect was not significant but still substantial. In both cases the effect of stickers might have been obscured by other factors relating to seed treatment.
Not surprisingly, the results within AI combinations correlated with the effect of species. For example, the mean Heubach values of the prothioconazole treated oat and wheat seeds did not differ, whereas they significantly differed from the barley treated seeds, in accordance with the mean Heubach values of those species. Similar, the fludioxonil treated wheat seeds and the clothianidin+prothioconazole treated barley seeds had lower dust production compared to spelt and wheat, respectively.
Besides seed treatment, seed handling might also affect the dust production. Although a significant effect of the (in)dependency of the seed samples was found (P < 0.001), the dependent and independent samples did not significantly differ within species, suggesting that in this case the potential additional handling of the seed samples did not cause more fine dust particles. However, it might have influenced the coarse dust fraction which was not determined in this study.
3.1.6. Effect of TGW
The means, standard deviations, coefficients of variation, and ranges of TGW determined for the different species are presented in Table 4. The one-way ANOVA's indicated that TGW significantly affected sqrtHV(g ha−1) in wheat (P = 0.044) and maize (P = 0.002). Despite these significant effects, the regression analyses showed very poor associations between TGW and sqrtHV(g ha−1) (adjusted R 2 = 0.065 and 0.068, respectively). The low coefficients of determination indicate that TGW is certainly not the only factor associated with the abrasion potential, supported by the significant effects of seed treatment company, (in)dependency of the seed samples, number of AIs, and combination of AIs found above. Weak negative correlations were found (r = –0.29 and –0.29). In general, the results thus suggest a weak influence of TGW on the abrasion potential in wheat and maize with decreasing abrasion with increasing weight. This negative correlation may be due to heavier seeds being larger and having smaller surface-to-volume ratios and thus a smaller surface area that may abrade.
3.2. Experiment 2: effect of conservation
Linear regression showed that the interaction between seed sample and conservation (P < 0.001) significantly influenced lnHV(g ha−1). Figure 5 presents the mean Heubach values of the 10 seed samples tested in experiment 1 and retested after 467 ± 90 days of conservation. Unlike expected, conservation did not cause an increased amount of fine dust. The abrasion potential decreased significantly after conservation in the tested sugar beet samples, while in wheat and maize no effect of conservation occurred. The lack of positive effects on the abrasion potential might be due to the very stable climatic conditions of conservation which are less common in field situations. A possible explanation for the reduction in amount of dust abraded from the sugar beet samples is that during conservation the pelleted seeds become harder, leading to a higher resistance to abrasion when subjected to the Heubach test. This would suggest that conserving pelleted seeds for longer time before sowing or even adding an additional hardening step to the seed treatment might result in an even lower environmental impact. This, however, might have an effect on the germination success of these seeds as well. More tests are needed to confirm these findings.
Figure 5.
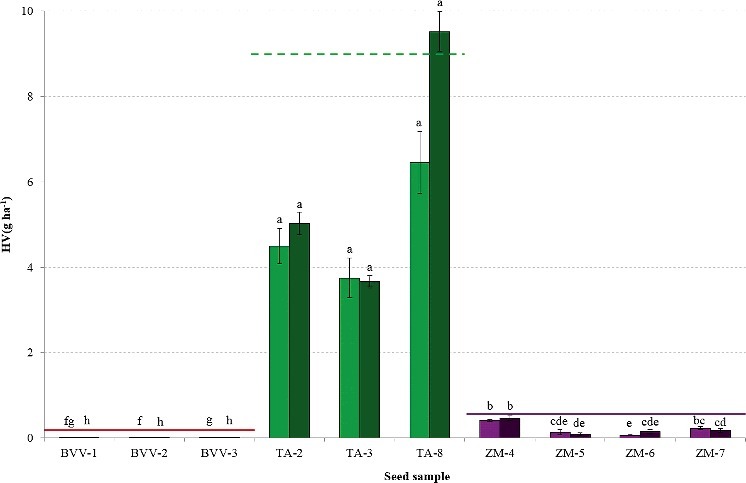
Heubach values (mean ± SD), expressed as g ha−1, of the seed samples tested at the start of the experiment (light) and retested after 467 ± 90 days of conservation (dark), with indication of the maximum permissible Heubach values by ESTA (_____ adopted, ----- to be implemented by ESA Member States in July 2016). Different superscripts denote statistical significance at P < 0.05.
4. Conclusions
This study gave insight into the abrasion potential of available treated seeds and demonstrates that in general they fall well within the boundaries of maximum permissible values adopted by different countries. However, we suggest that a standard unit that takes into account the species’ seed rate should be used internationally to compare between samples and species. Further, this study confirms that the species and the coating process (seed treatment company, application recipe) have a large effect on the abrasion potential, whereas little or no effect of agitation or conservation was found. The Heubach test however only considers the fine dust fraction. Although, this fraction is more prone to drift and its AI rates can be significantly higher compared to the coarse fraction, the latter should certainly not be ignored. To assess the overall risk and to determine the drift potential, the physicochemical properties of the total dust fraction should be characterized. As proven by Devarrewaere et al. (2015), the settling velocity of dust drift particles is strongly affected by their size, shape and density. In addition, the chemical content of dust particles was shown to vary with size classes (Pistorius et al. 2009; Foqué et al. 2014). Future studies should focus on developing and validating methods that capture the total dust fraction and resemble field conditions. An individual sowing element equipped with a cyclone which collects all abraded dust might simulate realistic sowing conditions best and such a set-up could be used under controlled conditions.
Acknowledgements
The authors gratefully acknowledge the members of the user comity and Jonas Hanssens, Brecht De Cock, Donald Dekeyser and Bert Beck for their input and support.
Funding Statement
This work was supported by the Flemish Government (IWT Vlaanderen) [grant number IWT-LA 100848].
Disclosure statement
No potential conflict of interest was reported by the authors.
References
- Alix A. Chauzat MP. Duchard S. Lewis G. Maus C. Miles MJ. Wallner K. Guidance for the assessment of risks to bees from the use of plant protection products applied as seed coating and soil applications – conclusions of the ICPBR dedicated working group. Julius-Kühn-Archiv. 2009;423:15–27. [Google Scholar]
- Balsari P. Manzone M. Marucco P. Tamagnone M. Evaluation of seed dressing dust dispersion from maize sowing machines. Crop Prot. 2013;51:19–23. [Google Scholar]
- Biocca M. Conte E. Pulcini P. Marinelli E. Pochi D. Sowing simulation tests of a pneumatic drill equipped with systems aimed at reducing the emission of abrasion dust from maize dressed seed. J Environ Sci Health Part B-Pestic Contam Agric Wastes. 2011;46:438–448. doi: 10.1080/03601234.2011.583825. [DOI] [PubMed] [Google Scholar]
- Blacquiere T. Smagghe G. van Gestel CAM. Mommaerts V. Neonicotinoids in bees: a review on concentrations, side-effects and risk assessment. Ecotoxicology. 2012;21::973–992. doi: 10.1007/s10646-012-0863-x. [DOI] [PMC free article] [PubMed] [Google Scholar]
- Bortolotti L. Sabatini AG. Mutinelli F. Astuti M. Lavazza A. Piro R. Porrini C. Spring honey bee losses in Italy. Julius-Kühn-Archiv. 2009;423:148–152. [Google Scholar]
- Cambra-Lopez M. Aarnink AJA. Zhao Y. Calvet S. Torres AG. Airborne particulate matter from livestock production systems: a review of an air pollution problem. Environ Pollut. 2010;158:1–17. doi: 10.1016/j.envpol.2009.07.011. [DOI] [PubMed] [Google Scholar]
- Cattanach AW. Dexter AG. Oplinger ES. Sugarbeets. Alternative Field Crops Manual. 2015 https://www.hort.purdue.edu/newcrop/afcm/sugarbeet.html Retrieved from.
- Devarrewaere W. D Foqué. Heimbach U. Cantre D. Nicolai B. Nuyttens D. Verboven P. Quantitative 3D shape description of dust particles from treated seeds by means of X-ray micro-CT. Environ Sci Technol. 2015;49::7310–7318. doi: 10.1021/acs.est.5b02250. [DOI] [PubMed] [Google Scholar]
- EFSA Scientific opinion on the science behind the development of a risk assessment of plant protection products on bees (Apis mellifera . Bombus spp. and solitary bees) EFSA Journal. 2012;10::2668. doi: 10.2903/j.efsa.2023.7989. [DOI] [PMC free article] [PubMed] [Google Scholar]
- ESA STAT Dust Working Group Physical method – assessment of free floating dust and abrasion particles of treated seeds as a parameter of the quality of treated seeds – Heubach test. 2011 Version 1.0. [Google Scholar]
- ESTA Industry dust reference values. 2014 http://esta.azurewebsites.net/Standard/Dust Retrieved from.
- European Commission EU Draft Guidance Document on Authorisation of plant protection products for seed treatment. 2014 Rep. No. SANCO/10553/2012. [Google Scholar]
- Foqué D. Devarrewaere W. Verboven P, Nuyttens D. Physical and chemical characteristics of abraded seed coating particles. Aspects ApplBiol. 2014;121:85–94. [Google Scholar]
- Forster R. Bee poisoning caused by insecticidal seed treatment of maize in Germany in 2008. Julius-Kühn-Archiv. 2009;423:126–130. [Google Scholar]
- Forster R. Giffard H. Heimbach U. Laporte J-M. Lückmann J. Nikolakis A. Vergnet C. ICPBR-Working group – risks proposed by dust: overview of the area and recommendations. Julius-Kühn-Archiv. 2012;437::191–198. [Google Scholar]
- Friessleben R. Schad T. Schmuck R. Schnier H. Schöning R. Nikolakis A. An effective risk management approach to prevent bee damage due to the emission of abraded seed treatment particles during sowing of neonicotinoid treated maize seeds. Aspects ApplBiol. 2010;99:277–282. [Google Scholar]
- Giffard H. Dupont T. A methodology to assess the impact on bees of dust from coated seeds. Julius-Kühn-Archiv. 2009;423:73–75. [Google Scholar]
- Girolami V. Mazzon L. Squartini A. Mori N. Marzaro M. Di Bernardo A. Tapparo A. Translocation of neonicotinoid insecticides from coated seeds to seedling guttation drops: a novel way of intoxication for bees. J Econ Entomol. 2009;102:1808–1815. doi: 10.1603/029.102.0511. [DOI] [PubMed] [Google Scholar]
- Gontijo PC. Moscardini VF. Michaud JP. Carvalho GA. Non-target effects of two sunflower seed treatments on Orius insidiosus (Hemiptera: Anthocoridae) Pest Manag Sci. 2014;71:515–522. doi: 10.1002/ps.3798. [DOI] [PubMed] [Google Scholar]
- Grantz DA. Garner JHB. Johnson DW. Ecological effects of particulate matter. Environ Int. 2003;29:213–239. doi: 10.1016/S0160-4120(02)00181-2. [DOI] [PubMed] [Google Scholar]
- Greatti M. Sabatini AG. Barbattini R. Rossi S. Stravisi A. Risk of environmental contamination by the active ingredient imidacloprid used for corn seed dressing: preliminary results. Bull Insectology. 2003;56:69–72. [Google Scholar]
- Heimbach U. Pistorius J. Schwabe K. Stähler M. Rautman D. Schenke D. Geogiadis P-T. Results of dust drift during sowing. Presentation held at the European Workshop on Seed Protection (Use of Coated Seeds and Granules) Definition of Good Practices. 10th and 11th May 2011, AgroParisTech-ENGREF, Paris. in Forster R, Giffard H, Heimbach U, Laporte J-M, Lückmann J, Nikolakis A, Pistorius J, Vergnet C. Julius-Kühn-Archiv. 2011;2012;437:191–198. ICPBR-Working group Risks proposed by dust: overview of the area and recommendations. [Google Scholar]
- Herbst A. Rautman D. Osteroth HJ. Wehmann HJ. Ganzelmeier H. Drift of seed dressing chemicals during the sowing of maize. Aspects of Applied Biol. 2010;99::265–269. [Google Scholar]
- Kaufman G. Seed coating: a tool for stand establishment; a stimulus to seed quality. HortTechnology. 1991;1:98–102. [Google Scholar]
- Krupke CH. Hunt GJ. Eitzer BD. Andino G. Given K. Multiple routes of pesticide exposure for honey bees living near agricultural fields. PLoS One. 2012;7:e29268. doi: 10.1371/journal.pone.0029268. [DOI] [PMC free article] [PubMed] [Google Scholar]
- Lee SJ. Mehler L. Beckman J. Diebolt-Brown B. Prado J. Lackovic M. Calvert GM. Acute pesticide illnesses associated with off-target pesticide drift from agricultural applications: 11 States, 1998-2006. Environ Health Perspect. 2011;119:1162–1169. doi: 10.1289/ehp.1002843. [DOI] [PMC free article] [PubMed] [Google Scholar]
- Marzaro M. Vivan L. Targa A. Mazzon L. Mori N. Greatti M. Girolami V. Lethal aerial powdering of honey bees with neonicotinoids from fragments of maize seed coat. Bull Insectol. 2011;64:119–126. [Google Scholar]
- Nikolakis A. Chapple A. Friessleben R. Neumann P. Schad T. Schmuck R. Maus C. An effective risk management approach to prevent bee damage due to the emission of abraded seed treatment particles during sowing of seeds treated with bee toxic insecticides. Julius-Kühn-Archiv. 2009;423:132–148. [Google Scholar]
- Nuyttens D. Devarrewaere W. Verboven P. D Foqué. Pesticide-laden dust emission and drift from treated seeds during seed drilling: a review. Pest Manag Sci. 2013;69:564–575. doi: 10.1002/ps.3485. [DOI] [PubMed] [Google Scholar]
- Pettis JS. Lichtenberg EM. Andree M. Stitzinger J. Rose R. Vanengelsdorp D. Crop pollination exposes honey bees to pesticides which alters their susceptibility to the gut pathogen Nosema ceranae . PLoS One. 2013;8:e70182. doi: 10.1371/journal.pone.0070182. [DOI] [PMC free article] [PubMed] [Google Scholar]
- Pistorius J. Bischoff G. Heimbach U. Stähler M. Bee poisoning incidents in Germany in spring 2008 caused by abrasion of active substance from treated seeds during sowing of maize. Julius-Kühn-Archiv. 2009;423:118–125. [Google Scholar]
- Pochi D. Biocca M. Fanigliulo R. Pulcini P. Conte E. Potential exposure of bees, Apis mellifera L., to particulate matter and pesticides derived from seed dressing during maize sowing. Bull Environ Contam Toxicol. 2012;89:354–361. doi: 10.1007/s00128-012-0664-1. [DOI] [PubMed] [Google Scholar]
- Potts SG. Biesmeijer JC. Kremen C. Neumann P. Schweiger O. Kunin WE. Global pollinator declines: trends, impacts and drivers. Trends Ecol Evol. 2010;25:345–353. doi: 10.1016/j.tree.2010.01.007. [DOI] [PubMed] [Google Scholar]
- Relyea RA. The impact of insecticides and herbicides on the biodiversity and productivity of aquatic communities. Ecol Appl. 2005;15:618–627. doi: 10.1890/1051-0761(2006)016[2022:tioiah]2.0.co;2. [DOI] [PubMed] [Google Scholar]
- Scott JM. Seed coatings and treatments and their effects on plant establishment. Adv Agron. 1989;42:43–83. [Google Scholar]
- Tapparo A. Marton D. Giorio C. Zanella A. Solda L. Marzaro M. Girolami V. Assessment of the environmental exposure of honeybees to particulate matter containing neonicotinoid insecticides coming from corn coated seeds. Environ Sci Technol. 2012;46:2592–2599. doi: 10.1021/es2035152. [DOI] [PubMed] [Google Scholar]
- Taylor AG. Harman GE. Concepts and technologies of selected seed treatments. Annu Rev Phytopathol. 1990;28:321–339. [Google Scholar]
- Zimmermann J. Stout JC. Underestimating neonicotinoid exposure: how extent and magnitude may be affected by land-use change. Environ Sci Pollut Res. 2016;23:7050–7054. doi: 10.1007/s11356-016-6159-6. [DOI] [PubMed] [Google Scholar]