

Abstract
Drinking water contamination with poly- and perfluoroalkyl substances (PFASs) poses risks to the developmental, immune, metabolic, and endocrine health of consumers. We present a spatial analysis of 2013–2015 national drinking water PFAS concentrations from the U.S. Environmental Protection Agency’s (US EPA) third Unregulated Contaminant Monitoring Rule (UCMR3) program. The number of industrial sites that manufacture or use these compounds, the number of military fire training areas, and the number of wastewater treatment plants are all significant predictors of PFAS detection frequencies and concentrations in public water supplies. Among samples with detectable PFAS levels, each additional military site within a watershed’s eight-digit hydrologic unit is associated with a 20% increase in PFHxS, a 10% increase in both PFHpA and PFOA, and a 35% increase in PFOS. The number of civilian airports with personnel trained in the use of aqueous film-forming foams is significantly associated with the detection of PFASs above the minimal reporting level. We find drinking water supplies for 6 million U.S. residents exceed US EPA’s lifetime health advisory (70 ng/L) for PFOS and PFOA. Lower analytical reporting limits and additional sampling of smaller utilities serving <10000 individuals and private wells would greatly assist in further identifying PFAS contamination sources.
Introduction
Poly- and perfluoroalkyl substances (PFASs) make up a large group of persistent anthropogenic chemicals used in industrial processes and commercial products over the past 60 years.1 Widespread use and extreme resistance to degradation have resulted in the ubiquitous presence of these compounds in the environment. The 2011–2012 U.S. National Health and Nutrition Examination Survey reported detectable serum PFAS concentrations in virtually all individuals (97%).2,3 Human PFAS exposure has been linked to cancer, elevated cholesterol, obesity, immune suppression, and endocrine disruption.4−6 Health concerns in the early 2000s prompted manufacturers in Europe and North America to phase out production of some long-chain PFASs.7−10 Declines in production of these compounds have been offset by increases in developing regions such as Asia.8 Limited available data suggest widespread exposure to replacement (short-chain) PFASs may also adversely affect human health.11,12
Human PFAS exposure includes dietary sources, household dust, air, and drinking water.13,14 Exposure from drinking water is a serious concern because of the high aqueous solubility of many PFASs.15,16 Relatively low PFAS concentrations can lead to elevated exposures in the general population.17 Elevated PFAS concentrations in U.S. drinking water have been reported in numerous regions,15,16,18,19 especially near industrial sites that produce or use them.6,16,20 For example, perfluorooctanoic acid (PFOA) concentrations 190-fold higher than the lifetime health advisory (70 ng/L) recommended by the U.S. Environmental Protection Agency (US EPA)21 were measured in drinking water near a fluorochemical facility in Washington, WV, where PFOA was used in fluoropolymer production.18
Many civilian airports and military fire training areas have been contaminated by PFASs contained in aqueous film-forming foams (AFFFs) that are widely used during firefighting training activities. Groundwater and surface waters surrounding these sites containing PFAS concentrations that are 3–4 orders of magnitude higher than the US EPA health advisory level for drinking water have been reported.22,23 Wastewater treatment plants (WWTPs) are another important PFAS source because these compounds are not removed by standard treatment methods24 and labile precursors biodegrade, increasing concentrations in effluent relative to influent.25,26 Land application of approximately half of the biosolids generated by WWTPs may contribute to human exposure through subsequent contamination of water, food, livestock, and wildlife.27
Understanding nationwide PFAS exposures from drinking water is important for identifying potentially vulnerable populations. However, previous studies have mainly focused on individual point sources of PFAS contamination and site-specific drinking water exposures.15,16 Here we develop a statistical framework for investigating whether increased PFAS concentrations in drinking water are associated with the number of point sources within a watershed (represented by an eight-digit hydrologic unit code, hereafter abbreviated HUC). We used publicly available drinking water concentration data for six PFASs from the US EPA’s third Unregulated Contaminant Monitoring Rule (UCMR3), including perfluorobutanesulfonic acid (PFBS), perfluorohexanesulfonic acid (PFHxS), perfluoroheptanoic acid (PFHpA), PFOA, perfluorooctanesulfonic acid (PFOS), and perfluorononanoic acid (PFNA) (Table S1).28 We discuss the utility of the UCMR3 database for identifying sources of PFASs to U.S. drinking water supplies, locations of vulnerable populations, and priorities for future monitoring.
Methods
Drinking Water Data
Our analysis included analytical results for six PFASs in 36149 drinking water samples from the US EPA’s UCMR3 program collected between January 2, 2013, and December 9, 2015.28 Samples cover all 4064 public water supplies serving >10000 individuals. Data are also available for 800 public water supplies serving <10000 individuals, but this represents only a small fraction (0.5%) of the 144165 in this category. Minimum reporting levels (MRLs) for the six PFASs analyzed are listed in Table S1.
One limitation of the UCMR3 database is that national data on system intakes for public water supplies are classified,29 making it difficult to place them within a specific hydrological network. We therefore extracted the zip codes for areas served and aggregated data within eight-digit HUCs30 to capture the most detailed hydrologic information that exceeds the spatial resolution of PFAS data (zip code areas). We used the highest reported PFAS concentrations when multiple systems were located within a single zip code and/or when multiple zip code areas were located within the same HUC.
PFAS Point Sources
Our spatial analysis (Figure S1) included point source information for (a) 16 industrial sites listed in the US EPA’s 2010/2015 PFOA Stewardship Program (Table S2),31 (b) 8572 WWTPs,32 (c) 290 military fire training areas that contain 664 military fire training sites,33 and (d) 533 civilian airports that are compliant with Title 14 Code of Federal Regulations, Part 139 for personnel trained in the use of AFFF (hereafter termed “AFFF-certified airports”).34 PFASs produced and/or used vary across industrial sites, and not all compounds were associated with all sites. For example, a fluorochemical manufacturing facility in Decatur, AL, produced both PFOS and PFOA,35 while only PFOA was used in the manufacturing process of another fluorochemical production facility in Parkersburg, WV.36 We conducted a sensitivity analysis to examine the potential production misclassification bias by limiting industrial sites to include the ones that only produced or used each specific compound (Table S3). We used the Google Maps application program interface (API) to geocode coordinates based on addresses. Potentially important PFAS sources such as landfills, biosolids, and small industrial PFAS users could not be included in this analysis because comprehensive geospatial data are not available.
Spatial and Statistical Analysis
We used ArcMap 10.3.1 (ESRI) to explore statistical differences between the number of point sources in eight-digit HUCs with PFAS levels above and below the level of detection. We developed a multivariate spatial regression model for watersheds with detectable PFASs that adjusts for correlations and co-location among point sources. A natural log transformation was used to normalize the distribution of individual PFASs. PFNA and PFBS were excluded from the spatial regression analysis due to a low detection frequency (15 and 14 of 1601 watersheds, respectively). We used Moran’s I statistic to test for spatial dependence in the model residuals from an ordinary least-squares (OLS) regression and correct for spatial dependence in the final spatial regression model. Akaike Information Criterion37 was used to compare the OLS and spatial regression models, where a lower value implies a better model fit. A series of cross-validation tests were also completed to assess the predictive capacity and stability of the final set of models. The OLS and spatial regression models were constructed using GeoDa 1.6 software,38 and cross-validation was implemented in R version 3.1.3.
Results and Discussion
PFASs in U.S. Drinking Water
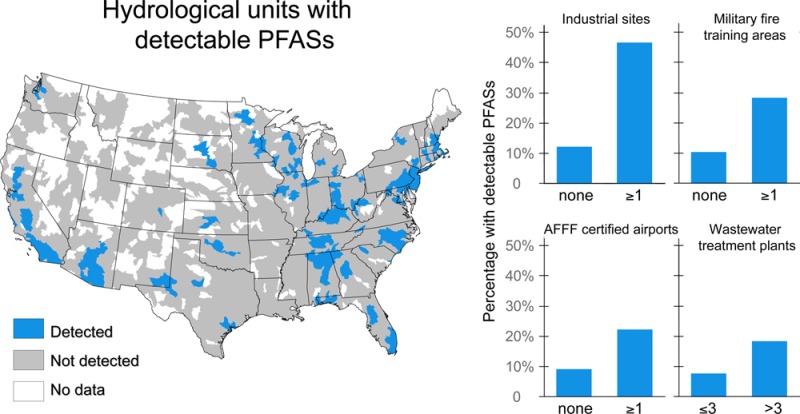
PFASs were detected at or above the MRLs in 194 of 4864 public water supplies, serving 16.5 million residents in 33 different states, three American territories (American Samoa, Northern Mariana Islands, and Guam), and the Salt River Pima-Maricopa Indian Community. Drinking water from 13 states accounted for 75% of detections, including, by order of frequency of detection, California, New Jersey, North Carolina, Alabama, Florida, Pennsylvania, Ohio, New York, Georgia, Minnesota, Arizona, Massachusetts, and Illinois (Figure 1). Detection frequencies for PFASs across the 4864 public water supplies were 2.2% for PFOA, 2.0% for PFOS, 1.7% for PFHpA, 1.1% for PFHxS, and <0.003% for others.
Figure 1.
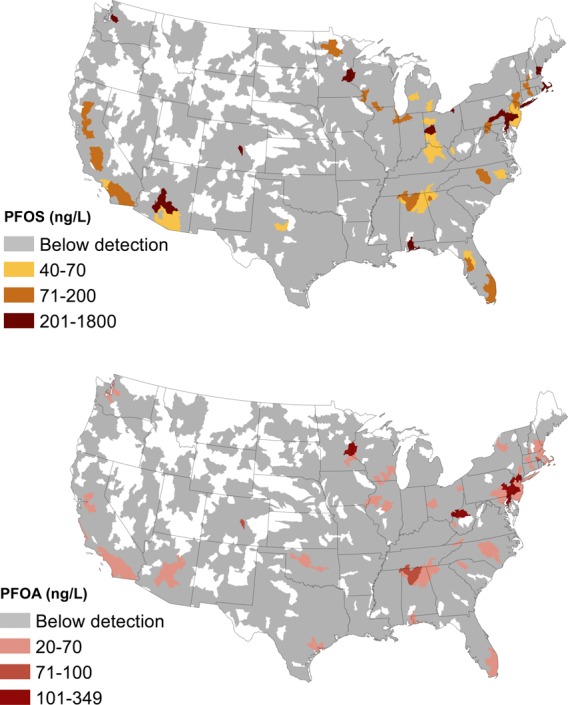
Hydrologic unit codes (eight-digit HUCs) used as a proxy for watersheds with detectable PFOA and PFOS in drinking water measured in the US EPA’s UCMR3 program (2013–2015). Blank areas represent regions where no data are available.
Many detectable PFAS concentrations in the UCMR3 database are above chronic drinking water and water quality standards for other regions (i.e., surface water European Union, PFOS, <1 ng/L; drinking water Sweden, sum of seven PFASs, <90 ng/L; groundwater State of New Jersey, PFNA, <10 ng/L; drinking water State of Vermont, sum of PFOS and PFOA, <20 ng/L).39−42 A recent analysis developed a benchmark dose for immunotoxicity in children and suggested a drinking water limit of approximately 1 ng/L for PFOS and PFOA.26 Data from rodents that measured sensitive end points such as mammary gland development support a similar level.26
Six million people were served by 66 public water supplies that have at least one sample at or above the US EPA’s 2016 health advisory for PFOS and PFOA (70 ng/L individually or combined). Concentrations ranged as high as 349 ng/L for PFOA, 1800 ng/L for PFOS, and 56 ng/L for PFNA.
The detection frequency in drinking water sourced from groundwater was more than twice that from surface water (Table S4). Long-chain PFASs43 (PFHxS, PFOS, PFOA, and PFNA) were more frequently detected in groundwater, and short-chain compounds (PFHpA and PFBS) were detected more frequently in surface waters. This may be due to both the original mode of environmental release (as an aerosol, application to soil, and aqueous discharge) and the inverse relationship between PFAS mobility and chain length.44 The MRLs (10–90 ng/L) in the UCMR3 database are up to 2 orders of magnitude higher than the limit of quantitation in most published studies,45−49 and more than 10 times higher than the drinking water limit (1 ng/L) suggested by human and animal studies.26,50 Because PFASs are detectable in virtually all parts of the environment,5,7,9,13,14,20,44,51 we infer that the large fraction of samples below reporting limits (Table S4) is driven in part by high MRLs.
Sources Surrounding Locations with Detectable PFASs
Our analysis indicates point sources are significantly more abundant in HUCs with detectable PFASs [two-sided t test, p < 0.05 (Table 1 and Figure S2)]. This includes drinking water samples from 1601 of the 2158 total U.S. HUCs. For example, HUCs with detectable PFOA levels (8% of the total) have more industrial sites, military fire training areas, AFFF-certified airports, and WWTPs than those with concentrations below detection. These trends can be observed across all PFASs. Similarly, HUCs with point sources have higher detection frequencies for PFASs (Table S5). For example, the presence of a military fire training area within a HUC increases the frequency of detection of at least one PFAS from 10.4% to 28.2%. One caveat is that imprecise information about public water supply intakes can cause misclassification bias. Systems that draw water upstream from point sources, such as Minneapolis and St. Paul in Minnesota, may not actually be affected as indicated by the aggregated spatial analysis.
Table 1. Mean Abundance of Point Sources within Eight-Digit Hydrologic Unit Codes (HUCs) with Drinking Water PFAS Concentrations above and below the Method Reporting Limit in the UCMR3 Program.
| mean abundancea within
eight-digit hydrologic unit codes |
||||
|---|---|---|---|---|
| compound | major industrial sitesb | military fire training areas | AFFF-certified airports | WWTPsc |
| PFBS | ||||
| <90 ng/L (n = 1587) | 0.01 | 0.15 | 0.29 | 4.9 |
| >90 ng/L (n = 14) | 0.21 | 0.71 | 0.50 | 14.6 |
| p-valued | 0.206 | 0.105 | 0.148 | 0.069 |
| PFHxS | ||||
| <30 ng/L (n = 1507) | 0.01 | 0.13 | 0.27 | 4.8 |
| >30 ng/L (n = 94) | 0.06 | 0.60 | 0.63 | 8.8 |
| p-value | 0.056 | <0.001 | <0.001 | <0.001 |
| PFHpA | ||||
| <10 ng/L (n = 1509) | 0.01 | 0.13 | 0.26 | 4.7 |
| >10 ng/L (n = 92) | 0.09 | 0.57 | 0.67 | 9.7 |
| p-value | 0.016 | <0.001 | <0.001 | <0.001 |
| PFOA | ||||
| <20 ng/L (n = 1473) | 0.01 | 0.13 | 0.26 | 4.6 |
| >20 ng/L (n = 128) | 0.05 | 0.52 | 0.56 | 9.5 |
| p-value | 0.038 | <0.001 | <0.001 | <0.001 |
| PFOS | ||||
| <40 ng/L (n = 1487) | 0.01 | 0.13 | 0.26 | 4.7 |
| >40 ng/L (n = 114) | 0.05 | 0.54 | 0.57 | 8.9 |
| p-value | 0.064 | <0.001 | <0.001 | <0.001 |
| PFNA | ||||
| <20 ng/L (n = 1586) | 0.01 | 0.15 | 0.28 | 4.9 |
| >20 ng/L (n = 15) | 0.13 | 1.13 | 1.13 | 20.1 |
| p-value | 0.366 | 0.014 | 0.008 | 0.007 |
The mean abundance is calculated as the mean number of point sources within HUCs with PFASs above or below the level of detection.
Only the major industrial sites participating in the US EPA’s 2010/2015 PFOA Stewardship Program were included.
Wastewater treatment plant.
Two-sample t-test p-values.
Results of the Spatial Regression Model
Spatial regression modeling explains 38–62% of the variance in drinking water concentrations for the four PFASs considered (Table 2). Each additional industrial site within a HUC is associated with an 81% increase in PFOA (p < 0.001), which is the strongest statistical association across compounds and point sources. Increasing PFOS concentrations are positively associated with the number of industrial sites, but this relationship is not statistically significant (p = 0.124). The small number of sites that have manufactured or used PFOS likely accounts for the lack of a statistically significant relationship.
Table 2. Spatial Regression Models for Drinking Water PFAS Concentrations as a Function of the Abundance of Point Sources.
| compound | major industrial sitesa | MFTAsb | AFFF-certified airports | WWTPsc | λd | R2 |
|---|---|---|---|---|---|---|
| PFHxS | ||||||
| coefficiente | 24% | 20% | –13% | 1% | 94% | 0.62 |
| p-valuef | 0.249 | 0.002 | 0.073 | 0.045 | <0.001 | |
| PFHpA | ||||||
| coefficient | 10% | 10% | –2% | 0.5% | 72% | 0.40 |
| p-value | 0.569 | 0.155 | 0.761 | 0.436 | <0.001 | |
| PFOA | ||||||
| coefficient | 81% | 10% | –6% | 2% | 52% | 0.38 |
| p-value | <0.001 | 0.111 | 0.353 | 0.006 | <0.001 | |
| PFOS | ||||||
| coefficient | 46% | 35% | –6% | 2% | 79% | 0.46 |
| p-value | 0.124 | <0.001 | 0.512 | 0.007 | <0.001 |
Only the major industrial sites participating in US EPA’s 2010/2015 PFOA Stewardship Program were included.
MFTA = military fire training area.
WWTP = wastewater treatment plant.
Coefficient for the spatial error term characterizing spatial influence.
Results have been transformed to reflect expected changes in drinking water concentrations per increase in the abundance of different sources. Positive coefficients in the results indicate increasing concentrations with an increasing abundance of point sources within the same hydrologic unit.
p-values for the spatial error regression model. The spatial error term is used to incorporate spatial autocorrelation structures into a linear regression model.
The number of military fire training areas within each HUC is positively associated with increasing levels of all PFOS, PFOA, PFHxS, and PFHpA, and is statistically significant for PFHxS (p = 0.045) and PFOS (p = 0.007). Each additional military fire training area within the same HUC is associated with a 20% increase in PFHxS (p = 0.002), a 10% increase in PFHpA (p = 0.155), a 10% increase in PFOA (p = 0.111), and a 35% increase in PFOS (p < 0.001). AFFFs typically contain relatively high concentrations of PFOS and PFHxS and their polyfluorinated precursors compared to the concentrations of other perfluorinated carboxylates,23,52−54 which is consistent with these statistical results.
We find a small but significant increase in PFOS and PFOA (2%; p < 0.01) with each additional WWTP within the same HUC. This is consistent with the greater abundance but smaller quantities of PFASs released by WWTPs.55 Similarly, results of Valsecchi et al.51 show PFAS releases from WWTPs are important but less significant than those from fluorochemical manufacturing facilities in Italy. The number of WWTPs may also be a proxy for other population-driven PFAS sources.
The number of AFFF-certified airports is not significantly associated with PFAS concentrations in the current data set. This may reflect misclassification bias because the certification used to identify airports indicates eligibility but not actual use of AFFF. The UCMR3 database contains limited data for smaller drinking water systems where localized reports of contamination from airports have been most abundant.22,56
Current Data Limitations and Future Monitoring Efforts
The UCMR3 database has several limitations that restrict its predictive power for identifying U.S. drinking water supplies likely to contain elevated levels of PFASs. Classification of geospatial data on intakes for public water supplies limits the spatial resolution of the current data set and associated statistical models to a radius of 50 km (median radius of watersheds).57,58 Many of the impacted drinking water systems are groundwater systems, and contaminated groundwater plumes are often much smaller than 50 km.23,53,59
Geospatial data are lacking for many potentially important PFAS point sources such as a wide range of industries, landfills, biosolids application, and other AFFF-impacted sites where relatively smaller volumes of AFFF were released.27,54,60−67 Data on PFAS releases from smaller industrial facilities (e.g., plastics, textiles, paper, and lubricants) are usually withheld as confidential business information, and little information about airborne emissions is available for characterizing the importance of atmospheric releases and potential long-range transport. For example, biosolids application resulted in one of the largest PFAS drinking water contamination events in Europe68 but could not be included in this analysis because U.S. use data are not available on a national scale.
Sources not included in our spatial analysis are represented by the highly significant lambda (λ) coefficients (Table 2). Areas with high model residuals (greater than 1.5 standard deviation) mean that current information about sources cannot fully explain the high observed PFAS concentrations. The map of model residuals (Figure S3) can thus be used to guide high-priority sampling regions in future work.
We found a statistically greater abundance of point sources in watersheds with detectable PFASs, including AFFF-certified airports. However, multivariate spatial regression models did not show a significant association between AFFF-certified airports and concentrations of PFASs in nearby drinking water. Other studies have reported elevated PFAS concentrations in groundwater wells adjacent to AFFF-certified airports.22 Small drinking water systems and private wells may be disproportionately affected by PFASs originating from AFFF use at civilian airports, but representative data for these small drinking water systems are not included in the UCMR3 program.69
Approximately 44.5 million U.S. individuals rely on private drinking water wells,70 and 52 million individuals rely on smaller public water supplies (<10000 served). The UCMR3 program includes 0.5% testing incidence for smaller public water supplies71 and no testing of private wells, meaning that information about drinking water PFAS exposures is therefore lacking for almost one-third of the U.S. population.
Acknowledgments
We acknowledge financial support for research at Harvard from the Smith Family Foundation and a private donor. We thank Marcia Castro (Harvard) for her feedback on an earlier version of the manuscript and Jahred Liddie (Harvard) for his assistance with the sensitivity analysis. T.A.B. was supported by the U.S. National Institute for Environmental Health Sciences (NIEHS) Superfund Research Program (Grant P42 ES004705) and the Superfund Research Center at the University of California, Berkeley. The views expressed in this article are those of the authors and do not necessarily represent the views or policies of the U.S. Environmental Protection Agency.
Supporting Information Available
The Supporting Information is available free of charge on the ACS Publications website at DOI: 10.1021/acs.estlett.6b00260.
Additional tables and figures (PDF)
The authors declare no competing financial interest.
There was a text error in the Results and Discussion section in the version published ASAP August 9, 2016; the corrected version was published ASAP August 11, 2016.
Supplementary Material
References
- Kissa E.Fluorinated surfactants and repellents, 2nd ed.; CRC Press: Boca Raton, FL, 2001. [Google Scholar]
- Lewis R. C.; Johns L. E.; Meeker J. D. Serum Biomarkers of Exposure to Perfluoroalkyl Substances in Relation to Serum Testosterone and Measures of Thyroid Function among Adults and Adolescents from NHANES 2011–2012. Int. J. Environ. Res. Public Health 2015, 12 (6), 6098–6114. 10.3390/ijerph120606098. [DOI] [PMC free article] [PubMed] [Google Scholar]
- Fourth National Report on Human Exposure to Environmental Chemicals; Centers for Disease Control and Prevention: Atlanta, 2015. [Google Scholar]
- Grandjean P.; Andersen E.; Budtz-Jørgensen E.; Nielsen F.; Mølbak K.; Weihe P.; Heilmann C. Serum vaccine antibody concentrations in children exposed to perfluorinated compounds. JAMA 2012, 307 (4), 391–397. 10.1001/jama.2011.2034. [DOI] [PMC free article] [PubMed] [Google Scholar]
- Braun J. M.; Chen A.; Romano M. E.; Calafat A. M.; Webster G. M.; Yolton K.; Lanphear B. P. Prenatal perfluoroalkyl substance exposure and child adiposity at 8 years of age: The HOME study. Obesity 2016, 24, 231–237. 10.1002/oby.21258. [DOI] [PMC free article] [PubMed] [Google Scholar]
- Barry V.; Winquist A.; Steenland K. Perfluorooctanoic acid (PFOA) exposures and incident cancers among adults living near a chemical plant. Environ. Health Perspect 2013, 121 (11–12), 1313–1318. 10.1289/ehp.1306615. [DOI] [PMC free article] [PubMed] [Google Scholar]
- Land M.; de Wit C. A.; Cousins I. T.; Herzke D.; Johansson J.; Martin J. W. What is the effect of phasing out long-chain per- and polyfluoroalkyl substances on the concentrations of perfluoroalkyl acids and their precursors in the environment? A systematic review protocol. Environmental Evidence 2015, 4 (1), 1–13. 10.1186/2047-2382-4-3. [DOI] [Google Scholar]
- Working Towards a Global Emission Inventory of PFASs; Environment Directorate, Organization for Economic Cooperation and Development: Paris, 2015. [Google Scholar]
- Wang Z.; Cousins I. T.; Scheringer M.; Buck R. C.; Hungerbühler K. Global emission inventories for C 4–C 14 perfluoroalkyl carboxylic acid (PFCA) homologues from 1951 to 2030, Part I: production and emissions from quantifiable sources. Environ. Int. 2014, 70, 62–75. 10.1016/j.envint.2014.04.013. [DOI] [PubMed] [Google Scholar]
- Butenhoff J. L.; Chang S.-C.; Ehresman D. J.; York R. G. Evaluation of potential reproductive and developmental toxicity of potassium perfluorohexanesulfonate in Sprague Dawley rats. Reprod. Toxicol. 2009, 27 (3), 331–341. 10.1016/j.reprotox.2009.01.004. [DOI] [PubMed] [Google Scholar]
- Birnbaum L. S.; Grandjean P. Alternatives to PFASs: Perspectives on the Science. Environ. Health Perspect. 2015, 123 (5), A104. 10.1289/ehp.1509944. [DOI] [PMC free article] [PubMed] [Google Scholar]
- Caverly Rae J. M.; Craig L.; Slone T. W.; Frame S. R.; Buxton L. W.; Kennedy G. L. Evaluation of chronic toxicity and carcinogenicity of ammonium 2,3,3,3-tetrafluoro-2-(heptafluoropropoxy)-propanoate in Sprague–Dawley rats. Toxicology Reports 2015, 2, 939–949. 10.1016/j.toxrep.2015.06.001. [DOI] [PMC free article] [PubMed] [Google Scholar]
- Vestergren R.; Cousins I. T. Tracking the Pathways of Human Exposure to Perfluorocarboxylates. Environ. Sci. Technol. 2009, 43 (15), 5565–5575. 10.1021/es900228k. [DOI] [PubMed] [Google Scholar]
- D’Hollander W.; de Voogt P.; De Coen W.; Bervoets L.. Perfluorinated Substances in Human Food and Other Sources of Human Exposure. In Reviews of Environmental Contamination and Toxicology; De Voogt P., Ed.; Springer: New York, 2010; Vol. 208, pp 179–215. [DOI] [PubMed] [Google Scholar]
- Emmett E. A.; Shofer F. S.; Zhang H.; Freeman D.; Desai C.; Shaw L. M. Community exposure to perfluorooctanoate: relationships between serum concentrations and exposure sources. J. Occup. Environ. Med. 2006, 48 (8), 759–770. 10.1097/01.jom.0000232486.07658.74. [DOI] [PMC free article] [PubMed] [Google Scholar]
- Landsteiner A.; Huset C.; Williams A.; Johnson J. Biomonitoring for Perfluorochemicals in a Minnesota Community With Known Drinking Water Contamination. Journal of Environmental Health 2014, 77 (5), 14–19. [PubMed] [Google Scholar]
- Hurley S.; Houtz E.; Goldberg D.; Wang M.; Park J.-S.; Nelson D. O.; Reynolds P.; Bernstein L.; Anton-Culver H.; Horn-Ross P.; Petreas M. Preliminary Associations between the Detection of Perfluoroalkyl Acids (PFAAs) in Drinking Water and Serum Concentrations in a Sample of California Women. Environ. Sci. Technol. Lett. 2016, 3, 264–269. 10.1021/acs.estlett.6b00154. [DOI] [Google Scholar]
- Hoffman K.; Webster T. F.; Bartell S. M.; Weisskopf M. G.; Fletcher T.; Vieira V. M. Private Drinking Water Wells as a Source of Exposure to Perfluorooctanoic Acid (PFOA) in Communities Surrounding a Fluoropolymer Production Facility. Environ. Health Perspect. 2011, 119, 92–97. 10.1289/ehp.1002503. [DOI] [PMC free article] [PubMed] [Google Scholar]
- Shin H.-M.; Vieira V. M.; Ryan P. B.; Detwiler R.; Sanders B.; Steenland K.; Bartell S. M. Environmental Fate and Transport Modeling for Perfluorooctanoic Acid Emitted from the Washington Works Facility in West Virginia. Environ. Sci. Technol. 2011, 45 (4), 1435–1442. 10.1021/es102769t. [DOI] [PubMed] [Google Scholar]
- Perfluorochemical Serum Sampling in the vicinity of Decatur, Alabama, Morgan, Lawrence, and Limestone Counties; Centers for Disease Control and Prevention: Atlanta, 2013.
- Lifetime Health Advisories and Health Effects Support Documents for Perfluorooctanoic Acid and Perfluorooctane Sulfonate; Environmental Protection Agency: Washington, DC, 2016.
- Ahrens L.; Norstrom K.; Viktor T.; Cousins A. P.; Josefsson S. Stockholm Arlanda Airport as a source of per- and polyfluoroalkyl substances to water, sediment and fish. Chemosphere 2015, 129, 33–8. 10.1016/j.chemosphere.2014.03.136. [DOI] [PubMed] [Google Scholar]
- Moody C. A.; Hebert G. N.; Strauss S. H.; Field J. A. Occurrence and persistence of perfluorooctanesulfonate and other perfluorinated surfactants in groundwater at a fire-training area at Wurtsmith Air Force Base, Michigan, USA. J. Environ. Monit. 2003, 5 (2), 341–5. 10.1039/b212497a. [DOI] [PubMed] [Google Scholar]
- Schultz M. M.; Higgins C. P.; Huset C. A.; Luthy R. G.; Barofsky D. F.; Field J. A. Fluorochemical mass flows in a municipal wastewater treatment facility. Environ. Sci. Technol. 2006, 40 (23), 7350–7357. 10.1021/es061025m. [DOI] [PMC free article] [PubMed] [Google Scholar]
- Loganathan B. G.; Sajwan K. S.; Sinclair E.; Senthil Kumar K.; Kannan K. Perfluoroalkyl sulfonates and perfluorocarboxylates in two wastewater treatment facilities in Kentucky and Georgia. Water Res. 2007, 41 (20), 4611–20. 10.1016/j.watres.2007.06.045. [DOI] [PubMed] [Google Scholar]
- Post G. B.; Cohn P. D.; Cooper K. R. Perfluorooctanoic acid (PFOA), an emerging drinking water contaminant: a critical review of recent literature. Environ. Res. 2012, 116, 93–117. 10.1016/j.envres.2012.03.007. [DOI] [PubMed] [Google Scholar]
- Lindstrom A. B.; Strynar M. J.; Delinsky A. D.; Nakayama S. F.; McMillan L.; Libelo E. L.; Neill M.; Thomas L. Application of WWTP biosolids and resulting perfluorinated compound contamination of surface and well water in Decatur, Alabama, USA. Environ. Sci. Technol. 2011, 45 (19), 8015–8021. 10.1021/es1039425. [DOI] [PubMed] [Google Scholar]
- Third Unregulated Contaminant Monitoring Rule; Environmental Protection Agency: Washington, DC: (https://http://www.epa.gov/dwucmr/occurrence-data-unregulated-contaminant-monitoring-rule-3) (accessed May, 23, 2016).
- Why is only certain information made available to the public (PWS ID), but not facility location information (longitude and latitude)? Environmental Protection Agency: Washington, DC: (https://safewater.zendesk.com/hc/en-us/articles/212078697-Why-is-only-certain-information-made-available-to-the-public-PWS-ID-but-not-facility-location-information-longitude-and-latitude-).
- U.S. Geological Survey. 1:250,000-scale Hydrologic Units of the United States (http://water.usgs.gov/GIS/metadata/usgswrd/XML/huc250k.xml).
- Per- and Polyfluoroalkyl Substances (PFASs) under TSCA; Environmental Protection Agency: Washington, DC: (https://http://www.epa.gov/assessing-and-managing-chemicals-under-tsca/and-polyfluoroalkyl-substances-pfass-under-tsca).
- Database associated with the Clean Watersheds Needs Survey (CWNS) 2008 Report to Congress; Environmental Protection Agency: Washington, DC, 2008. (https://http://www.epa.gov/cwns/clean-watersheds-needs-survey-cwns-2008-report-and-data) (accessed March 2014).
- DoD Inventory of Fire/Crash Training Area Sites (as of the end of FY 2014); U.S. Department of Defense: Washington, DC: [https://assets.documentcloud.org/documents/2647381/List-of-Fire-amp-Crash-Training-Areas-EOY14.pdf(12-23)].
- Programs for Training of Aircraft Rescue and Firefighting Personnel; U.S. Department of Transportation Federal Aviation Administration, AC No. 150/5210-17C, 2015.
- 3M. Map, 3M-Decatur Manufacturing Facility. In U.S. EPA Docket AR226-1484; Environmental Protection Agency: Washington, DC, 2003. [Google Scholar]
- DuPont. DuPont Telomer Manufacturing Sites: Environmental Assessment of PFOA Levels in Air and Water. In U.S. EPA Docket AR226-1534; Environmental Protection Agency: Washington, DC, 2003. [Google Scholar]
- Akaike H. A new look at the statistical model identification. IEEE Trans. Autom. Control 1974, 19 (6), 716–723. 10.1109/TAC.1974.1100705. [DOI] [Google Scholar]
- Anselin L.; Syabri I.; Kho Y. GeoDa: an introduction to spatial data analysis. Geographical analysis 2006, 38 (1), 5–22. 10.1111/j.0016-7363.2005.00671.x. [DOI] [Google Scholar]
- Livsmedelsverket, Riskhantering - PFAS i dricksvatten och fisk; National Food Agency: Uppsala, Sweden, 2016. (http://www.livsmedelsverket.se/livsmedel-och-innehall/oonskade-amnen/miljogifter/pfas-poly-och-perfluorerade-alkylsubstanser/riskhantering-pfaa-i-dricksvatten/). [Google Scholar]
- New Jersey DEP Ground Water Quality Standards-Class IIA by Constituent (http://www.nj.gov/dep/standards/groundwater.pdf) (accessed February 18, 2016).
- EU. Directive 2013/39/EU of the European Parliament and of the Council of 12 August 2013 amending Directives 2000/60/EC and 2008/105/EC as regards priority substances in the field of water policy. In EU Environmental Quality Standards; 2013. [Google Scholar]
- Vermont Perfluorooctanoic acid (PFOA) and Perfluorooctanesulfonic acid (PFOS) Vermont Drinking Water Health Advisory (https://anrweb.vt.gov/PubDocs/DEC/PFOA/PFOA%20-%20PFOS%20Health%20Advisories/Vermont/PFOA_PFOS_HealthAdvisory_June_22_2016.pdf).
- Buck R. C.; Franklin J.; Berger U.; Conder J. M.; Cousins I. T.; de Voogt P.; Jensen A. A.; Kannan K.; Mabury S. A.; van Leeuwen S. P. J. Perfluoroalkyl and Polyfluoroalkyl Substances in the Environment: Terminology, Classification, and Origins. Integr. Environ. Assess. Manage. 2011, 7 (4), 513–541. 10.1002/ieam.258. [DOI] [PMC free article] [PubMed] [Google Scholar]
- Bergström S. Transport of per-and polyfluoroalkyl substances in soil and groundwater in Uppsala, Sweden. 2014.
- Thompson J.; Eaglesham G.; Mueller J. Concentrations of PFOS, PFOA and other perfluorinated alkyl acids in Australian drinking water. Chemosphere 2011, 83 (10), 1320–1325. 10.1016/j.chemosphere.2011.04.017. [DOI] [PubMed] [Google Scholar]
- Taniyasu S.; Kannan K.; Wu Q.; Kwok K. Y.; Yeung L. W. Y.; Lam P. K. S.; Chittim B.; Kida T.; Takasuga T.; Tsuchiya Y.; Yamashita N. Inter-laboratory trials for analysis of perfluorooctanesulfonate and perfluorooctanoate in water samples: Performance and recommendations. Anal. Chim. Acta 2013, 770, 111–120. 10.1016/j.aca.2013.01.056. [DOI] [PubMed] [Google Scholar]
- Eriksson U.; Kärrman A.; Rotander A.; Mikkelsen B.; Dam M. Perfluoroalkyl substances (PFASs) in food and water from Faroe Islands. Environ. Sci. Pollut. Res. 2013, 20 (11), 7940–7948. 10.1007/s11356-013-1700-3. [DOI] [PubMed] [Google Scholar]
- Happonen M.; Koivusalo H.; Malve O.; Perkola N.; Juntunen J.; Huttula T. Contamination risk of raw drinking water caused by PFOA sources along a river reach in south-western Finland. Sci. Total Environ. 2016, 541, 74–82. 10.1016/j.scitotenv.2015.09.008. [DOI] [PubMed] [Google Scholar]
- Munoz G.; Vo Duy S.; Budzinski H.; Labadie P.; Liu J.; Sauvé S. Quantitative analysis of poly- and perfluoroalkyl compounds in water matrices using high resolution mass spectrometry: Optimization for a laser diode thermal desorption method. Anal. Chim. Acta 2015, 881, 98–106. 10.1016/j.aca.2015.04.015. [DOI] [PubMed] [Google Scholar]
- Grandjean P.; Budtz-Jorgensen E. Immunotoxicity of perfluorinated alkylates: calculation of benchmark doses based on serum concentrations in children. Environ. Health 2013, 12 (1), 35. 10.1186/1476-069X-12-35. [DOI] [PMC free article] [PubMed] [Google Scholar]
- Valsecchi S.; Rusconi M.; Mazzoni M.; Viviano G.; Pagnotta R.; Zaghi C.; Serrini G.; Polesello S. Occurrence and sources of perfluoroalkyl acids in Italian river basins. Chemosphere 2015, 129, 126–134. 10.1016/j.chemosphere.2014.07.044. [DOI] [PubMed] [Google Scholar]
- Hebert G. N.; Odom M. A.; Craig P. S.; Dick D. L.; Strauss S. H. Method for the determination of sub-ppm concentrations of perfluoroalkylsulfonate anions in water. J. Environ. Monit. 2002, 4 (1), 90–95. 10.1039/b108463c. [DOI] [PubMed] [Google Scholar]
- Houtz E. F.; Higgins C. P.; Field J. A.; Sedlak D. L. Persistence of perfluoroalkyl acid precursors in AFFF-impacted groundwater and soil. Environ. Sci. Technol. 2013, 47 (15), 8187–8195. 10.1021/es4018877. [DOI] [PubMed] [Google Scholar]
- Anderson R. H.; Long G. C.; Porter R. C.; Anderson J. K. Occurrence of select perfluoroalkyl substances at U.S. Air Force aqueous film-forming foam release sites other than fire-training areas: Field-validation of critical fate and transport properties. Chemosphere 2016, 150, 678–85. 10.1016/j.chemosphere.2016.01.014. [DOI] [PubMed] [Google Scholar]
- Sinclair E.; Kannan K. Mass Loading and Fate of Perfluoroalkyl Surfactants in Wastewater Treatment Plants. Environ. Sci. Technol. 2006, 40 (5), 1408–1414. 10.1021/es051798v. [DOI] [PubMed] [Google Scholar]
- Schaider L. A.; Rudel R. A.; Ackerman J. M.; Dunagan S. C.; Brody J. G. Pharmaceuticals, perfluorosurfactants, and other organic wastewater compounds in public drinking water wells in a shallow sand and gravel aquifer. Sci. Total Environ. 2014, 468–469, 384–393. 10.1016/j.scitotenv.2013.08.067. [DOI] [PubMed] [Google Scholar]
- Pascual P.; Stiber N.; Sunderland E.. Draft guidance on the development, evaluation, and application of regulatory environmental models; The Council for Regulatory Environmental Modeling, Office of Science Policy, Office of Research and Development, Environmental Protection Agency: Washington, DC, 2003. [Google Scholar]
- NRC. Models in Environmental Regulatory Decision Making; National Research Council, Committee on Models in the Regulatory Decision Process, National Academies Press: Washington, DC, 2007. [Google Scholar]
- Houtz E. F.; Sutton R.; Park J.-S.; Sedlak M. Poly- and perfluoroalkyl substances in wastewater: Significance of unknown precursors, manufacturing shifts, and likely AFFF impacts. Water Res. 2016, 95, 142–149. 10.1016/j.watres.2016.02.055. [DOI] [PubMed] [Google Scholar]
- Konwick B. J.; Tomy G. T.; Ismail N.; Peterson J. T.; Fauver R. J.; Higginbotham D.; Fisk A. T. Concentrations and patterns of perfluoroalkyl acids in Georgia, USA surface waters near and distant to a major use source. Environ. Toxicol. Chem. 2008, 27 (10), 2011–2018. 10.1897/07-659.1. [DOI] [PubMed] [Google Scholar]
- Clara M.; Scheffknecht C.; Scharf S.; Weiss S.; Gans O. Emissions of perfluorinated alkylated substances (PFAS) from point sources--identification of relevant branches. Water Sci. Technol. 2008, 58 (1), 59. 10.2166/wst.2008.641. [DOI] [PubMed] [Google Scholar]
- Zhang C.; Peng Y.; Niu X.; Ning K. Determination of perfluoroalkyl substances in municipal landfill leachates from Beijing, China. Asian J. Chem. 2014, 26 (13), 3833. [Google Scholar]
- Busch J.; Ahrens L.; Sturm R.; Ebinghaus R. Polyfluoroalkyl compounds in landfill leachates. Environ. Pollut. 2010, 158 (5), 1467–1471. 10.1016/j.envpol.2009.12.031. [DOI] [PubMed] [Google Scholar]
- Huset C. A.; Barlaz M. A.; Barofsky D. F.; Field J. A. Quantitative determination of fluorochemicals in municipal landfill leachates. Chemosphere 2011, 82 (10), 1380–1386. 10.1016/j.chemosphere.2010.11.072. [DOI] [PMC free article] [PubMed] [Google Scholar]
- Blaine A. C.; Rich C. D.; Hundal L. S.; Lau C.; Mills M. A.; Harris K. M.; Higgins C. P. Uptake of perfluoroalkyl acids into edible crops via land applied biosolids: Field and greenhouse studies. Environ. Sci. Technol. 2013, 47 (24), 14062–14069. 10.1021/es403094q. [DOI] [PubMed] [Google Scholar]
- Sepulvado J. G.; Blaine A. C.; Hundal L. S.; Higgins C. P. Occurrence and fate of perfluorochemicals in soil following the land application of municipal biosolids. Environ. Sci. Technol. 2011, 45 (19), 8106–8112. 10.1021/es103903d. [DOI] [PubMed] [Google Scholar]
- Rich C. D.; Blaine A. C.; Hundal L.; Higgins C. P. Bioaccumulation of perfluoroalkyl acids by earthworms (Eisenia fetida) exposed to contaminated soils. Environ. Sci. Technol. 2015, 49 (2), 881–8. 10.1021/es504152d. [DOI] [PubMed] [Google Scholar]
- Hölzer J.; Midasch O.; Rauchfuss K.; Kraft M.; Reupert R.; Angerer J.; Kleeschulte P.; Marschall N.; Wilhelm M. Biomonitoring of Perfluorinated Compounds in Children and Adults Exposed to Perfluorooctanoate-Contaminated Drinking Water. Environ. Health Perspect. 2008, 116 (5), 651–657. 10.1289/ehp.11064. [DOI] [PMC free article] [PubMed] [Google Scholar]
- Report of Investigation Activities at Select Firefighting Foam Training Areas and Foam Discharge Sites in Minnesota; Minnesota Pollution Control Agency: St. Paul, MN, 2010.
- Maupin M. A.; Kenny J. F.; Hutson S. S.; Lovelace J. K.; Barber N. L.; Linsey K. S. Estimated use of water in the United States in 2010. Report 2330-5703; U.S. Geological Survey, 2014. [Google Scholar]
- Factoids: Drinking Water and Ground Water Statistics for 2009; Environmental Protection Agency Office of Water: Washington, DC, 2009. [Google Scholar]
Associated Data
This section collects any data citations, data availability statements, or supplementary materials included in this article.