

Abstract
Genome-wide association studies (GWASs) have become a standard tool for dissecting genetic contributions to disease risk. However, these studies typically require extraordinarily large sample sizes to be adequately powered. Strategies that incorporate functional information alongside genetic associations have proved successful in increasing GWAS power. Following this paradigm, we present the results of 20 different genetic association studies for quantitative traits related to complex diseases, conducted in the Hutterites of South Dakota. To boost the power of these association studies, we collected RNA-sequencing data from lymphoblastoid cell lines for 431 Hutterite individuals. We then used Sherlock, a tool that integrates GWAS and expression quantitative trait locus (eQTL) data, to identify weak GWAS signals that are also supported by eQTL data. Using this approach, we found novel associations with quantitative phenotypes related to cardiovascular disease, including carotid intima-media thickness, left atrial volume index, monocyte count and serum YKL-40 levels.
Introduction
Genome-wide association studies (GWASs) have become the gold standard for assessing the genetic underpinnings of complex traits in human populations (1). These studies are easily scalable, limited primarily by financial or practical challenges related to measuring the trait of interest in large samples of subjects. However, an obstacle commonly faced by GWAS is that the modest influence of genetic variation at any particular locus makes it difficult to identify variants with statistically significant associations. In light of this, various strategies have been adopted to increase the power of GWAS, including: increasing sample sizes [e.g. (2)], combining studies through meta-analysis [e.g. (3)], studying intermediate phenotypes [e.g. (4)] and integrating results with independent functional data sets [e.g. (5)]. While each of these strategies can potentially increase the power of a study, the strategy of integrating association data with functional data has the added benefit of providing information on functional consequences of genetic variation at particular loci.
Our group has been studying the genetic basis of complex traits in an isolated founder population, the Hutterites of South Dakota, for nearly 20 years (6–9). We have previously adopted some of the alternative strategies to increase study power, particularly through the use of intermediate phenotypes and integration with independent data sets [e.g. (10,11)]. As a part of these on-going efforts, we collected RNA-sequencing (RNA-seq) data from lymphoblastoid cell lines (LCLs) of a subset (N = 431) of individuals from this population. We then identified genes associated with complex diseases by integrating gene expression data with genome-wide association data (Fig. 1A). We considered 20 quantitative traits that are associated with asthma and/or cardiovascular disease (CVD) (Table 1), and found regions of the genome that are associated with inter-individual differences in gene expression levels as well as difference in quantitative-trait measurement across individuals (Fig. 1).
Figure 1.

Study overview. (A) Outline of the study design. We collected genotype, quantitative trait and RNA-seq data on the Hutterites. GWAS and eQTL studies were conducted on independent subsets of the population and then the results of these studies were integrated. (B) Boxplot of the sample sizes for the 20 GWAS conducted. Among 984 individuals with genotype data, but no RNA-seq data, quantitative-trait data were collected for between 263 and 788 individuals for each of the 20 traits. (C) Sequencing depth for the RNA-seq data generated.
Table 1.
Summary of the GWAS data sets and results
| Quantitative trait | Relevant complex disease | GWAS-sample size | GWAS-number of SNPs | GWAS-significant SNPs | GWAS-significant locus |
|---|---|---|---|---|---|
| SBP | CVD | 406 | 396 968 | – | – |
| DBP | CVD | 406 | 396 968 | – | – |
| HDL | CVD | 516 | 387 558 | – | – |
| LDL | CVD | 499 | 387 345 | – | – |
| Triglycerides | CVD | 517 | 387 374 | rs6589677, rs500254, rs11217655, rs11217695 | 11q23.3 |
| Total cholesterol/HDL | CVD | 516 | 387 558 | – | – |
| Monocyte count | CVD | 653 | 390 542 | – | – |
| LAVI | CVD | 318 | 393 258 | – | – |
| LVMI | CVD | 320 | 393 024 | – | – |
| CIMT | CVD | 263 | 391 119 | – | – |
| FeNO | Asthma | 452 | 396 731 | – | – |
| FEV1 | Asthma | 697 | 391 522 | – | – |
| FEV1/FVC | Asthma | 700 | 392 576 | – | – |
| BRI | Asthma | 571 | 393 137 | – | – |
| Total serum IgE | Asthma | 788 | 390 188 | – | – |
| Lymphocyte count | Asthma | 654 | 390 392 | – | – |
| Eosinophil count | Asthma | 650 | 391 004 | – | – |
| Neutrophil count | Asthma | 653 | 390 560 | rs12634993 | 3p12.3 |
| YKL-40 | Asthma | 715 | 391 032 | rs1794867, rs495198, rs2819346, rs2819349, rs10800812, rs10920521, rs6672643, rs2153101, rs2494282, rs4950936, rs946258, rs3820145, rs1340237, rs10128007, rs12079530, rs35068223, rs4550119, rs79707006 | 1q32.1 |
| Chitinase 1 activity | Asthma | 715 | 391 032 | rs495198, rs2486070 | 1q32.1 |
SBP, systolic blood pressure; DBP, diastolic blood pressure; HDL, high-density lipoprotein cholesterol; LDL, low-density lipoprotein cholesterol; LAVI, left atrial volume index; LVMI, left ventricular mass index; CIMT, carotid intima-media thickness; FeNO, fraction of exhaled nitric oxide; FEV1, forced expiratory volume at 1 s; FVC, forced vital capacity; BRI, bronchial responsiveness index; IgE, immunoglobulin E.
Results
GWAS for 20 quantitative traits
To identify loci associated with 20 quantitative traits that are known or potential risk factors for asthma and/or CVD, we conducted a GWAS for each of the 20 traits (Table 1 and Supplementary Material, Tables S1 and S2). These studies ranged in size from 263 to 788 subjects and included 387 345–396 968 single-nucleotide polymorphisms (SNPs; Table 1 and Fig. 1B). We analyzed the data using the Genome-wide Efficient Mixed Model Association (GEMMA) algorithm (12), which allowed us to test for genetic associations while accounting for known covariates (Supplementary Material, Table S1) and for SNP-based estimates of relatedness between individuals. Four of the 20 phenotypes we studied (triglycerides, neutrophil count, serum YKL-40 levels, Chitinase 1 activity) yielded significant associations at the genome-wide Bonferroni-corrected threshold (Table 1 and Fig. 2, Supplementary Material, Figs. S1–S16).
Figure 2.

Manhattan plots of the GWAS results for four phenotypes with genome-wide significant results. The genome-wide –log10 (P-value) of association for SNPs included in our study are shown for the four traits with significant associations at a Bonferroni-corrected P-value threshold of 0.05: (A) triglyceride levels, (B) neutrophil count, (C) YKL-40 levels and (D) Chitinase 1 activity. Points are ordered on the x-axis by their relative position in the genome. The red line denotes the Bonferroni-corrected threshold. Note that, the difference in P-value between the top SNP and nearby SNPs evident for YKL-40 and Chitinase 1 activity is the result of our pruning strategy, which filtered out highly correlated SNPs (see the ‘Materials and Methods’ section).
The strongest associations were between SNPs at the 1q32.1 locus and both YKL-40 levels and chitotriosidase (Chitinase 1) activity. The genes encoding YKL-40 (CHI3L1; Chitinase 3-like 1) and chitotriosidase (CHIT1; Chitinase 1) are adjacent to each other on chromosome 1q32.1. Our top signal with YKL-40 levels (rs2153101) is in the promoter region of CHI3L1, as was the most significant SNP (rs4950928) in our previously published GWAS for this phenotype and r2 between the two SNPs was 0.98 (8). To our knowledge, we are reporting the first GWAS of chitotriosidase activity. It was previously shown that a 24 base-pair insertion polymorphism (rs3831317) in CHIT1 gene results in the complete absence of chitotriosidase activity (13). The most significant SNP in our GWAS (rs2486070) was an intronic variant of CHIT1 that was in perfect linkage disequilibrium (LD; r2= 1) with the functional variant (rs3831317) reported previously.
In turn, the GWAS for triglyceride levels implicated variants at 11q23.3, a locus previously associated with both triglyceride levels (14,15) and CVD (16,17). However, previously identified SNPs were not in high LD with the four SNPs that passed the genome-wide significance threshold in our study and no SNPs were pruned (see the ‘Materials and Methods’ section) from the GWAS because of LD with the top SNP. Hence, it is likely that more than one variant in the 11q23.3 locus affects triglyceride levels. Finally, one SNP (rs12634993), an intronic variant of ROBO2, was associated with neutrophil counts at the genome-wide significance level. Neither this SNP nor the locus has previously been associated with neutrophil counts (18–23), indicating the necessity of further replication studies of this finding.
Mapping cis-expression quantitative trait loci
To further enrich the resources available for studying the genetic basis of disease in the Hutterites, we collected gene expression data from LCLs from a large cohort of individuals. In total, RNA-seq data from 431 adult Hutterites were included in the final data set (see the Materials and Methods section and Supplementary Materials for full details). The sample of 431 individuals is independent from the samples that were used for the GWAS reported above, a choice that reduced the power of our GWAS somewhat, but allowed us to incorporate independent functional data. On average, 32.6 million total reads were sequenced for each sample. At this sequencing depth, 13 965 genes had a median read count of at least 1 across all 431 individuals and were considered expressed in the population. Read counts were corrected for several covariates and inverse-rank transformed (see the Materials and Methods section and Supplementary Materials for specific details on quality control and batch corrections, Supplementary Material, Table S3).
In order to map putative cis-expression quantitative trait loci (eQTLs), we tested for associations between the expression level of each gene and any SNP within 1 megabase (Mb) of the transcription start site (TSS) of that gene. We classified the most significantly associated SNP as the eQTL, similar to the approaches described by others [e.g. (24,25)]. Overall, we tested 3 381 906 gene-SNP pairs (13 483 genes and 356 491 SNPs) using GEMMA (12). In order to identify genes with significant cis-eQTLs, we used a Bonferroni correction to adjust for the number of SNPs tested for each gene and then adjusted P-values for multiple testing across all genes using the Benjamini and Hochberg method (26).
To increase the power of our study to detect cis-eQTLs, we also accounted for potential confounding variables by regressing out principal components (PCs), as previously described (25,27,28). After removing the effects of 62 PCs, we identified 2311 cis-eQTL SNPs at a false discovery rate (FDR) of 0.05 (Supplementary Material, Fig. S17 and Table S4). A previous study (24) used subsampling to estimate the number of eQTLs that might be expected from sample sizes ranging from 50 to nearly 1000 individuals. Their simulations suggested that we should observe many more cis-eQTLs, given the number of subjects included in our study (up to 6000 eQTLs may be expected). However, these estimates were based on RNA-seq data collected from whole blood. As a result, SNPs affecting gene expression within a subset of cell types present in whole blood as well as SNPs affecting cell composition would be identified as eQTLs. To confirm that our results were consistent with biological expectations, we also evaluated the genomic distribution of eQTLs identified in our study. As previous eQTL studies have noted (24,29), significant eQTLs throughout the genome are clustered around the TSSs of the genes they regulate (Fig. 3).
Figure 3.
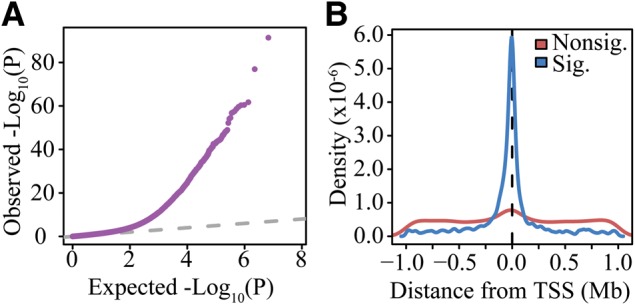
Effects of cis-eQTL SNPs in the Hutterites. (A) QQ-plot of the P-values for cis-eQTLs. (B) Distribution of eQTLs with respect to the nearest TSS. SNPs that are significant eQTLs (FDR < 0.05) tend to be very close to the TSS, unlike SNPs that are not significantly associated with expression levels.
Because the genotypes used in this study were imputed based on whole-genome sequencing of a subset of individuals in this founder population (30; see the ‘Materials and Methods’ section for more details), we were able to evaluate the extent to which genetic variation that is private to the Hutterites contributed to variation in gene expression. To determine if genetic variation was private to the Hutterites, we considered the genomic coordinates of all SNPs with a minor allele frequency (MAF) >0.05 and searched for a dbSNP ID that shared the same location (using dbSNP138). SNPs with no dbSNP record at that position were considered private. 388 501 SNPs overlapped a single dbSNP record, 3656 overlapped multiple records, and 5628 SNPs (1.41%) were private to the Hutterites. Unlike the dbSNP variants, which had a largely uniform MAF distribution, the private SNPs were skewed toward lower minor allele frequencies (49.4% had a MAF of <10% in the Hutterites, Fig. 4A). We also evaluated whether private SNPs were more or less likely to be eQTLs in this population. We did not observe an enrichment or depletion of private SNPs among cis-eQTLs—1.47% (35 of 2311) of eQTL SNPs were private—suggesting that the genetic variation specific to the Hutterite population is not unusual in its influence on gene expression levels (Fig. 4).
Figure 4.
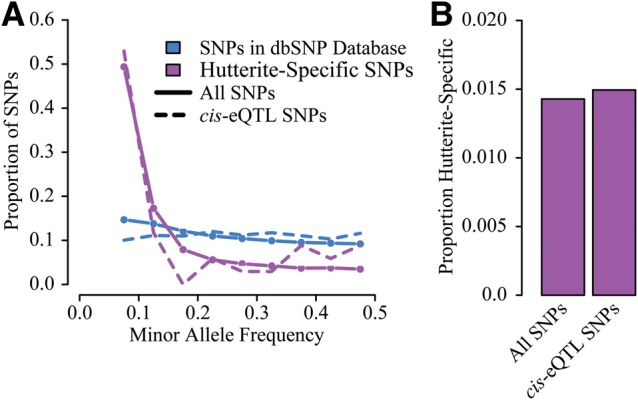
Influence of Hutterite-specific genetic variation on gene expression. (A) Distribution of minor allele frequencies for SNPs found in dbSNP compared with SNPs that are specific to the Hutterites. (B) Barplot of the proportion of all SNPs tested that are Hutterite-specific compared with the proportion of significant cis-eQTL SNPs that were Hutterite-specific.
Mapping trans-eQTLs
Genetic variation can influence gene expression either in cis (affecting allelic ratios of transcripts at a given locus) or in trans (influencing overall expression from both alleles) and so we were also interested in exploring trans signals of association. To map trans-eQTLs, we used an approach similar to our cis-eQTL strategy (see the ‘Materials and Methods’ section). Our analysis identified 2543 significant SNP-gene associations in trans (2349 different SNPs associated with 176 genes; Supplementary Material, Table S5). Trans-eQTL studies are inherently limited in their power due to the number of association tests required, meaning that many true associations are likely missed. However, we suspect that many of the associations we did observe (even at our conservative threshold) may be spurious. For example, rather than a modular architecture with SNPs affecting multiple transcripts as would be expected, SNPs that were trans-eQTLs in our study are associated with at most three downstream genes. In fact, of the 29 SNPs that were associated with three downstream transcripts, 25 are located in the human leukocyte antigen (HLA) region—suggesting that the associations may be due to mapping issues with the downstream genes arising from the complex haplotype structure of the HLA region in the reference genome. We present the trans-eQTL associations as such, but we are not confident that any individual association is indeed real. Nevertheless, as we discuss below, the pattern of trans association signals can still be helpful when considered in combination with the GWAS data.
Integration of GWAS and eQTL study
The goal of this study was ultimately to integrate the eQTL data with the GWAS data. By integrating signals (from independent samples of individuals), we aimed to find genes with significant combined evidence for a role in these quantitative traits from the eQTL study and the GWAS studies. To accomplish this, we used Sherlock, a recently developed Bayesian approach to integrate GWAS and eQTL data (31). In essence, the algorithm aims to find genes with joint support for a role in disease risk from both expression and association data by scanning the genome for concordant patterns of eQTL and GWAS association signals. This approach can potentially identify associations supported by many weak associations in trans. Applying this algorithm to our eQTL data and 20 GWAS revealed 4 traits with significant combined evidence for an association with at least one gene (Table 2). Sherlock uncovered novel genes associated with carotid intima-media thickness (CIMT), left atrial volume index (LAVI), monocyte count and YKL-40 levels (Table 2). Our GWAS for serum YKL-40 levels served as a natural control in this context. The GWAS identified a number of SNPs near CHI3L1 (the gene encoding YKL-40) as significantly associated with serum YKL-40 levels. In addition, many SNPs are significantly associated in cis with CHI3L1 expression. Reassuringly, Sherlock also flags CHI3L1 as significantly associated with YKL-40 levels based on combined evidence from the GWAS and eQTL studies (Table 2), while also identifying four other genes that may influence YKL-40 levels.
Table 2.
Genes associated with quantitative traits by joint analysis of gene expression and GWAS data
| Phenotype | Relevant disease | Genes at 20% FDR | Genes | Log10 (BF) | P-values |
|---|---|---|---|---|---|
| CIMT | CVD | 2 | TRIM14 | 11.06 | 2.15E−05 |
| KCNK10 | 10.13 | 2.49E−05 | |||
| LAVI | CVD | 4 | ZFP57 | 12.86 | 1.49E−05 |
| OVOL1 | 9.18 | 4.14E−05 | |||
| CMAH | 8.92 | 4.14E−05 | |||
| IFT88 | 8.50 | 5.13E−05 | |||
| Monocyte count | CVD | 4 | NBPF20 | 20.33 | 4.97E−05 |
| AL592284.1 | 11.95 | 1.82E−05 | |||
| ADORA2B | 9.62 | 3.48E−05 | |||
| CLLU1OS | 9.45 | 3.65E−05 | |||
| YKL-40 | Asthma | 5 | CHI3L1 | 10.85 | 2.32E−05 |
| GPR156 | 10.24 | 3.15E−05 | |||
| PLXNA2 | 8.86 | 4.14E−05 | |||
| MAATS1 | 8.74 | 4.31E−05 | |||
| HAL | 7.80 | 6.63E−05 |
BF, Bayes factor.
Discussion
In the present study, we combined gene expression with independent GWASs conducted in the same population in order to better understand the genetic basis of CVD and asthma. We identified 2311 significant cis-eQTLs, including SNPs that have not been previously observed in other populations. We employed a Bayesian framework to identify genes that were implicated in disease risk through a joint analysis of the eQTL mapping and GWAS data and we were able to uncover several novel associations between genes and disease.
There are several caveats with our study—the first being that our sample sizes were relatively small for GWAS, which were based on a median of 544 individuals. While our eQTL study is relatively large (>400 individuals), we still had limited power to map trans-eQTLs. A second caveat of our approach is that we are considering specifically the hypothesis that genetic variation affects the quantitative traits we are studying through its impact on gene expression. Although there is considerable evidence that complex traits are influenced through gene-regulation variation (5), it is still possible that coding variation underlies some associations. Our approach is not designed to detect those variants. In addition, LCLs only present a partial view of the genetic regulation of gene expression. In fact, recent work has suggested that eQTLs present in LCLs may not provide a full picture of the genetic variation relevant to human phenotypes (32). Certainly, studies examining eQTLs in other tissues may provide a complementary view of trait-related genetic variation. Another potential issue concerns the proper determination of P-values for our integrated tests. The Sherlock program requires permuted GWAS results in order to properly determine P-values. We chose to permute genotypes to generate these null distributions. Others have shown that permuting genotypes in the context of the population structure can potentially lead to anti-conservative tests of significance (33). To evaluate this possibility we calculated the genomic inflation factor of each integrated test. We found no evidence of inflated P-values (Supplementary Material, Table S6, Figs. S18–S37). The median genomic inflation factor was 1.03. These caveats notwithstanding, we were able to identify several novel links to genetic variation influencing these quantitative traits using our integrated approach.
Overall, our study presents several novel candidate genes relevant to asthma and CVD that warrant further functional characterization. Two compelling cases involve the genes associated with CIMT by Sherlock (Fig. 5). TRIM14 is a key component of retinoic acid-inducible gene 1-mediated innate immune responses (34), a pathway that has previously been implicated in atherosclerosis (35). Furthermore, others have previously noted that a SNP associated with coronary heart disease, rs4743150, is also an eQTL SNP for TRIM14 (36). Likewise, KCNK10 has been previously implicated in processes relevant to the carotid artery. In particular, it has been suggested that KCNK10 may play a role in response to hypoxia in the carotid artery (37), a process linked to atherosclerosis (38).
Figure 5.
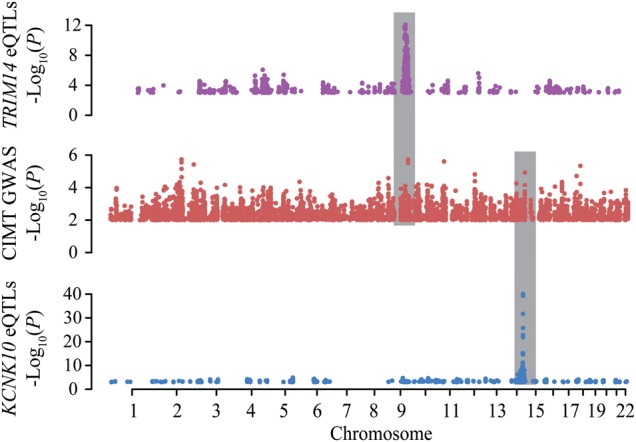
Example of signals identified by Sherlock. Manhattan plots showing the –log10 (P-value) for each SNP arranged by genomic coordinates. Plot shows coordinated signals for the GWAS of CIMT (middle panel), the eQTL signals genome- wide for KCNK10 (bottom panel) and the eQTL signals genome wide for TRIM14 (top panel). Gray bars highlight the regions of interest identified by Sherlock. eQTL panels show all SNPs with P-value <0.001. GWAS panel shows all SNPs with P-value <0.01.
Our integrative analysis also implicated several genes that may be relevant to LAVI. For example, two zinc finger transcription factors (TFs), ZFP57 and OVOL1, are highlighted by our analysis. OVOL1 (Supplementary Material, Fig. S38) is noteworthy because it plays a role in regulating the epithelial to mesenchymal transition (39), a process required for proper heart development (40). Furthermore, IFT88 is associated with LAVI in our study and has been shown to be involved in Sonic Hedgehog signaling in the developing heart in mice (41). Less clear is the role for CMAH, a gene with a human-specific truncating mutation that is up-regulated in human stem cells (42).
The results for monocyte count highlight both genes of uncertain significance and plausible candidate genes. On the one hand, several uncharacterized genes are implicated, including two genes in a highly repetitive region of the genome (NBPF20 and AL592284.1) and one gene expressed on the opposite strand of a leukemia-associated gene (41; CLLU1OS). On the other hand, ADORA2B (Supplementary Material, Fig. S39) expression has been shown to influence the levels of alternatively activated macrophages (43), which can themselves influence the distribution of monocytes in response to infection (44).
Finally, Sherlock uncovered several genes that may further modify YKL-40 levels, a quantitative trait associated with both asthma and CVD (8,45). Many of these genes are not well-characterized and so provide novel avenues for future studies to understand the regulation of this gene and possibly the development of asthma and CVD. For instance, MAATS1 (Supplementary Material, Fig. S40) is a relatively unstudied gene known to bind a Myc proto-oncogene (MYC) co-activator (46). Interestingly, at least one group has suggested that CHI3L1 may be regulated directly by MYC (47).
These results collectively show that the power of GWASs can be improved by integrating association signals with functional studies such as eQTL mapping. Ultimately, studies such as this hope to uncover novel insights into the mechanistic etiology of complex disease. Given that most genetic variants associated with complex traits appear to influence gene regulation, we have used a model cell type (LCLs) to identify patterns of association between genetic variants and gene expression that are consistent with patterns of genome-wide association for 20 quantitative traits. Nonetheless, nearly half of cis-eQTLs appear to be cell type-specific (48), and so future studies using similar approaches will further benefit from mapping eQTLs in multiple primary tissues or in differentiated cell cultures derived from pluripotent stem cells. We believe that the current results support continued research in this direction.
Materials and Methods
Physiological phenotypes
This study presents the results for GWASs of 20 different physiological phenotypes. Full descriptions of each phenotype are available in the Supplementary Materials. The exclusion criteria for each phenotype (e.g. the use of certain medications that may affect our measurements) are also available as a part of the Supplementary Material, as are the specific transformations for each data type and the covariates included in each GWAS.
Genotypes
In total, 1415 individuals were genotyped using one of three Affymetrix genotyping chips—the 500k, 5.0 or 6.0 arrays. Subsequently, samples from 98 of these individuals were subjected to whole-genome sequencing (WGS). The WGS data were then used to impute variants in all the other genotyped individuals with an approach that combines pedigree and LD imputation and has an accuracy of 99.9% (30). SNPs imputed in this way were first limited to those with a MAF of at least 0.05 and then pruned by considering 100 kb windows and only retaining the SNP with the highest call rate for sets of SNPs in each window with an r2 > 0.99, resulting in a data set of 405 328 SNPs.
Cell culture
For the gene expression study, LCLs were derived from blood samples taken from the Hutterites. Ninety-five of these samples were previously described (10), though for the current study we collected new data from these samples as well. LCLs were incubated at 37°C and 5% CO2 in the Roswell Park Memorial Institute medium 1640 supplemented with l-glutamine, 50 mg/ml gentamicin and 20% fetal bovine serum. RNA was extracted from each cell line using the RNeasy Mini Kit (Qiagen, Germantown, MD, USA). The Agilent Bioanalyzer (Agilent Technologies, Santa Clara, CA, USA) was used to assess the quality and concentration of the RNA (Supplementary Material, Fig. S41).
RNA-sequencing
RNA-seq libraries were created using the TruSeq Library Kit (Illumina, San Diego, CA, USA). Pools of 12 indexed samples were sequenced on two lanes of an Illumina HiSeq 2000 (50 bp single-end reads). Libraries were evaluated for quality by several measures (see Supplementary Material). Gene expression estimates were generated by counting reads overlapping exons, correcting for GC-content bias of the sequenced libraries using the EDAseq package in R (49), and then summing GC-corrected read counts for all exons of each gene. Gene counts were then converted to the ‘reads per kilobase per million mapped reads’ metric (‘RPKM’) and inverse-rank transformed within individuals to a standard normal distribution. The normalized expression estimates of each gene across all individuals were also inverse-rank transformed to a standard normal distribution. Finally, we regressed out the effects of several covariates from these expression estimates. More details on all steps of the RNA-seq pipeline are provided in the Supplementary Material.
Statistical analyses
Genome-wide association studies
GWAS for each physiological quantitative trait was performed using GEMMA (12). In each case, subjects with genotype and phenotype data, but no RNA-seq data were included in the analysis (see Table 1 and Supplementary Material, Table S2 for sample size of each GWAS). Among 405 328 SNPs in the imputed data set, SNPs with call rates <95% and MAF <0.05 among subjects of each GWAS were further excluded (see Table 1 for the number of SNPs included in each GWAS). Associations between genotype and phenotype were tested using a likelihood-ratio test while accounting for known covariates of each phenotype (see Supplementary Material, Table S1) and SNP-based relatedness between individuals. Significance of phenotype–genotype association was assessed using a Bonferroni threshold at α = 0.05.
cis-eQTL mapping
In order to map putative cis-eQTLs, we tested for associations between the expression level of each gene and any SNP within 1 Mb of the TSS of that gene. Of the 405 328 SNPs in our study, 397 785 retained a MAF of >0.05 in the 431 individuals included in the RNA-seq study. To define the TSS, we chose the most active TSS for each gene based on ‘cap analysis gene expression sequencing’ (CAGE-seq) data collected from an International HapMap Project LCL by the ENCODE consortium (50,51). If multiple TSSs were inferred to be equally active, we defined the TSS as the midpoint of the set of most active TSSs. For each gene, we tested associations with the set of cis-SNPs using GEMMA (12), so that we could account for relatedness by including a kinship matrix as a random effect in the mixed model, and chose the most significantly associated SNP. The significance level of gene-SNP association was Bonferroni-adjusted [similar to the ‘Materials and Methods’ section described in (24,25,52)] and then corrected for testing multiple genes using the Benjamini and Hochberg method (26). It has been shown that regressing out PCs can greatly increase the power to detect cis-eQTLs (27), and so we evaluated the number of eQTLs identified after regressing out between 0 and 100 PCs. We found that removing the effects of 62 components resulted in the identification of 2311 cis-eQTL SNPs (Supplementary Material, Fig. S17).
trans-eQTL mapping
To map trans-eQTLs, we tested for associations between each gene and any SNP that was >1 Mb from the TSS. P-values were then Bonferroni corrected. As with cis-eQTL mapping, we considered the effect of regressing out PCs on trans-eQTL discovery. The value of regressing out PCs in the context of trans-eQTLs is less clear than with cis-eQTLs, as trans-eQTLs can influence the expression of many downstream genes and therefore may be driving the very signals that principle components capture. In addition, we expected to identify fewer associations with smaller effect sizes (24). Thus, we did not consider the total number of associations identified in order to evaluate the effect of PC-regression on the power of our study. Instead, we considered a list of 131 TFs and their empirically determined target genes (53) and maximized the number of significant TF-target associations observed (at a Bonferroni-corrected P-value threshold of 0.05). Using this metric, we found that removing any PCs reduced the correlation between TFs and their known targets (Supplementary Material, Fig. S42). Therefore, we tested for trans effects without removing any PCs. All trans-eQTL association P-values were corrected for testing multiple genes using the Benjamini and Hochberg method (26).
Integration of GWAS and eQTL results with Sherlock
To integrate the GWAS and eQTL results (particularly in trans), we used the Sherlock algorithm (31). Sherlock uses a Bayesian framework to identify genes that are jointly implicated in disease risk by eQTL data and GWAS data. For each GWAS, we used the association P-value for all SNPs with a MAF of >0.05 as input. For the eQTL data, we used the trans association P-values. As with eQTL mapping, we defined all SNPs within 1 Mb of the TSS of a gene as acting in cis and all others were categorized as trans. We subsequently filtered out all cis SNP association tests with an unadjusted P-value of >1.0 × 10⁻³ and all trans association tests with an unadjusted P-value of >1 × 10⁻⁵. The remaining P-values were used as input for the Sherlock program. To calculate integrated P-values, Sherlock requires a set of permuted GWAS P-values. We, therefore, ran 50 permutations of the total serum IgE level GWAS (our largest GWAS) by permuting the columns of the genotype matrix, running GEMMA and recording the results for all SNPs. For all traits, we used the same set of permutations. One concern in integrating results from the two studies (a GWAS and the eQTL study) is that if relatedness between individuals from the two studies is abnormally high relative to the degree of relatedness observed within each study it might not be properly accounted for in the mixed models used in each of the studies. We, therefore, examined the distribution of kinship coefficients both within and between the studies. We found that the distribution of relatedness both within and between studies was very similar (Supplementary Material, Table S7 and Fig. S43). Further supporting our modeling of the data, we calculated the genomic inflation factor for the Sherlock results of each phenotype and did not find any evidence of inflated P-values (Supplementary Material, Table S6 and Figs. S18–S37).
Supplementary Material
Funding
This study was supported by NIH grants R01 HL085197 to C.O. and HL092206 to Y.G.; D.A.C. was supported by NIH grant T32 GM007197. The heart phenotyping studies were supported by an American Society of Echocardiography Career Development Award to S.J.S. and an American Society of Echocardiography Echo Investigator Award to J.M.D. Measurements of Chitinase activity and YKL-40 levels were supported by NIH grants R01 HL108638, R01 HL093017, U01 HL108638 and R01 HL115813 to J.A.E., R01 HL118346 to G.L.C. and UH2 HL123876 to J.A.E. and G.L.C. Funding to pay Open Access charges was provided by NIH grant R01 HL085197 to C.O.
Supplementary Material
Acknowledgements
We thank G. Du, O. Livne, J. Chong, J. Blischak, B. van de Geijn, K. Igartua, R. Anderson and C. Herman for help in processing data.
Conflict of Interest statement. None declared.
References
- 1.Visscher P.M., Brown M.A., McCarthy M.I., Yang J. (2012) Five years of GWAS discovery. Am. J. Hum. Genet., 90, 7–24. [DOI] [PMC free article] [PubMed] [Google Scholar]
- 2.Wood A.R., Esko T., Yang J., Vedantam S., Pers T.H., Gustafsson S., Chu A.Y., Estrada K., Luan J., Kutalik Z. et al. (2014) Defining the role of common variation in the genomic and biological architecture of adult human height. Nat. Genet., 46, 1173–1186. [DOI] [PMC free article] [PubMed] [Google Scholar]
- 3.Torgerson D.G., Ampleford E.J., Chiu G.Y., Gauderman W.J., Gignoux C.R., Graves P.E., Himes B.E., Levin A.M., Mathias R.A., Hancock D.B. et al. (2011) Meta-analysis of genome-wide association studies of asthma in ethnically diverse North American populations. Nat. Genet., 43, 887–892. [DOI] [PMC free article] [PubMed] [Google Scholar]
- 4.Teslovich T.M., Musunuru K., Smith A.V., Edmondson A.C., Stylianou I.M., Koseki M., Pirruccello J.P., Ripatti S., Chasman D.I., Willer C.J. et al. (2010) Biological, clinical and population relevance of 95 loci for blood lipids. Nature, 466, 707–713. [DOI] [PMC free article] [PubMed] [Google Scholar]
- 5.Pickrell J.K. (2014) Joint analysis of functional genomic data and genome-wide association studies of 18 human traits. Am. J. Hum. Genet., 94, 559–573. [DOI] [PMC free article] [PubMed] [Google Scholar]
- 6.Ober C., Tsalenko A., Parry R., Cox N.J. (2000) A second-generation genomewide screen for asthma-susceptibility alleles in a founder population. Am. J. Hum. Genet., 67, 1154–1162. [DOI] [PMC free article] [PubMed] [Google Scholar]
- 7.Weiss L., Pan L., Abney M., Ober C. (2006) The sex-specific genetic architecture of quantitative traits in humans. Nat. Genet., 38, 218–222. [DOI] [PubMed] [Google Scholar]
- 8.Ober C., Tan Z., Sun Y., Possick J.D., Pan L., Nicolae R., Radford S., Parry R.R., Heinzmann A., Deichmann K.A. et al. (2008) Effect of Variation in CHI3L1 on Serum YKL-40 Level, Risk of Asthma, and Lung Function. N. Engl. J. Med., 358, 1682–1691. [DOI] [PMC free article] [PubMed] [Google Scholar]
- 9.Ober C., Nord A.S., Thompson E.E., Pan L., Tan Z., Cusanovich D., Sun Y., Nicolae R., Edelstein C., Schneider D.H. et al. (2009) Genome-wide association study of plasma lipoprotein(a) levels identifies multiple genes on chromosome 6q. J. Lipid Res., 50, 798–806. [DOI] [PMC free article] [PubMed] [Google Scholar]
- 10.Cusanovich D.A., Billstrand C., Zhou X., Chavarria C., De Leon S., Michelini K., Pai A.A., Ober C., Gilad Y. (2012) The combination of a genome-wide association study of lymphocyte count and analysis of gene expression data reveals novel asthma candidate genes. Hum. Mol. Genet., 21, 2111–2123. [DOI] [PMC free article] [PubMed] [Google Scholar]
- 11.Yao T.-C., Du G., Han L., Sun Y., Hu D., Yang J.J., Mathias R., Roth L.A., Rafaels N., Thompson E.E. et al. (2014) Genome-wide association study of lung function phenotypes in a founder population. J. Allergy Clin. Immunol., 133, 248–255.e10. [DOI] [PMC free article] [PubMed] [Google Scholar]
- 12.Zhou X., Stephens M. (2012) Genome-wide efficient mixed-model analysis for association studies. Nat. Genet., 44, 821–824. [DOI] [PMC free article] [PubMed] [Google Scholar]
- 13.Boot R.G., Renkema G.H., Verhoek M., Strijland A., Bliek J., de Meulemeester T.M., Mannens M.M., Aerts J.M. (1998) The human chitotriosidase gene. Nature of inherited enzyme deficiency. J. Biol. Chem., 273, 25680–25685. [DOI] [PubMed] [Google Scholar]
- 14.Willer C.J., Schmidt E.M., Sengupta S., Peloso G.M., Gustafsson S., Kanoni S., Ganna A., Chen J., Buchkovich M.L., Mora S. et al. (2013) Discovery and refinement of loci associated with lipid levels. Nat. Genet., 45, 1274–1283. [DOI] [PMC free article] [PubMed] [Google Scholar]
- 15.Coram M.A., Duan Q., Hoffmann T.J., Thornton T., Knowles J.W., Johnson N.A., Ochs-Balcom H.M., Donlon T.A., Martin L.W., Eaton C.B. et al. (2013) Genome-wide characterization of shared and distinct genetic components that influence blood lipid levels in ethnically diverse human populations. Am. J. Hum. Genet., 92, 904–916. [DOI] [PMC free article] [PubMed] [Google Scholar]
- 16.Arning A., Hiersche M., Witten A., Kurlemann G., Kurnik K., Manner D., Stoll M., Nowak-Göttl U. (2012) A genome-wide association study identifies a gene network of ADAMTS genes in the predisposition to pediatric stroke. Blood, 120, 5231–5236. [DOI] [PubMed] [Google Scholar]
- 17.Middelberg R.P.S., Ferreira M.A.R., Henders A.K., Heath A.C., Madden P.A.F., Montgomery G.W., Martin N.G., Whitfield J.B. (2011) Genetic variants in LPL, OASL and TOMM40/APOE-C1-C2-C4 genes are associated with multiple cardiovascular-related traits. BMC Med. Genet., 12, 123. [DOI] [PMC free article] [PubMed] [Google Scholar]
- 18.Lo K.S., Wilson J.G., Lange L.A., Folsom A.R., Galarneau G., Ganesh S.K., Grant S.F.A., Keating B.J., McCarroll S.A., Mohler E.R. et al. (2011) Genetic association analysis highlights new loci that modulate hematological trait variation in Caucasians and African Americans. Hum. Genet., 129, 307–317. [DOI] [PMC free article] [PubMed] [Google Scholar]
- 19.Ramsuran V., Kulkarni H., He W., Mlisana K., Wright E.J., Werner L., Castiblanco J., Dhanda R., Le T., Dolan M.J. et al. (2011) Duffy-null-associated low neutrophil counts influence HIV-1 susceptibility in high-risk South African black women. Clin. Infect. Dis., 52, 1248–1256. [DOI] [PMC free article] [PubMed] [Google Scholar]
- 20.Okada Y., Kamatani Y., Takahashi A., Matsuda K., Hosono N., Ohmiya H., Daigo Y., Yamamoto K., Kubo M., Nakamura Y. et al. (2010) Common variations in PSMD3-CSF3 and PLCB4 are associated with neutrophil count. Hum. Mol. Genet., 19, 2079–2085. [DOI] [PubMed] [Google Scholar]
- 21.Okada Y., Hirota T., Kamatani Y., Takahashi A., Ohmiya H., Kumasaka N., Higasa K., Yamaguchi-Kabata Y., Hosono N., Nalls M.A. et al. (2011) Identification of nine novel loci associated with white blood cell subtypes in a Japanese population. PLoS Genet., 7, e1002067. [DOI] [PMC free article] [PubMed] [Google Scholar]
- 22.Reiner A.P., Lettre G., Nalls M.A., Ganesh S.K., Mathias R., Austin M.A., Dean E., Arepalli S., Britton A., Chen Z. et al. (2011) Genome-wide association study of white blood cell count in 16,388 African Americans: the continental origins and genetic epidemiology network (COGENT). PLoS Genet., 7, e1002108. [DOI] [PMC free article] [PubMed] [Google Scholar]
- 23.Nalls M.A., Couper D.J., Tanaka T., van Rooij F.J.A., Chen M.-H., Smith A.V., Toniolo D., Zakai N.A., Yang Q., Greinacher A. et al. (2011) Multiple loci are associated with white blood cell phenotypes. PLoS Genet., 7, e1002113. [DOI] [PMC free article] [PubMed] [Google Scholar]
- 24.Battle A., Mostafavi S., Zhu X., Potash J.B., Weissman M.M., McCormick C., Haudenschild C.D., Beckman K.B., Shi J., Mei R. et al. (2014) Characterizing the genetic basis of transcriptome diversity through RNA-sequencing of 922 individuals. Genome Res., 24, 14–24. [DOI] [PMC free article] [PubMed] [Google Scholar]
- 25.Flutre T., Wen X., Pritchard J., Stephens M. (2013) A statistical framework for joint eQTL analysis in multiple tissues. PLoS Genet., 9, e1003486. [DOI] [PMC free article] [PubMed] [Google Scholar]
- 26.Benjamini Y., Hochberg Y. (1995) Controlling the false discovery rate: a practical and powerful approach to multiple testing. J. R. Stat. Soc. Ser. B, 57, 289–300. [Google Scholar]
- 27.Pickrell J.K., Marioni J.C., Pai A.A., Degner J.F., Engelhardt B.E., Nkadori E., Veyrieras J.-B., Stephens M., Gilad Y., Pritchard J.K. (2010) Understanding mechanisms underlying human gene expression variation with RNA sequencing. Nature, 464, 768–772. [DOI] [PMC free article] [PubMed] [Google Scholar]
- 28.Degner J.F., Pai A.A., Pique-Regi R., Veyrieras J.-B., Gaffney D.J., Pickrell J.K., De Leon S., Michelini K., Lewellen N., Crawford G.E. et al. (2012) DNase I sensitivity QTLs are a major determinant of human expression variation. Nature, 482, 390–394. [DOI] [PMC free article] [PubMed] [Google Scholar]
- 29.Veyrieras J.-B., Gaffney D.J., Pickrell J.K., Gilad Y., Stephens M., Pritchard J.K. (2012) Exon-specific QTLs skew the inferred distribution of expression QTLs detected using gene expression array data. PLoS One, 7, e30629. [DOI] [PMC free article] [PubMed] [Google Scholar]
- 30.Livne O.E., Han L., Alkorta-Aranburu G., Wentworth-Sheilds W., Abney M., Ober C., Nicolae D.L. (2015) PRIMAL: fast and accurate pedigree-based imputation from sequence data in a founder population. PLoS Comput. Biol., 11, e1004139. [DOI] [PMC free article] [PubMed] [Google Scholar]
- 31.He X., Fuller C.K., Song Y., Meng Q., Zhang B., Yang X., Li H. (2013) Sherlock: detecting gene-disease associations by matching patterns of expression QTL and GWAS. Am. J. Hum. Genet., 92, 667–680. [DOI] [PMC free article] [PubMed] [Google Scholar]
- 32.Lee M.N., Ye C., Villani A.-C., Raj T., Li W., Eisenhaure T.M., Imboywa S.H., Chipendo P.I., Ran F.A., Slowikowski K. et al. (2014) Common genetic variants modulate pathogen-sensing responses in human dendritic cells. Science, 343, 1246980. [DOI] [PMC free article] [PubMed] [Google Scholar]
- 33.Abney M. (2015) Permutation testing in the presence of polygenic variation. Genet. Epidemiol., 39, 249–258. [DOI] [PMC free article] [PubMed] [Google Scholar]
- 34.Zhou Z., Jia X., Xue Q., Dou Z., Ma Y., Zhao Z., Jiang Z., He B., Jin Q., Wang J. (2014) TRIM14 is a mitochondrial adaptor that facilitates retinoic acid-inducible gene-I-like receptor-mediated innate immune response. Proc. Natl Acad. Sci. USA, 111, E245–E254. [DOI] [PMC free article] [PubMed] [Google Scholar]
- 35.Wang F., Xia W., Liu F., Li J., Wang G., Gu J. (2012) Interferon regulator factor 1/retinoic inducible gene I (IRF1/RIG-I) axis mediates 25-hydroxycholesterol-induced interleukin-8 production in atherosclerosis. Cardiovasc. Res., 93, 190–199. [DOI] [PubMed] [Google Scholar]
- 36.Yang X. (2012) Use of functional genomics to identify candidate genes underlying human genetic association studies of vascular diseases. Arterioscler. Thromb. Vasc. Biol., 32, 216–222. [DOI] [PubMed] [Google Scholar]
- 37.Kréneisz O., Benoit J.P., Bayliss D.A., Mulkey D.K. (2009) AMP-activated protein kinase inhibits TREK channels. J. Physiol., 587, 5819–5830. [DOI] [PMC free article] [PubMed] [Google Scholar]
- 38.Hultén L.M., Levin M. (2009) The role of hypoxia in atherosclerosis. Curr. Opin. Lipidol., 20, 409–414. [DOI] [PubMed] [Google Scholar]
- 39.Roca H., Hernandez J., Weidner S., McEachin R.C., Fuller D., Sud S., Schumann T., Wilkinson J.E., Zaslavsky A., Li H. et al. (2013) Transcription factors OVOL1 and OVOL2 induce the mesenchymal to epithelial transition in human cancer. PLoS One, 8, e76773. [DOI] [PMC free article] [PubMed] [Google Scholar]
- 40.Thiery J.P., Acloque H., Huang R.Y.J., Nieto M.A. (2009) Epithelial-mesenchymal transitions in development and disease. Cell, 139, 871–890. [DOI] [PubMed] [Google Scholar]
- 41.Willaredt M.A., Gorgas K., Gardner H.A.R., Tucker K.L. (2012) Multiple essential roles for primary cilia in heart development. Cilia, 1, 23. [DOI] [PMC free article] [PubMed] [Google Scholar]
- 42.Nystedt J., Anderson H., Hirvonen T., Impola U., Jaatinen T., Heiskanen A., Blomqvist M., Satomaa T., Natunen J., Saarinen J. et al. (2010) Human CMP-N-acetylneuraminic acid hydroxylase is a novel stem cell marker linked to stem cell-specific mechanisms. Stem Cells, 28, 258–267. [DOI] [PubMed] [Google Scholar]
- 43.Karmouty-Quintana H., Philip K., Acero L.F., Chen N.-Y., Weng T., Molina J.G., Luo F., Davies J., Le N.-B., Bunge I. et al. (2015) Deletion of ADORA2B from myeloid cells dampens lung fibrosis and pulmonary hypertension. FASEB J., 29, 50–60. [DOI] [PMC free article] [PubMed] [Google Scholar]
- 44.Jenkins S.J., Ruckerl D., Cook P.C., Jones L.H., Finkelman F.D., van Rooijen N., MacDonald A.S., Allen J.E. (2011) Local macrophage proliferation, rather than recruitment from the blood, is a signature of TH2 inflammation. Science, 332, 1284–1288. [DOI] [PMC free article] [PubMed] [Google Scholar]
- 45.Kastrup J., Johansen J.S., Winkel P., Hansen J.F., Hildebrandt P., Jensen G.B., Jespersen C.M., Kjøller E., Kolmos H.J., Lind I. et al. (2009) High serum YKL-40 concentration is associated with cardiovascular and all-cause mortality in patients with stable coronary artery disease. Eur. Heart J., 30, 1066–1072. [DOI] [PubMed] [Google Scholar]
- 46.Yukitake H., Furusawa M., Taira T., Iguchi-Ariga S.M.M., Ariga H. (2002) AAT-1, a novel testis-specific AMY-1-binding protein, forms a quaternary complex with AMY-1, A-kinase anchor protein 84, and a regulatory subunit of cAMP-dependent protein kinase and is phosphorylated by its kinase. J. Biol. Chem., 277, 45480–45492. [DOI] [PubMed] [Google Scholar]
- 47.Zhao X., Tang R., Gao B., Shi Y., Zhou J., Guo S., Zhang J., Wang Y., Tang W., Meng J. et al. (2007) Functional variants in the promoter region of Chitinase 3-like 1 (CHI3L1) and susceptibility to schizophrenia. Am. J. Hum. Genet., 80, 12–18. [DOI] [PMC free article] [PubMed] [Google Scholar]
- 48.Ardlie K.G., Deluca D.S., Segre A.V., Sullivan T.J., Young T.R., Gelfand E.T., Trowbridge C.A., Maller J.B., Tukiainen T., Lek M. et al. (2015) The genotype-tissue expression (GTEx) pilot analysis: multitissue gene regulation in humans. Science, 348, 648–660. [DOI] [PMC free article] [PubMed] [Google Scholar]
- 49.Risso D., Schwartz K., Sherlock G., Dudoit S. (2011) GC-content normalization for RNA-seq data. BMC Bioinform., 12, 480. [DOI] [PMC free article] [PubMed] [Google Scholar]
- 50.Djebali S., Davis C.A., Merkel A., Dobin A., Lassmann T., Mortazavi A., Tanzer A., Lagarde J., Lin W., Schlesinger F. et al. (2012) Landscape of transcription in human cells. Nature, 489, 101–108. [DOI] [PMC free article] [PubMed] [Google Scholar]
- 51.The ENCODE Project Consortium (2012) An integrated encyclopedia of DNA elements in the human genome. Nature, 489, 57–74. [DOI] [PMC free article] [PubMed] [Google Scholar]
- 52.Mostafavi S., Battle A., Zhu X., Urban A.E., Levinson D., Montgomery S.B., Koller D. (2013) Normalizing RNA-sequencing data by modeling hidden covariates with prior knowledge. PLoS One, 8, e68141. [DOI] [PMC free article] [PubMed] [Google Scholar]
- 53.Cusanovich D.A., Pavlovic B., Pritchard J.K., Gilad Y. (2014) The functional consequences of variation in transcription factor binding. PLoS Genet., 10, e1004226. [DOI] [PMC free article] [PubMed] [Google Scholar]
- 54.Buhl A.M., Jurlander J., Jørgensen F.S., Ottesen A.M., Cowland J.B., Gjerdrum L.M., Hansen B.V., Leffers H. (2006) Identification of a gene on chromosome 12q22 uniquely overexpressed in chronic lymphocytic leukemia. Blood, 107, 2904–2911. [DOI] [PubMed] [Google Scholar]
Associated Data
This section collects any data citations, data availability statements, or supplementary materials included in this article.