Abstract
5-Hydroxytryptamine (5-HT) produced by enterochromaffin (EC) cells is an important enteric mucosal signaling ligand and has been implicated in several gastrointestinal diseases, including inflammatory bowel disease and functional disorders such as irritable bowel syndrome. The present study reports a new, simple and rapid visualization method of 5-HT-producing EC cells utilizing detection of fluorescence in paraffin-embedded tissue sections after formalin fixation. In human samples, there was a high incidence of fluorescence+ cells in the 5-HT+ cells in the pyloric, small intestinal and colonic glands, while co-localization was lacking between fluorescence+ and gastrin+ cells in the pyloric and small intestinal glands. Fluorescence+ EC cells were detected in the colon of mice and rats. Fluorescence+ cells were also observed in 5-HT+ β cells in the pancreatic islets of Langerhans in pregnant mice, while non-pregnant mouse pancreatic islet cells showed no 5-HT immunoreactivity or fluorescence. These results suggest that fluorescence+ cells are identical to 5-HT+ cells, and the source of fluorescence may be 5-HT itself or molecules related to its synthesis or degradation. This fluorescence signal detection method may be applicable for monitoring of inflammatory status of inflammatory bowel diseases in both the experimental and clinical settings.
Key words: 5-Hydroxytryptamine, enterochromaffin cells, fluorescence, paraffin-embedded tissue sections, formalin fixation
Introduction
There are a variety of different types of enteroendocrine cell, each of which synthesizes different types of hormones, and some of them contain multiple hormones within one cell.1,2 Enteroendocrine cells distributed diffusely throughout the gastrointestinal tract collectively constitute the neuroendocrine tissue of the tract. Enterochromaffin (EC) cells are enteroendocrine cells providing up to 95% of total body 5-hydroxytryptamine (5-HT, serotonin).3 Gastrointestinal-tract-derived 5-HT has diverse neuroendocrine roles in blood clotting, liver regeneration, bone formation, and embryo development,4-6 and 5-HT secretion in pancreatic β cells is increased during gestation to control glucose homeostasis for prevention of gestational diabetes.7 5-HT secreted by EC cells also plays multiple paracrine roles in the gastrointestinal tract by modulating peristaltic and secretory reflexes, as well as by activating extrinsic sensory nerves.3,8,9 It is also known that 5-HT secretion is increased in inflammatory bowel diseases such as Crohn’s disease10 and experimental models of colitis.11 It is also reported that 5-HT availability is a negative effector of the severity of inflammation in rodent models of inflammatory bowel diseases.12-14
The original Falck-Hillarp method involves the exposure of freeze-dried tissue to formaldehyde vapor, allowing dopamine and noradrenaline to be converted to isoquinoline molecules that emit a yellow-green autofluorescence.15,16 By this treatment, catecholamines and 5-HT can form intensely fluorescent compounds in freeze-dried specimens, avoiding any dislocation of fluorescent signals that can be identified by observation under the fluorescence microscope. Later modification by Lindvall and Björklund,17 notably the glyoxylic acid method, where the fluorophore formation is carried out in an autocatalyzed reaction in aqueous solution, provided improved sensitivity and precision.
In the present study, we report a new visualization method of 5-HT-producing cells utilizing detection of fluorescence in paraffin-embedded tissue sections after formalin fixation. By this method, EC cells of the gastrointestinal tract can easily be detected in humans, rats and mice, and therefore, it may be applicable for monitoring of inflammatory status of inflammatory bowel diseases.
Materials and Methods
Tissue samples
We used formalin-fixed, paraffin-embedded, normal human gastric tissue (pyloric glands) array sections (US Biomax Inc., Rockville, MD, USA), normal human small intestine tissue array sections (US Biomax), normal human colon tissue array sections (US Biomax), Sprague-Dawley rat colon tissue sections (GeneticLab Co. Ltd., Sapporo, Japan), ICR mouse colon tissue sections (GeneticLab), C57BL/6J normal mice pancreatic tissue sections and those of pregnant mice at gestation day 12 (GeneticLab), and heart and liver sections of a aged common squirrel monkey (Laboratory of Veterinary Pathology, Tokyo University of Agriculture and Technology). We also used acetone-fixed cryosections of human colonic tissues (US Biomax) for comparison.
Tissue section preparation and fluorescence detection
Tissue slides were immersed in xylene for 10 min, and then in 100% ethanol, 95% ethanol, 70% ethanol, and water each for 5 min. After air-drying for 10 min, microscopic observation was performed with a fluorescence microscope (BX63; Olympus Corp., Tokyo, Japan) either with ultraviolet filter (Olympus Corp.; excitation 340-390 nm, photography 420-700 nm), blue filter (Olympus Corp.; excitation 460-495 nm, photography 510-700 nm), green filter (Olympus Corp.; excitation 530-550 nm, photography 570-700 nm), and microphotographs were taken with a DP73 CCD camera (Olympus Corp.). After rinsing the slides for 5 min in water, immunostaining or hematoxylin and eosin (HE) staining was carried out.
In the heart and liver tissues of a common squirrel monkey, serially cut sections were either subjected to autofluorescence detection, HE staining or periodic acid-Schiff (PAS) staining.
Detection of fluorescence was similarly performed in acetone-fixed cryosections of human colonic tissues. Serially cut sections were either subjected to fluorescence detection or hematoxylin staining.
Measurement of fluorescence hyperspectrum in tissue sections
Fluorescence hyperspectrum in tissue section was measured using hyperspectral camera (NH-7; EBA Japan, Tokyo, Japan) connected with a fluorescence microscope (BX63; Olympus corp.).
Immunohistochemistry
For immunohistochemistry, sections were pretreated with peroxidase-blocking solution (Dako, Glostrup, Denmark) for 5 min at room temperature to quench endogenous peroxidase. After several rinses in 1× phosphate-buffered saline (PBS; pH 7.4), tissue sections were incubated with 10 mM citrate buffer, pH 6.0, at 95°C for 20 min for antigen retrieval. After several rinses in PBS, the sections were blocked with 5% horse serum in PBS for 30 min at room temperature to eliminate non-specific antibody binding. The sections were then incubated at room temperature with rabbit anti-5-HT antibody (Nichirei Biosciences Inc., Tokyo, Japan; ready-to-use) for 60 min, monoclonal anti-human 5-HT antibody (Dako; 1:50 dilution) for 30 min, monoclonal anti-human chromogranin A (CGA) antibody (Dako; 1:100 dilution) for 30 min, or rabbit anti-human gastrin antibody (Dako; ready-to-use) for 20 min. After several rinses in PBS, the sections were incubated with the second antibody: goat anti-mouse or anti-rabbit immunoglobulins conjugated to horseradish-peroxidase-labeled polymer (EnVision™ + Dual Link System-HRP; Dako) for 30 min at room temperature. After several rinses in PBS, immunodetection was carried out using Histofine DAB Substrate Kit (Nichirei Biosciences) as the chromogen. Sections were then counterstained using Mayer’s hematoxylin solution (Wako Pure Chemical Industries Ltd., Osaka, Japan).
Distribution of fluorescence+ and immunolocalized cells
In each of the pyloric, small intestinal and colonic glands, incidence of fluorescence+ cells within the population of immunoreactive cells for CGA, 5-HT and gastrin in the whole tissue area was estimated (n=3–5 in each tissue). In the pancreatic tissue, incidence of fluorescence+ cells within the population of 5-HT+ cells in the whole tissue area was estimated (n=1 of non-pregnant mouse and n=3 of pregnant mice).
Results
Fluorescence imaging of human colon tissue sections
Fluorescence signals were detected sparsely in epithelial cells of the colonic crypts (Figure 1 A-D). Fluorescence was detected under a visible wavelength range showing green in color through an ultraviolet filter (Figure 1A), yellow in color through a blue filter (Figure 1B), and red in color through a green filter (Figure 1C).
Figure 1.
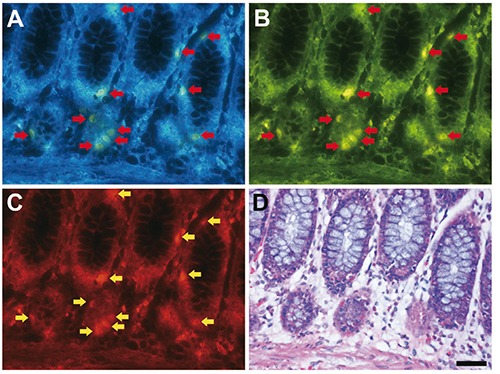
Fluorescence imaging of formalin-fixed paraffin-embedded human colon tissue sections. A-C) Arrows indicate fluorescence signals; scale bar: 50 µm. The same section was subjected to fluorescence imaging through UV filter (A), blue filter (B) and green filter (C) after deparaffinization, and then, the section was stained with hematoxylin and eosin (D).
Immunoreactivity of neuroendocrine cell markers in fluorescence+ cells
Distribution of fluorescence+ digestive glandular cells was compared with that of neuroendocrine cell markers using identical sections of the colon in humans (Figure 2). Many, but not all, of fluorescence+ cells showed CGA immunoreactivity. In contrast, all of fluorescence+ cells were identical to 5-HT+ cells distributed in the pyloric glands, small intestinal glands, and the colonic glands. Conversely, gastrin+ cells were lacking in the colonic glands (Figure 2), while they were distributed mainly in the pyloric glands.
Figure 2.
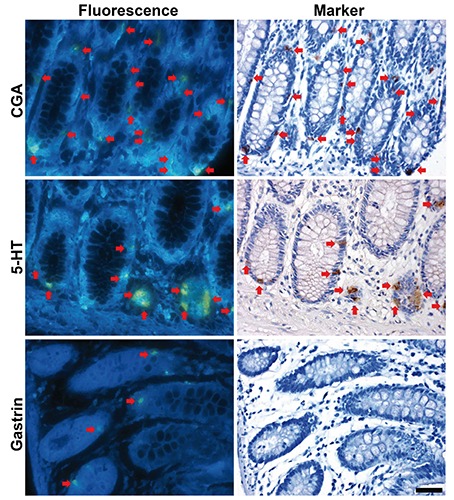
Co-localization of fluorescence+ cells with neuroendocrine cell markers in the human colonic glands. Red arrows indicate identical cells. Scale bar: 50 µm.
Distribution of fluorescence+ digestive glandular cells was compared with that of 5-HT using identical sections of the pyloric and small intestinal glands in humans (Figure 3). All of fluorescence+ cells were identical to 5-HT+ cells in these glands.
Figure 3.
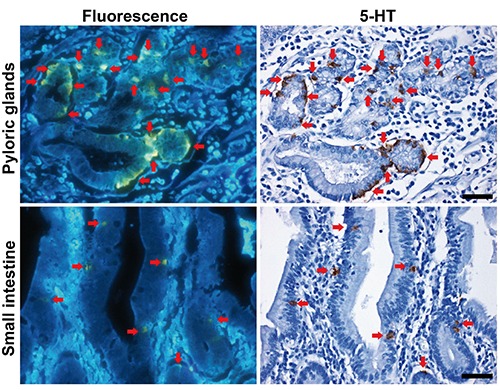
Co-localization of fluorescence+ and 5-HT+ cells in the human pyloric and small intestinal glands. Red arrows indicate identical cells. Scale bars: 50 µm.
Incidence of CGA+ cells showing fluorescence was 31% in the pyloric glands, 73% in the small intestinal glands, and 70% in the colonic glands (Figure 4). Incidence of 5-HT+ cells showing fluorescence was 83% in the pyloric glands, 93% in the small intestinal glands, and 97% in the colonic glands. Incidence of gastrin+ cells showing fluorescence was 0% in all of the pyloric, small intestinal and colonic glands.
Figure 4.

Incidence of CGA+, 5-HT+ or gastrin+ cells showing fluorescence in the human pyloric, small intestinal and colonic glands.
Distribution of fluorescence+ colonic glandular cells was compared with that of 5-HT+ cells between humans, mice and rats (Figure 5A). Incidence of 5-HT+ cells showing fluorescence was 97% in humans, 93% in mice, and 93% in rats (Figure 5B).
Figure 5.
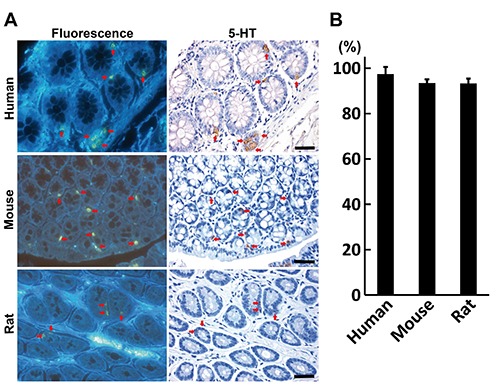
Co-localization of fluorescence+ and 5-HT+ cells in the colon across the species. A) Co-localization in the colon of a human, mouse and rat; red arrows indicate identical cells; scale bars: 50 µm. B) Incidence of 5-HT+ cells showing fluorescence.
Distribution of fluorescence+ islet cells was compared with that of 5-HT+ cells in the pancreas between pregnant and non-pregnant female mice (Figure 6A). While non-pregnant mice did not have any fluorescence+ and 5-HT+ cells in the pancreatic islets, pregnant mice showed that 95% of 5-HT+ cells were fluorescence+ (Figure 6B).
Figure 6.
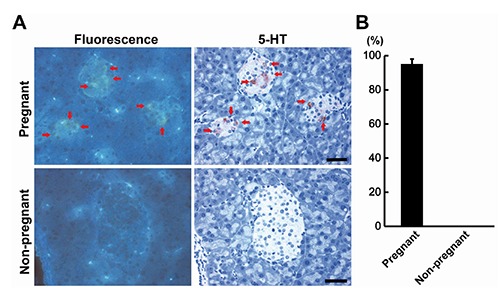
Co-localization of fluorescence+ and 5-HT+ cells in the pancreatic islets of Langerhans of pregnant mice. A) Comparison between the pregnant and non-pregnant mice; red arrows indicate identical cells; Scale bars: 50 µm. B) Incidence of 5-HT+ cells showing fluorescence.
Detection of fluorescence in acetone-fixed cryosections
Acetone-fixed cryosections of human colonic tissues did not show fluorescence signals (Figure 7).
Figure 7.
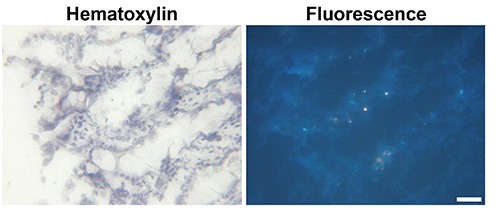
Fluorescence imaging of an acetone-fixed cryosection of a human colon tissue. Scale bar: 50 µm.
Lipofuscin fluorescence signals in lipofuscin-deposited heart and liver tissue sections
Fluorescence signals of lipofuscin in the heart and liver were detected under a visible wavelength range showing orange to yellow in color through an ultraviolet filter (Figure 8). PAS-positive lipofuscin deposits in myocardial fibers and liver cells showed mostly fluorescence signals.
Figure 8.
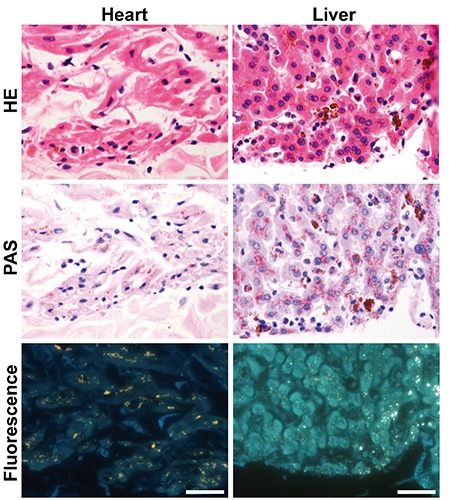
Fluorescence imaging of formalin-fixed paraffin-embedded heart and liver sections of a common squirrel monkey. Scale bars: 50 µm.
Hyperspectral fluorescence in tissue sections
Shape of hyperspectral fluorescence curve was different between 5-HT+ cells of human colon and lipofuscin deposited in the heart and liver of a common squirrel monkey (Figure 9).
Figure 9.
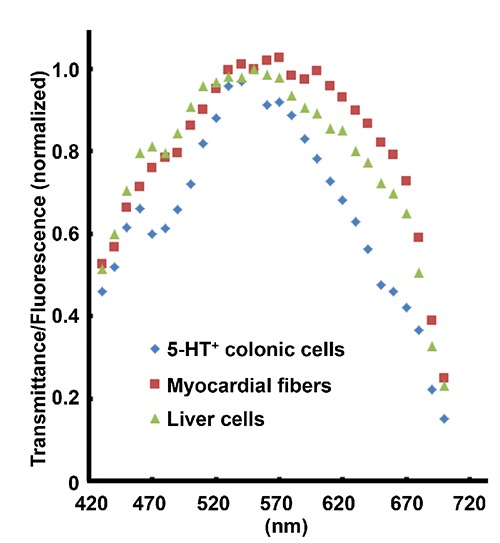
Hyperspectral fluorescence curve of 5-HT+ cells in a human colon and lipofuscin deposits in the heart and liver of a common squirrel monkey.
Discussion
In the present study, fluorescence signals were detected sparsely in the gastrointestinal tract cells, which are CGA+, and collectively constitute the gastrointestinal neuroendocrine tissue. CGA is co-stored and co-released with monoamines and peptide hormones of the adrenal medulla, pituitary gland, parathyroid, thyroid C-cells, pancreatic islets, endocrine cells of the gastrointestinal tract and sympathetic nerves.18,19 EC cells also express CGA;20 and therefore, fluorescence signals in subpopulation of CGA+ cells may be related to endocrine secretion system. In the present study, fluorescence+ cells showed the highest concordance with 5-HT+ cells in each of the pyloric, small intestinal and colonic glands, while fluorescence did not appear in any of the gastrin+ cells that are known to be mainly distributed in the pyloric antrum of the stomach to stimulate secretion of HCl by the parietal cells of the stomach.21,22 Furthermore, there were no species differences in the incidence of 5-HT+ cells in colonic glandular cells among humans, rats and mice, in the present study. The fluorescence+ cells were identically observed in 5-HT+ β cells in the pregnant mouse pancreatic islets of Langerhans, while non-pregnant mouse β cells lacked both fluorescence and 5-HT expression. These results suggest that fluorescence+ cells are identical to 5-HT+ cells. The source of fluorescence may be 5-HT itself or molecules related to its synthesis or degradation.
Synthesis of 5-HT by intestinal EC cells begins with the conversion of dietary tryptophan to hydroxyl-L-tryptophan, which is catalyzed by tryptophan hydroxylase (Tph). Previous studies have identified two isoforms of the Tph enzyme, Tph1, which is present in mainly peripheral organs such as the gut, and Tph2, which is associated with the nervous system and present predominantly in the brain stem.23,24 The second step for 5-HT synthesis is catalyzed by L-amino acid decarboxylase, which is also present in EC cells, and converts 5-hydroxy-L-tryptophan to 5-HT.25 Degradation of 5-HT is done by monoamine oxidase A by conversion into 5-hydroxyindole acetaldehyde and then by aldehyde dehydrogenase for conversion into 5-hydroxyindoleacetic acid (5-HIAA).26 Until now, no studies have reported the presence of autofluorescence in Tph, monoamine oxidase A, 5-hydroxyindole acetaldehyde or L-amino acid decarboxylase. In contrast, autofluorescence was observed with 5-HT, tryptophan, 5-hydroxy-L-tryptophan, and 5-HIAA under the UV wavelength region from 344 to 352 nm.27 On the other hand, there are studies reporting that autofluorescence signals of intact form of 5-HT can be detected in the visible light wavelength region, when they are accumulated in high concentration, utilizing special equipment.28,29 Therefore, it is suggested that the detection method of 5-HT+ cells presented here has advantages in its easiness and sensitivity.
As previously mentioned, 5-HT can be changed to an intensely fluorescent derivative by the Falck–Hillarp method or its modification, suggesting that fluorescence can be detected in formaldehyde-fixed tissues. In the present study, we observed that acetone-fixed cryosections of human colonic tissues did not show fluorescence signals as observed in formalin-fixed paraffin-embedded colonic tissues. 5-HT produced by EC cells is an important enteric mucosal signaling molecule and has been implicated in several gastrointestinal diseases, including inflammatory bowel disease and functional disorders such as irritable bowel syndrome.26 On the other hand, colonic preneoplastic proliferative lesions in humans increases autofluorescence signals as compared with the normal or hyperplastic colonic epithelia due to increase of lysosomal lipofuscin granules.30 There is also a pathological condition, named as melanosis coli, characterized by lipofuscin deposition in macrophages of the lamina propria of intestinal mucosa.31 In the present study, fluorescence signal of 5-HT+ cells in formalin-fixed tissue sections was detected under a visible wavelength range showing green/yellow in color through an ultraviolet filter, in contrast to the orange to yellow in lipofuscin granules. We also found that shape of hyperspectral fluorescence curve was different between 5-HT+ cells and lipofuscin deposits. Therefore, autofluorescence signals derived from lipofuscin deposits can be distinguished from 5-HT+ cell-derived fluorescence signals. In the present study, we report a new visualization method of 5-HT-producing cells utilizing detection of fluorescence in paraffin-embedded tissue sections after formalin fixation. By this method, EC cells of the gastrointestinal tract can easily be detected in humans, rats and mice, and therefore it may be applicable for monitoring of inflammatory status of inflammatory bowel diseases in both the experimental and clinical settings.
Acknowledgments
The authors thank Mrs. Shigeko Suzuki for her technical assistance in preparing the histological specimens. This study was supported by a research fund from Olympus Corporation.
References
- 1.Cho HJ, Robinson ES, Rivera LR, McMillan PJ, Testro A, Nikfarjam M, et al. Glucagon-like peptide 1 and peptide YY are in separate storage organelles in enteroendocrine cells. Cell Tissue Res 2014;357:63-9. [DOI] [PubMed] [Google Scholar]
- 2.Scott RV, Tan TM, Bloom SR. Can Bayliss and Starling gut hormones cure a worldwide pandemic? J Physiol 2014;592:5153-67. [DOI] [PMC free article] [PubMed] [Google Scholar]
- 3.Gershon MD, Tack J. The serotonin signaling system: from basic understanding to drug development for functional GI disorders. Gastroenterology 2007;132:397-414. [DOI] [PubMed] [Google Scholar]
- 4.Côté F, Fligny C, Bayard E, Launay JM, Gershon MD, Mallet J. Maternal serotonin is crucial for murine embryonic development. Proc Natl Acad Sci USA 2007;104: 329-34. [DOI] [PMC free article] [PubMed] [Google Scholar]
- 5.Karsenty G, Gershon MD. The importance of the gastrointestinal tract in the control of bone mass accrual. Gastroenterology 2011;141:439-42. [DOI] [PMC free article] [PubMed] [Google Scholar]
- 6.Sumara G, Sumara O, Kim JK, Karsenty G. Gut-derived serotonin is a multifunctional determinant to fasting adaptation. Cell Metab 2012;16:588-600. [DOI] [PMC free article] [PubMed] [Google Scholar]
- 7.Kim H, Toyofuku Y, Lynn FC, Chak E, Uchida T, Mizukami H, et al. Serotonin regulates pancreatic beta cell mass during pregnancy. Nat Med 2010;16:804-8. [DOI] [PMC free article] [PubMed] [Google Scholar]
- 8.Keating DJ, Spencer NJ. Release of 5-hydroxytryptamine from the mucosa is not required for the generation or propagation of colonic migrating motor complexes. Gastroenterology 2010;138:659-70.e2. [DOI] [PubMed] [Google Scholar]
- 9.Spencer NJ, Nicholas SJ, Robinson L, Kyloh M, Flack N, Brookes SJ, et al. Mechanisms underlying distension-evoked peristalsis in guinea pig distal colon: is there a role for enterochromaffin cells? Am J Physiol Gastrointest Liver Physiol 2011;301:G519-27. [DOI] [PubMed] [Google Scholar]
- 10.Kidd M, Gustafsson BI, Drozdov I, Modlin IM. IL1β- and LPS-induced serotonin secretion is increased in EC cells derived from Crohn’s disease. Neurogastroenterol Motil 2009;21:439-50. [DOI] [PMC free article] [PubMed] [Google Scholar]
- 11.Bertrand PP, Barajas-Espinosa A, Neshat S, Bertrand RL, Lomax AE. Analysis of realtime serotonin (5-HT) availability during experimental colitis in mouse. Am J Physiol Gastrointest Liver Physiol 2010;298:G446-55. [DOI] [PubMed] [Google Scholar]
- 12.Bischoff SC, Mailer R, Pabst O, Weier G, Sedlik W, Li Z, et al. Role of serotonin in intestinal inflammation: knockout of serotonin reuptake transporter exacerbates 2,4,6-trinitrobenzene sulfonic acid colitis in mice. Am J Physiol Gastrointest Liver Physiol 2009;296:G685-95. [DOI] [PubMed] [Google Scholar]
- 13.Ghia JE, Li N, Wang H, Collins M, Deng Y, El-Sharkawy RT, et al. Serotonin has a key role in pathogenesis of experimental colitis. Gastroenterology 2009;137:1649-60. [DOI] [PubMed] [Google Scholar]
- 14.Haub S, Ritze Y, Bergheim I, Pabst O, Gershon MD, Bischoff SC. Enhancement of intestinal inflammation in mice lacking interleukin 10 by deletion of the serotonin reuptake transporter. Neurogastroenterol Motil 2010;22:826-34, e229. [DOI] [PMC free article] [PubMed] [Google Scholar]
- 15.Falck B, Torp A. New evidence for the localization of noradrenalin in the adrenergic nerve terminals. Med Exp Int J Exp Med 1962;6:169-72. [DOI] [PubMed] [Google Scholar]
- 16.Falck B. Observation on the possibilities of the cellular localization of monoamines by a fluorescence method. Acta Physiol Scand 1962;56(Suppl. 197):1-25.14027625 [Google Scholar]
- 17.Lindvall O, Björklund A. The glyoxylic acid fluorescence histochemical method: a detailed account of the methodology for the visualization of central catecholamine neurons. Histochemistry 1974;39:97-127. [DOI] [PubMed] [Google Scholar]
- 18.Taupenot L, Harper KL, O’Connor DT. The chromogranin-secretogranin family. N Engl J Med 2003;348:1134-49. [DOI] [PubMed] [Google Scholar]
- 19.Wiedenmann B, Huttner WB. Synaptophysin and chromogranins/secretogranins–widespread constituents of distinct types of neuroendocrine vesicles and new tools in tumor diagnosis. Virchows Arch B Cell Pathol Incl Mol Pathol 1989;58:95-121. [DOI] [PubMed] [Google Scholar]
- 20.Giovinazzo F, Schimmack S, Svejda B, Alaimo D, Pfragner R, Modlin I, et al. Chromogranin A and its fragments as regulators of small intestinal neuroendocrine neoplasm proliferation. PLoS One 2013;8:e81111. [DOI] [PMC free article] [PubMed] [Google Scholar]
- 21.Sachs G, Prinz C, Loo D, Bamberg K, Besancon M, Shin JM. Gastric acid secretion: activation and inhibition. Yale J Biol Med 1994;67:81-95. [PMC free article] [PubMed] [Google Scholar]
- 22.Takaishi S, Shibata W, Tomita H, Jin G, Yang X, Ericksen R, et al. In vivo analysis of mouse gastrin gene regulation in enhanced GFP-BAC transgenic mice. Am J Physiol Gastrointest Liver Physiol 2011;300:G334-44. [DOI] [PMC free article] [PubMed] [Google Scholar]
- 23.Walther DJ, Peter JU, Bashammakh S, Hörtnagl H, Voits M, Fink H, et al. Synthesis of serotonin by a second tryptophan hydroxylase isoform. Science 2003;299:76. [DOI] [PubMed] [Google Scholar]
- 24.Walther DJ, Bader M. A unique central tryptophan hydroxylase isoform. Biochem Pharmacol 2003;66:1673-80. [DOI] [PubMed] [Google Scholar]
- 25.Håkanson R, Owman C, Sjöberg NO, Sporrong B. Amine mechanisms in enterochromaffin and enterochromaffin-like cells of gastric mucosa in various mammals. Histochemie 1970;21:189-220. [DOI] [PubMed] [Google Scholar]
- 26.Manocha M, Khan WI. Serotonin and GI Disorders: An update on clinical and experimental studies. Clin Transl Gastroenterol 2012;3:e13. [DOI] [PMC free article] [PubMed] [Google Scholar]
- 27.Kato T, Tokiyoshi A, Kashiwada Y, Miyachi K, Moriyama K, Morimoto S, et al. [Simple and highly sensitive fluorometric determination of serotonin using propylene glycol]. Bunseki Kagaku 2011;60:685-9 [In Japanese]. [Google Scholar]
- 28.Crespi F, Croce AC, Fiorani S, Masala B, Heidbreder C, Bottiroli G. Autofluorescence spectrofluorometry of central nervous system (CNS) neuromediators. Lasers Surg Med 2004;34:39-47. [DOI] [PubMed] [Google Scholar]
- 29.Balaji J, Desai R, Kaushalya SK, Eaton MJ, Maiti S. Quantitative measurement of serotonin synthesis and sequestration in individual live neuronal cells. J Neurochem 2005;95:1217-26. [DOI] [PubMed] [Google Scholar]
- 30.DaCosta RS, Andersson H, Cirocco M, Marcon NE, Wilson BC. Autofluorescence characterisation of isolated whole crypts and primary cultured human epithelial cells from normal, hyperplastic, and adenomatous colonic mucosa. J Clin Pathol 2005;58:766-74. [DOI] [PMC free article] [PubMed] [Google Scholar]
- 31.Freeman HJ. “Melanosis” in the small and large intestine. World J Gastroenterol 2008;14:4296-9. [DOI] [PMC free article] [PubMed] [Google Scholar]


