


Abstract
CRISPR interference (CRISPRi) represents a newly developed tool for targeted gene repression. It has great application potential for studying gene function and mapping gene regulatory elements. However, the optimal parameters for efficient single guide RNA (sgRNA) design for CRISPRi are not fully defined. In this study, we systematically assessed how sgRNA position affects the efficiency of CRISPRi in human cells. We analyzed 155 sgRNAs targeting 41 genes and found that CRISPRi efficiency relies heavily on the precise recruitment of the effector complex to the target gene transcription start site (TSS). Importantly, we demonstrate that the FANTOM5/CAGE promoter atlas represents the most reliable source of TSS annotations for this purpose. We also show that the proximity to the FANTOM5/CAGE-defined TSS predicts sgRNA functionality on a genome-wide scale. Moreover, we found that once the correct TSS is identified, CRISPRi efficiency can be further improved by considering sgRNA sequence preferences. Lastly, we demonstrate that CRISPRi sgRNA functionality largely depends on the chromatin accessibility of a target site, with high efficiency focused in the regions of open chromatin. In summary, our work provides a framework for efficient CRISPRi assay design based on functionally defined TSSs and features of the target site chromatin.
INTRODUCTION
Recently, CRISPR/Cas9 gene editing tool has been adapted to work as a programmable modulator of gene expression that acts without altering DNA sequence (1–4). The technique is based on locus-specific sgRNA-mediated recruitment of a catalytically dead Cas9 (dCas9) fused to an effector domain (i.e. repressor or activator). The most commonly chosen repressive effector is the KRAB-domain, which induces heterochromatin formation at the target locus via recruitment of heterochromatin protein 1 (HP1), nucleosome remodeling and deacetylation complex (NuRD) and histone methyltransferase SETDB1 (5–8). This CRISPR/dCas9-mediated gene-repression tool is also known as CRISPR interference (CRISPRi). The major advantage of CRISPRi over the commonly used RNAi gene-knockdown approach is its specificity. CRISPRi was reported to be highly sensitive to mismatches between the sgRNA and its target site (9). It was also shown to have minimal off-target effects on cellular gene expression profile and demonstrated a highly specific dCas9 DNA-binding pattern, if sgRNA is carefully designed (3,10–11). Such a specific targeted gene regulation technique has an enormous application potential for forward and reverse genetics, as well as for mapping gene regulatory elements.
Two previous studies identified several important parameters for efficient gene knockdown using CRISPRi (9,12). Gilbert et al. performed a screen using an sgRNA library tiling 10-kilobase regions around the transcription start sites (TSSs) of 49 genes, which regulate susceptibility to ricin (9). They found that, for efficient gene repression, sgRNAs should target the area of −50…+300 bps around the TSS and should be 18–21 nucleotides long without nucleotide homopolymers. Xu et al. developed a DNA sequence algorithm for predicting sgRNA functionality in CRISPR/dCas9 assays (12). However, the achieved predictive power of this model was substantially lower than that of the models for CRISPR knockout studies (12). This suggests that factors beyond sgRNA sequence influence the efficiency of CRISPR/dCas9-based approaches.
Another study compared the ability of CRISPRi and conventional CRISPR knockout technologies to stratify essential and non-essential genes in drop out screens (13). They found that the fraction of functional constructs per gene was substantially lower using CRISPRi technology. Thus, despite recent advances in the development of CRISPRi, we need further studies to characterize the highest attainable activity of the system at the majority of genes and to identify its optimal parameters. Addressing these questions requires systematic assessment of sgRNA functionality based on target gene expression output, and is crucial for broader application of the method. In this study, we systematically investigated how the efficiency of CRISPRi is affected by the position of the sgRNA relative to the TSSs predicted using different databases and relative to the chromatin environment of a target region. We demonstrate that most efficient sgRNAs target areas around the TSSs predicted by the FANTOM5/CAGE promoter annotation study. Moreover, we show that once the target region is correctly defined, sgRNA efficiency can be further improved using a previously published algorithm estimating nucleotide preferences in sgRNAs. Finally, we show that efficient sgRNAs preferentially target open chromatin regions.
MATERIALS AND METHODS
Plasmids and sgRNA cloning
pHR-SFFV-KRAB-dCas9-2A-CHERRY and pU6-sgRNA-EF1α-puro-T2A-BFP were purchased from Addgene (cat.no 60954 and 60955, respectively). For sgRNA cloning, oligos were annealed in annealing buffer (200 mM potassium acetate, 60 mM HEPES-KOH pH 7.4, 4 mM magnesium acetate) and ligated into BstXI + BlpI digested pU6-sgRNA-EF1α-puro-T2A-BFP, as described in (9).
Cell culture
HEK293FT packaging cells and BJ fibroblasts stably expressing human telomerase reverse transcriptase (hTERT) and SV40 small t antigen (BJ-hTERT/small-t) were cultured in DMEM, high glucose, GlutaMAX supplement, pyruvate medium (Thermo Fisher SCIENTIFIC) containing 10% heat-inactivated FCS (HyClone) and 1× Penicillin/Streptomycin (Thermo Fisher SCIENTIFIC). THP-1 monocytic leukemia cells were cultured in RPMI 1640, GlutaMAX supplement medium (Thermo Fisher SCIENTIFIC) containing 10% heat-inactivated FCS (HyClone) and 1× penicillin/streptomycin (Thermo Fisher SCIENTIFIC).
Western blotting
The following primary and secondary antibodies were used: mouse monoclonal antibody against HA-tag (BioLegend, cat.no 901501), mouse monoclonal antibody against Vinculin (Sigma, cat.no SAB4200080), secondary peroxidase horse anti-mouse IgG antibody (Vector Laboratories, cat.no PI-2000).
Flow cytometry
Flow cytometry was performed using a BD FACSAria III Cell Sorter.
Virus production and lentiviral transduction
HEK293FT cells were co-transfected with pU6-sgRNA-EF1α-puro-T2A-BFP or pHR-SFFV-KRAB-dCas9-2A-CHERRY and pAX8 and pCMV-VSV using a standard calcium phosphate protocol. The viral supernatant was collected 72 h after HEK293FT transfection and used for transduction. THP-1 cells were transduced using a RetroNectin Bound Virus Infection Method (TaKaRa) according to the manufacturer's instructions. Transduction was performed in presence of polybrene at 8 µg/ml. Twenty-four hours after transduction with sgRNA-encoding lentiviral plasmids, puromycin was added at 2 µg/ml for THP-1 cells and at 1 µg/ml for BJ-hTERT/small-t cells.
RNA extraction, cDNA synthesis and qRT-PCR analysis
Total RNA was extracted using RNeasy Plus Mini Kit (Qiagen) in accordance with the manufacturer's protocol. One microgram of total RNA was subjected to reverse transcription using Transcriptor Universal cDNA Master (Roche). Quantitative polymerase chain reaction (PCR) with reverse transcription (qRT-PCR) reactions were set up in triplicate using LightCycler 480 SYBR Green I Master (Roche) and primers listed in Supplementary Table S1. qRT-PCR experiments were performed on a LightCycler 480 Instrument II (Roche). Absolute quantitation was performed using a standard curve and the obtained values were normalized to RPLP0 expression. To estimate the proportion of remaining transcript for each sgRNA-transduced sample, a ratio to a mean of two independent negative control sgRNA samples was calculated. Each sgRNA efficiency value in the final table (Supplementary Table S2) represents an average of two independent experiments.
Data analysis
The following publicly available FANTOM5/CAGE datasets were used in the study: expression (RLE normalized) of robust phase 1 CAGE-peaks for chronic myelogenous leukemia cell line K562 (CNhs12334.10824-111C5, CNhs12335.10825-111C6, CNhs12336.10826-111C7) and acute myeloid leukemia (FAB M5) cell line THP-1 (CNhs10722.10399-106A3, CNhs10723.10400-106A4, CNhs10724.10405-106A9).
The sgRNA sequences from the published genome-wide CRISPRi library (9) were mapped to the human genome (hg19 assembly excluding alternate assembly sequences) using bowtie (14) in a full-length alignment mode not allowing any mismatches (version 1.1.1. with parameters -f -v 0 -a -y -S). sgRNAs not mapping or mapping to multiple locations in the reference as well as the negative control and the sgRNAs targeting chrM and chrY were discarded. To divide the sgRNAs into ‘hit’ and ‘non-hit’ categories a proliferation phenotype threshold of −0.2 was used.
To assign sgRNAs to TSSs we used the following gene annotations: GENCODE V19 (2013-12-13 release; Basic gene set, only protein coding), UCSC genes (2013-06-14 release; only coding), RefSeq genes (2016-03-04 release, reviewed and validated mRNA). sgRNA centers were assigned to the closest TSS taking into account the strand of sgRNA targets and annotated genes using BEDTools (15). In the case of FANTOM5/CAGE we used only p1 and non-assigned promoters from the robust phase 1 promoter set. We then used BEDTools (15) to assign sgRNA centers to the closest CAGE-peak center in a strand-specific manner.
To devise a set of predominantly active promoters in K562 cells, we selected all the CAGE-peaks with mean value for three replicates > 0. If several CAGE regions were assigned to one gene, we chose the CAGE-peak with the highest mean signal in K562 dataset. We then used BEDTools (15) to assign sgRNA centers to the closest CAGE-peak center in a strand-specific manner.
The normalized profiles of chromatin marks, DNase-, FAIRE- and MNase- sequencing (as bigWig files) for K562 cells were acquired from ENCODE datasets (16). The average signals of chromatin marks over sgRNA-covered bases in the genome were calculated with UCSC tools (17). As a control we took +/− 10 bp regions around random TSSs selected using GENCODE V19.
We used the SSC script (12) to calculate the sequence efficiency scores for sgRNAs with length of 19, 20, 21 bp, and R version 3.1.2 (2014-10-31) for all statistical analysis and plotting.
RESULTS
Establishment of the CRISPRi method in the THP-1 leukemia cell line
To establish a CRISPRi-competent cellular system, we transduced the THP-1 acute monocytic leukemia cell line with a dCas9-KRAB lentiviral plasmid (9) and sorted positively transduced cells for mCHERRY expression, which is linked to dCas9-KRAB via a 2A sequence. We did not observe any toxicity associated with dCas9-KRAB expression, and the established cell line stably maintained transgene expression over time (Figure 1A and B). Next, we devised a protocol for systematic evaluation of the functionality of individual sgRNAs in repressing their respective target gene (Figure 1C). THP-1; dCas9-KRAB cells were transduced with a lentiviral plasmid expressing the respective sgRNA (9) and selected with puromycin for 48 h after which the cells were collected for gene expression analysis. The efficiency of the transcriptional inhibition was first tested using functional sgRNAs against the housekeeping genes GTF2B and ANAPC4. Efficient knockdown was observed 72 h after transduction (Figure 1D) and caused impaired cell proliferation (Figure 1E).
Figure 1.

Establishment of the CRISPR interference system in THP-1 acute monocytic leukemia cells. (A) Flow cytometry analysis of mCHERRY expression in THP-1;dCas9-KRAB-2A-CHERRY cells after transduction and cell sorting as well as after additional 3 months in culture. (B) Western blot analysis of dCas9 protein expression in THP-1;KRAB-dCas9-2A-CHERRY cells after 3 months in culture. dCas9 is detected using an antibody against the C-terminal HA-tag. (C) Experimental design used to assess the efficiency of individual sgRNAs to mediate knockdown of target gene expression. (D) qRT-PCR analysis of GTF2B and ANAPC4 expression in THP-1;KRAB-dCas9-2A-CHERRY cells transduced with either a non-targeting (negative control) sgRNA or sgRNAs against ANAPC4 and GTF2B, respectively. The values are normalized to RPLP0 and shown as mean ± SD. P-values (P < 0.002) were calculated using an unpaired t-test. The values represent one out of two experiments. (E) Growth curves of THP-1;KRAB-dCas9-2A-CHERRY cells transduced with either a non-targeting (negative control) sgRNA or sgRNAs against ANAPC4 and GTF2B, respectively. X-axis indicates number of days after the end of the puromycin selection. The values are shown as mean ± SD. P-values (P < 0.001) were calculated using nonlinear regression exponential curve fit with subsequent extra sum-of-squares F-test. The values represent one out of two experiments.
Frequent TSS misannotation accounts for low efficiency of CRISPRi
A previous study reported genome-scale CRISPRi screens in human cells and provided a genome-wide set of sgRNAs (9). This set was designed to fall within the range of −50…+300 bps around the transcription start site (TSS) of genes based on the GENCODE V19 annotation. From this published dataset we cloned 107 sgRNAs targeting 41 genes, all encoding major chromatin regulators, and analyzed their knockdown efficiency as described above. Among these sgRNAs, 34.6% caused a considerable knockdown of the target gene (>2-fold mRNA depletion) (Figure 2A). For 27 genes we identified at least one functional sgRNA, while we did not identify any functional sgRNAs for the remaining 14 genes (Figure 2A). We hypothesized that the low efficiency of CRISPRi may be due to frequent TSS misannotation, which causes sgRNAs to target an area insensitive to dCas9-KRAB-mediated repression. If this were the case, improved TSS prediction should allow distinguishing between functional and non-functional sgRNAs, based on their position relative to the TSS.
Figure 2.

sgRNA functionality depends on the position relative to the FANTOM5/CAGE-predicted TSS. (A) Overview of the original sgRNA set. A total of 107 sgRNAs were designed targeting 41 genes. The cut-off for functionality was set to ≤0.5 remaining transcript. (B) Distributions of distances from the centers of functional (green) and non-functional (dark red) sgRNAs to the nearest TSS annotated by RefSeq, UCSC and GENCODE V19, respectively. The P-value is calculated using the chi-squared contingency table test. (C) Distributions of distances from the centers of functional (green) and non-functional (dark red) sgRNAs to the center of the predominant CAGE-peak. The P-value is calculated using the chi-squared contingency table test. (D) Box plot showing the proportion of remaining transcript between the sgRNAs mapping inside and outside the area of −50…+150 bps around the predominant CAGE-peak center. The lower and upper whiskers represent values for 5 and 95% of the data, respectively. The box designates lower and upper quantiles as well as a median value. The P-value is calculated using the Wilcoxon test.
To test this, we focused on four different TSS annotations: RefSeq, UCSC, GENCODE V19 and FANTOM5/CAGE. RefSeq defines high-quality gene predictions by combining manual review, automated analysis and collaboration (18,19) based on the data from the public sequence repository INSDC (18–20)21. UCSC Known Genes dataset is built using a fully automated approach of combining mRNA data from GenBank (22) and protein data from UniProt (23,24)25. GENCODE annotation is devised by combining manual gene prediction from HAVANA group (Wellcome Trust Sanger Institute), automatic prediction from Ensembl (26) and experimental validation for lower confidence transcripts (27). The three above described genome annotation approaches rely on cDNA library sequences to predict TSSs. In turn, FANTOM5/CAGE promoter atlas represents a database of functionally defined TSSs created using the CAGE (cap analysis of gene expression) technique based on cap-trapping and single-molecule sequencing of the outermost 5′ end of the mRNA (28). This database is generated across 975 human and 399 mouse samples (29) and estimates the activity of each promoter for an individual gene at single-nucleotide resolution (30). To investigate whether one of these annotations can allow distinguishing between the functional and non-functional sgRNAs in our dataset, we estimated the distances between each sgRNA and its nearest TSS based on these databases. In the case of FANTOM5/CAGE annotation, the sgRNAs were assigned to the predominant CAGE-predicted TSS in THP-1 cells for each of the 41 genes in our dataset. As a result, we did not observe significant differences between the distributions of functional and non-functional sgRNAs relative to the nearest TSS using RefSeq, UCSC and GENCODE V19 databases (P-values of 0.327, 0.326 and 0.828, respectively) (Figure 2B), suggesting suboptimal prediction of sgRNA functionality for CRISPRi. In contrast, mapping sgRNAs relative to the CAGE-predicted TSSs allowed significant resolution of functional and non-functional sgRNA populations (P-value = 0.000175) (Figure 2C). Specifically, 27 out of 50 sgRNAs (54%) were functional within the area of −50…+150 bps around the center of the predominant CAGE-peak, compared to only 10 out of 57 (17.5%) outside this area (Figure 2C). The optimum of CRISPRi sgRNA activity lay in the area of 0…+50 bps, where 16 out of 22 sgRNAs (73%) were functional. In addition, the median level of remaining transcript was significantly lower (P-value = 2.65e-06) for the sgRNAs mapping within the −50…+150 bps of CAGE-peak center (Figure 2D). Therefore, our data suggests that using TSS annotations from the FANTOM5/CAGE promoter database serves as the most reliable reference for designing efficient CRISPRi sgRNAs among the ones studied.
Targeting sgRNAs into the FANTOM5/CAGE-predicted TSS areas markedly increases the efficiency of the target-gene knockdown
To further confirm our observations, we investigated whether re-design of sgRNAs to target the CAGE-defined TSS would improve CRISPRi efficiency for the genes in our original dataset. First, we selected 10 genes for which all sgRNAs in our original dataset were non-functional and mapped outside the functional sgRNA area predicted by CAGE (ASH1L, KDM5B, KDM6B, KDM2A, KMT2D, PRDM2, SETD1B, SETD7, SETD1A and SETD4). For each of these genes we designed several additional sgRNAs (total of 26 sgRNAs) within the area of −50…+150 around the center of the predominant CAGE-peak and analyzed their ability to induce target gene knockdown. Re-designed sgRNAs showed considerably increased knockdown efficiencies for 8 out of 10 genes (Figure 3 and Supplementary Figure S1a). The inability to repress KDM2A and SETD1A gene expression could be a matter of an insufficient number of sgRNAs tested, incorrect TSS annotation or could reflect the resistance of these genes to KRAB-mediated repression.
Figure 3.

Examples of re-designed sgRNAs for SETD7, KDM5B, SETD1B and ASH1L. The left panel illustrates the degree of knockdown mediated by the original (orange) and re-designed (purple) sgRNAs against their position relative to the predominant CAGE-peak center. The values represent mean proportion remaining transcript ± SD of two biological replicates (i.e. independent lentiviral transductions). The right panel comprises snapshots from the UCSC Genome Browser (25) indicating the positions of the original (orange) and re-designed (purple) sgRNAs as well as custom tracks for the FANTOM5/CAGE promoter atlas and the THP-1 CAGE data.
Secondly, we selected another group of genes (KDM5C, SETD2, SUV39H2 and WHSC1) for which some sgRNAs overlapping the −50…+150 bps area around the CAGE-predicted TSS were present in the original dataset, but they failed to induce gene knockdown. We reasoned that by simply designing more sgRNAs within the main CAGE-defined TSS, we would be able to identify the functional sgRNAs for these genes. This indeed was the case, as analysis of 1–4 additional sgRNAs per gene yielded several efficient sgRNAs for each gene in this group (Supplementary Figure S1b).
Thirdly, we designed additional CAGE-peak-mapping sgRNAs to 6 more genes (SETD9, DOT1L, EHMT2, NSD1, PRMT5 and SETD3). In the original dataset (Figure 2A) we found only one functional sgRNA for each of these genes, all of which mapped outside the area of −50…+150 bps of the CAGE-peak center. With this experiment we wanted to check whether these six genes would also be sensitive to KRAB-mediated repression upon targeting of dCas9-KRAB to our predicted sgRNA functionality area (−50…+150 bps around CAGE center). For five of the six genes in this group (PRMT5, SETD9, SETD3, EHMT2 and NSD1) re-design uncovered additional functional sgRNAs, with eight out of nine re-designed sgRNAs inducing >50% target gene knockdown (Supplementary Figure S1c).
In total, we designed and analyzed 48 new sgRNAs that target the CAGE-predicted TSS of 20 genes. Twenty-four of those (50%) were functional, in contrast to only 12% in the starting set of 51 sgRNAs targeting the same genes (Figure 4A). Consistently, the median level of the remaining transcript was significantly lower (P-value = 7.27e-07) for the re-designed sgRNA group (Figure 4B). Moreover, we observed good reproducibility of independent sgRNA validations (Pearson correlation coefficient = 0.89) (Supplementary Figure S1d) further strengthening our observations. Taken together, our data confirmed that sgRNAs positioned inside a CAGE-predicted TSS show higher degrees of knockdown.
Figure 4.

Comparison of the original and re-designed sgRNA sets targeting 20 genes chosen for re-design experiments. (A) Bar plot representing the number of functional and non-functional sgRNAs in the original and re-designed sgRNA sets. (B) Box plot comparing the proportion remaining transcript between the original and re-designed sgRNA sets. The lower and upper whiskers represent values for 5 and 95% of the data, respectively. The box designates lower and upper quantiles as well as a median value. The P-value is calculated using the Wilcoxon test. (C) Flow cytometry analysis of mCHERRY expression in BJ-hTERT/small-t;dCas9-KRAB-2A-CHERRY cells after transduction and cell sorting. (D) qRT-PCR analysis of the expression of ASH1L, KDM5B, PRDM2, SETD1B, SETD4, KDM6B, SETD7, SETD1A and KDM2A genes in BJ-hTERT/small-t;dCas9 immortalized human fibroblasts after the transduction with the indicated sgRNAs. Values represent mean ± SD. The location of the sgRNAs relative to the predominant CAGE-defined TSS is indicated in red in brackets. (E) Box plot comparing the SSC scores for functional and non-functional sgRNAs mapping inside and outside the area of −50…+150 bps around the predominant CAGE-peak center. The lower and upper whiskers represent values for 5 and 95% of the data, respectively. The box designates lower and upper quantiles as well as a median value. The P-values are calculated using the Wilcoxon test.
To corroborate our results in an independent non-cancerous cell line, we generated immortalized human skin fibroblasts (BJ-hTERT/small-t) constitutively expressing dCas9 (Figure 4C). We chose nine genes from the first group of our re-design experiment that have similar CAGE sequencing pattern to the THP-1 cells in skin fibroblasts. We then assessed the degree of knockdown mediated by two sgRNAs for each gene, one from the original and one from the re-designed sgRNA sets. As a result, similarly to the observations in THP-1 cells, the proximity to the CAGE-defined TSS was a good predictor of sgRNA functionality for seven genes (ASH1L, KDM5B, PRDM2, SETD7, SETD4, SETD1B and KDM6B), while SETD1A and KDM2A remained insensitive also in this cell line (Figure 4D).
Consideration of sgRNA sequence allows further improving CRISPRi efficiency
Despite considerably improving the efficiency of CRISPRi based on sgRNA location relative to the CAGE-defined TSS, a half of the sgRNAs in our re-design dataset were still non-functional. This suggests the contribution of other factors to CRISPRi efficiency. To this end, we investigated whether discriminating sgRNAs based on their sequence features can allow further improvement of the efficiency within the CAGE-defined functionality area. For that we chose to use a previously reported computer model (Sequence Scan for CRISPR or SSC) (12) devised for predicting sgRNA functionality in CRISPRi experiments. The reported predictive power of this model was relatively low (ROC-AUC around 0.6). However, we hypothesized that application of this algorithm to the correctly located sgRNAs may improve its predictive capacity. We computed the SSC functionality score for all the sgRNAs in our validation set and compared the obtained scores between the different sgRNA groups. We found that there was no statistically significant difference between the scores obtained for the functional and non-functional sgRNAs outside the CAGE area (P = 0.084) (Figure 4E). This suggests that non-functional sgRNAs in this group fail to work primarily due to the wrong location. Strikingly, there was a statistically significant difference in the SSC score between the functional and non-functional sgRNAs inside the CAGE-defined functionality area (P = 0.0006) (Figure 4E). This demonstrates that once the functional TSS is identified, the efficiency can be further improved by choosing the sgRNA with a higher SSC score.
Proximity to a CAGE-predicted TSS is indicative of sgRNA functionality on a genome-wide scale
To investigate whether our observations were consistent with the published results we analyzed a set of sgRNAs from the study by Gilbert et al. (9). These authors performed a genome-wide negative selection CRISPRi proliferation screen in K562 chronic myelogenous leukemia cells. We first divided all the sgRNAs in their library into ‘hit’ and ‘non-hit’ categories based on the proliferation phenotype score obtained in the screen (‘hit’ threshold set to ≤−0.2). Next, we analyzed the distribution of the distances from ‘hit’ and ‘non-hit’ sgRNAs to the center of the closest TSS predicted using RefSeq, UCSC, GENCODE V19 or FANTOM5/CAGE annotations. Similarly to the reasoning we used for our experimental sgRNA set, a better TSS prediction would allow to distinguish between the ‘hit’ and ‘non-hit’ distributions. In the case of FANTOM5/CAGE, we used a promoter set containing the highest ranked promoter for each gene in the genome, based on all the cell types analyzed by the FANTOM5 consortium, as well as all the non-gene-assigned promoters (Supplemental Table S3). Strikingly, using FANTOM5/CAGE prediction, 86% of the sgRNAs in the ‘hit’ category mapped within the area of −50…+250 bps of the CAGE-peak, compared to only 56% of sgRNAs in the ‘non-hit’ category. In contrast, using other TSS predictions allows very limited discrimination between the ‘hit’ and "non-hit’ categories: 92% of ‘hit’ and 89% of ‘non-hit’ were within the −50…+250 bps area predicted by GENCODE V19, 81 and 67% predicted by RefSeq, and 83 and 72% predicted by UCSC (Figure 5A). This supports our observation that sgRNAs positioned in the CAGE-predicted TSSs are more likely to be functional.
Figure 5.

Genome-wide analysis of sgRNA functionality based on the location relatively to TSS. (A) Distributions of ‘hit’ and ‘non-hit’ sgRNA locations relatively to the nearest predicted TSS based on RefSeq, UCSC, GENCODE V19 and FANTOM5/CAGE annotations. The threshold score for ‘hit’ was set to −0.2 based on Gilbert et al. proliferation screen in K562 cells (9). Tables indicate the percentage of ‘hit’ and ‘non-hit’ sgRNAs falling inside the area of −50…+250 bps around the predicted TSS. The P-value is calculated using the chi-squared contingency table test. (B) Distributions of ‘hit’ and ‘non-hit’ sgRNA locations relatively to the nearest predicted TSS based on FANTOM5/CAGE K562 cell-specific promoter set. The threshold score for ‘hit’ was set to −0.2 based on Gilbert et al. proliferation screen in K562 cells (9). Tables indicate the percentage of ‘hit’ and ‘non-hit’ sgRNAs falling inside the area of −50…+250 bps around the predicted TSS. The P-value is calculated using the chi-squared contingency table test.
A considerable proportion of the ‘non-hit’ sgRNA category targets the genes not expressed in K562 cells. We hypothesized that removing TSSs for those genes from the analysis would result in even better resolution between the ‘hit’ and ‘non-hit’ categories, as those sgRNAs would now be assigned to the TSS of the nearby expressed gene, increasing their distance. Based on the FANTOM5/CAGE data, we assembled a set of TSSs predominantly active in K562 cells, and, indeed, using this, 84% of the ‘hit’ and only 42% of the ‘non-hit’ sgRNAs mapped within the CAGE-predicted functionality area (Figure 5B).
The sgRNA functionality area predicted using the FANTOM5/CAGE database was 100 bp larger for the genome-wide sgRNA set (−50…+250 bps) than for our experimental set (−50…+150 bps) (Figures 2B and 5B). This is potentially due to the insufficient number of sgRNAs in our validation experiments in THP-1 cells. Interestingly, using FANTOM5/CAGE annotation, ‘hit’ sgRNAs form a bimodal distribution with a dip at around +110…+160 bps (Figure 5 and Supplementary Figure S2). This could be due to nucleosome positioning at the TSS, as two recent studies reported impediment of Cas9 binding by the nucleosome (31,32).
Even though CAGE-predicted TSS annotations are available for a large number of mouse and human cell types, there could be situations when there is no such data available (e.g. CRISPRi design for primary cancer tissues) or when an sgRNA broadly applicable to multiple cell types is needed. The gene-assigned promoters in the human FANTOM5/CAGE promoter atlas are ranked according to the total number of reads obtained for a particular CAGE peak in 975 human samples. Thus, most genes have multiple assigned promoters in the atlas, with ‘p1’ being the most likely TSS used across all cell types. To test the extent of cell type-specific promoter usage we assessed the proportions of genes predominantly expressed from differentially ranked FANTOM5/CAGE promoters in K562 cells. We found that 87.4% of genes in K562 cells were predominantly expressed from p1 promoter, 8.3% from p2 promoters and 4.2% from p3 and higher (Figure 6). Thus, in situations where CAGE data is not available for a particular cell type, designing sgRNAs targeting the highest ranked promoters from the FANTOM5/CAGE atlas is expected to give the best chance of success.
Figure 6.
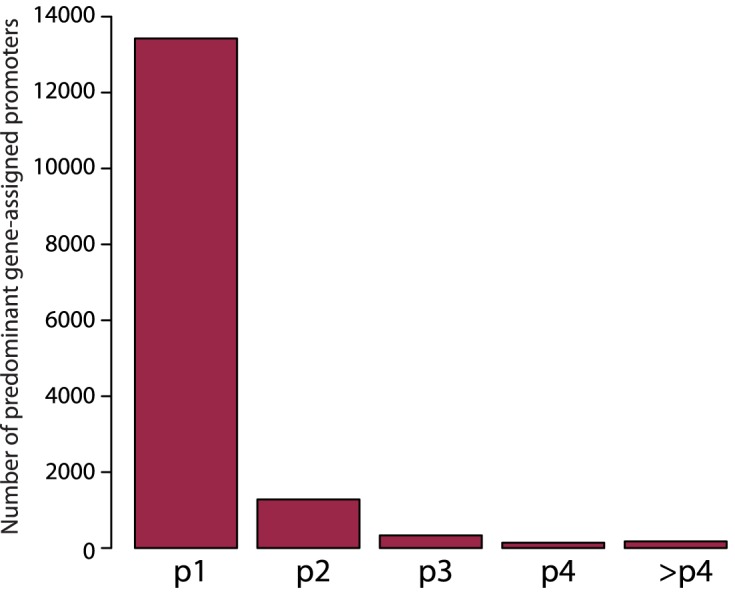
FANTOM5/CAGE promoter usage in K562 cells. The bar plot indicates the distribution of FANTOM5/CAGE gene-assigned promoters predominantly used in K562 cells across FANTOM5/CAGE promoter rank categories.
sgRNA functionality positively correlates with chromatin accessibility of the target site
Lastly, we investigated whether a particular chromatin signature characterizes the regions sensitive for dCas9-KRAB-mediated repression. For this purpose we compared the chromatin environment of sgRNA target sites in the ‘hit’ and ‘non-hit’ categories from the genome-wide CRISPRi screen performed in (9). Particularly, for each sgRNA target site we estimated mean normalized signal intensity for various histone marks and chromatin assays based on ENCODE data (16) generated for K562 cells. We found that ‘hit’ sgRNA target locations were characterized by increased intensity of the chromatin marks associated with active transcription and open chromatin (H3K27ac, H3K9ac, H3K4me3, H3K4me2 and H3K79me2) (Figure 7A). Moreover, ‘hit’ sgRNA target positions had higher mean DNase-seq and FAIRE-seq signals and lower nucleosome enrichment (determined by MNase-seq data) (Figure 7A), all of which define open chromatin. Conversely, no large differences in terms of repressive histone marks were observed between the ‘hit’ and ‘non-hit’ sites (Figure 7B), probably due to a general depletion of these in both categories. This analysis suggests that efficiency of CRISPRi is dependent on high chromatin accessibility of the sgRNA target area, which in turn explains its maximal functionality within a narrow window around the CAGE-predicted TSS.
Figure 7.

Analysis of the chromatin environment at the positions of ‘hit’ and ‘non-hit’ sgRNAs. (A) Box plots represent mean normalized intensity of H3K27ac, H3K9ac, H3K4me3, H3K4me2, H3K79me2, DNase-seq, FAIRE-seq and MNase-seq signals estimated for sgRNA target sites and 2000 random TSSs (±10 bps). The lower and upper whiskers represent values for 5 and 95% of the data, respectively. The box designates lower and upper quantiles as well as a median value. The P-value is calculated using the Wilcoxon test, which is <2.2e-16 for all the comparisons indicated with a star. (B) Box plots represent mean normalized intensity of H3K9me1, H3K27me3, H3K36me3 and H3K9me3 signals estimated for sgRNA target sites and 2000 random TSSs (±10 bps). The lower and upper whiskers represent values for 5 and 95% of the data, respectively. The box designates lower and upper quantiles as well as a median value.
DISCUSSION
Most mammalian promoters are not associated with any core promoter elements. Instead, their transcriptional initiation is governed by a combination of DNA sequence and chromatin signals (30,33). The interplay of multiple transcription initiation signals is not well understood and, therefore, individual TSS identification in mammals largely relies on the sequencing of the 5′ end of mRNAs (30), which is not always easy due to frequent premature termination of the cDNA synthesis. To this end, CAGE represents a powerful technique for predicting TSSs, since it measures the actual output of each promoter at single nucleotide resolution and in a high-throughput manner. As we show here, the high resolution of the CAGE method makes it very useful when defining CRISPRi target sites, as dCas9-KRAB repressive activity is restricted to a very narrow window around the TSS. In comparison, if prediction were only based on open chromatin this would require probing larger regions of DNA to determine the most optimal sgRNA target sites.
It was previously shown that the formation of the KRAB-recruited multifunctional repressor complex induces heterochromatin spreading through the propagation of HP1 and H3K9me3 deposition (34). Thus, the functionality of the dCas9-KRAB only within a narrow interval potentially reflects its limited ability to bind outside this area. Indeed, multiple reports have previously shown that dCas9 has high preference for binding in accessible chromatin regions (35–37). This is also consistent with our observation that active sgRNAs map in the areas of open chromatin.
Interestingly, we observed that the majority of genes in K562 cells have a predominant CAGE-predicted TSS that ranks first among other promoters assigned to the particular gene in the FANTOM5/CAGE promoter atlas, which is built across 975 human cell types. Thus, in order to design an optimized genome-wide CRISPRi library applicable to a wide range of cell types, the best approach is to design sgRNAs targeting highest ranked promoters across all cell types (termed as p1 and p2 by FANTOM5).
Despite markedly improving the efficiency of CRISPR interference method, sgRNA design based on FANTOM5/CAGE TSS annotation and consideration of the chromatin environment of the sgRNA target site does not guarantee an efficient knockdown. This reflects the importance of other factors in dCas9-KRAB-mediated repression, such as the sequence and potential secondary structures of the sgRNAs as well as the simultaneous expression of a target gene from several similarly active TSSs. Indeed, as we show here, once the correct target site (functional TSS) is determined, the efficiency can be further improved by considering sgRNA sequence. At the same time, genes with several similarly active TSS regions would require simultaneous expression of sgRNAs targeting each TSS to enable efficient gene repression.
In summary, using a set of 155 sgRNAs, we have demonstrated that targeting CAGE-defined TSSs leads to more efficient CRISPR interference assays. Moreover, we have confirmed this observation using the genome-wide sgRNA library data obtained in the previously reported CRISPRi screen. In addition, we showed that sgRNA selection can be further optimized by considering sequence determinants of sgRNA functionality based on a previously published computer model (12). Altogether, the strategy for the sgRNA design established in this study is likely to be applicable to many cell types given the abundance of the CAGE data. In addition, we suggest that, in the absence of the CAGE data for a particular cell type, targeting open chromatin regions and highest ranked promoters from the FANTOM5/CAGE database could be an excellent strategy.
Supplementary Material
Acknowledgments
We thank the members of the Helin lab for discussions. We thank Jens Vilstrup Johansen for bioinformatics assistance and Kasper Dindler Rasmussen and Muhammad A. Zabidi for critical reading of the manuscript.
SUPPLEMENTARY DATA
Supplementary Data are available at NAR Online.
FUNDING
EMBO Fellowship [1204-2014 to A.R.]; EU Marie Curie Fellowship [659171 to A.R.]; EMBO Fellowship [1014-2015 to D.S.]; European Research Council [294666_DNAMET]; Danish Cancer Society; Danish National Research Foundation [DNRF 82]; Lundbeck Foundation; Novo Nordisk Foundation centre grant (The Novo Nordisk Foundation Section for Stem Cell Biology in Human Disease). Funding for open access charge: Danish National Research Council.
Conflict of interest statement. None declared.
REFERENCES
- 1.Qi L.S., Larson M.H., Gilbert L.A., Doudna J.A., Weissman J.S., Arkin A.P., Lim W.A. Repurposing CRISPR as an RNA-guided platform for sequence-specific control of gene expression. Cell. 2013;152:1173–1183. doi: 10.1016/j.cell.2013.02.022. [DOI] [PMC free article] [PubMed] [Google Scholar]
- 2.Perez-Pinera P., Kocak D.D., Vockley C.M., Adler A.F., Kabadi A.M., Polstein L.R., Thakore P.I., Glass K.A., Ousterout D.G., Leong K.W., et al. RNA-guided gene activation by CRISPR-Cas9-based transcription factors. Nat. Methods. 2013;10:973–976. doi: 10.1038/nmeth.2600. [DOI] [PMC free article] [PubMed] [Google Scholar]
- 3.Gilbert L.A., Larson M.H., Morsut L., Liu Z., Brar G.A., Torres S.E., Stern-Ginossar N., Brandman O., Whitehead E.H., Doudna J.A., et al. CRISPR-mediated modular RNA-guided regulation of transcription in eukaryotes. Cell. 2013;154:442–451. doi: 10.1016/j.cell.2013.06.044. [DOI] [PMC free article] [PubMed] [Google Scholar]
- 4.Maeder M.L., Linder S.J., Cascio V.M., Fu Y., Ho Q.H., Joung J.K. CRISPR RNA-guided activation of endogenous human genes. Nat. Methods. 2013;10:977–979. doi: 10.1038/nmeth.2598. [DOI] [PMC free article] [PubMed] [Google Scholar]
- 5.Schultz D.C., Ayyanathan K., Negorev D., Maul G.G., Rauscher F.J. SETDB1: a novel KAP-1-associated histone H3, lysine 9-specific methyltransferase that contributes to HP1-mediated silencing of euchromatic genes by KRAB zinc-finger proteins. Genes Dev. 2002;16:919–932. doi: 10.1101/gad.973302. [DOI] [PMC free article] [PubMed] [Google Scholar]
- 6.Sripathy S.P., Stevens J., Schultz D.C. The KAP1 corepressor functions to coordinate the assembly of de novo HP1-demarcated microenvironments of heterochromatin required for KRAB zinc finger protein-mediated transcriptional repression. Mol. Cell. Biol. 2006;26:8623–8638. doi: 10.1128/MCB.00487-06. [DOI] [PMC free article] [PubMed] [Google Scholar]
- 7.Schultz D.C., Friedman J.R., Rauscher F.J. Targeting histone deacetylase complexes via KRAB-zinc finger proteins: the PHD and bromodomains of KAP-1 form a cooperative unit that recruits a novel isoform of the Mi-2alpha subunit of NuRD. Genes Dev. 2001;15:428–443. doi: 10.1101/gad.869501. [DOI] [PMC free article] [PubMed] [Google Scholar]
- 8.Lupo A., Cesaro E., Montano G., Zurlo D., Izzo P., Costanzo P. KRAB-zinc finger proteins: a repressor family displaying multiple biological functions. Curr. Genomics. 2013;14:268–278. doi: 10.2174/13892029113149990002. [DOI] [PMC free article] [PubMed] [Google Scholar]
- 9.Gilbert L.A., Horlbeck M.A., Adamson B., Villalta J.E., Chen Y., Whitehead E.H., Guimaraes C., Panning B., Ploegh H.L., Bassik M.C., et al. Genome-scale CRISPR-mediated control of gene repression and activation. Cell. 2014;159:647–661. doi: 10.1016/j.cell.2014.09.029. [DOI] [PMC free article] [PubMed] [Google Scholar]
- 10.Thakore P.I., D'Ippolito A.M., Song L., Safi A., Shivakumar N.K., Kabadi A.M., Reddy T.E., Crawford G.E., Gersbach C.A. Highly specific epigenome editing by CRISPR-Cas9 repressors for silencing of distal regulatory elements. Nat. Methods. 2015;12:1143–1149. doi: 10.1038/nmeth.3630. [DOI] [PMC free article] [PubMed] [Google Scholar]
- 11.O'Geen H., Yu A.S., Segal D.J. ScienceDirect How specific is CRISPR/Cas9 really. Curr. Opin. Chem. Biol. 2015;29:72–78. doi: 10.1016/j.cbpa.2015.10.001. [DOI] [PMC free article] [PubMed] [Google Scholar]
- 12.Xu H., Xiao T., Chen C.-H., Li W., Meyer C.A., Wu Q., Wu D., Cong L., Zhang F., Liu J.S., et al. Sequence determinants of improved CRISPR sgRNA design. Genome Res. 2015;25:1147–1157. doi: 10.1101/gr.191452.115. [DOI] [PMC free article] [PubMed] [Google Scholar]
- 13.Evers B., Jastrzebski K., Heijmans J.P.M., Grernrum W., Beijersbergen R.L., Bernards R. CRISPR knockout screening outperforms shRNA and CRISPRi in identifying essential genes. Nat. Biotechnol. 2016;34:631–633. doi: 10.1038/nbt.3536. [DOI] [PubMed] [Google Scholar]
- 14.Langmead B., Trapnell C., Pop M., Salzberg S.L. Ultrafast and memory-efficient alignment of short DNA sequences to the human genome. Genome Biol. 2009;10:R25. doi: 10.1186/gb-2009-10-3-r25. [DOI] [PMC free article] [PubMed] [Google Scholar]
- 15.Quinlan A.R., Hall I.M. BEDTools: a flexible suite of utilities for comparing genomic features. Bioinformatics. 2010;26:841–842. doi: 10.1093/bioinformatics/btq033. [DOI] [PMC free article] [PubMed] [Google Scholar]
- 16.ENCODE Project Consortium. An integrated encyclopedia of DNA elements in the human genome. Nature. 2012;489:57–74. doi: 10.1038/nature11247. [DOI] [PMC free article] [PubMed] [Google Scholar]
- 17.Kent W.J., Zweig A.S., Barber G., Hinrichs A.S., Karolchik D. BigWig and BigBed: enabling browsing of large distributed datasets. Bioinformatics. 2010;26:2204–2207. doi: 10.1093/bioinformatics/btq351. [DOI] [PMC free article] [PubMed] [Google Scholar]
- 18.Pruitt K.D., Tatusova T., Maglott D.R. NCBI Reference Sequence (RefSeq): a curated non-redundant sequence database of genomes, transcripts and proteins. Nucleic Acids Res. 2005;33:D501–D504. doi: 10.1093/nar/gki025. [DOI] [PMC free article] [PubMed] [Google Scholar]
- 19.Pruitt K.D., Tatusova T., Brown G.R., Maglott D.R. NCBI Reference Sequences (RefSeq): current status, new features and genome annotation policy. Nucleic Acids Res. 2012;40:D130–D135. doi: 10.1093/nar/gkr1079. [DOI] [PMC free article] [PubMed] [Google Scholar]
- 20.Cochrane G., Karsch-Mizrachi I., Nakamura Y., International Nucleotide Sequence Database Collaboration The International Nucleotide Sequence Database Collaboration. Nucleic Acids Res. 2011;39:D15–D18. doi: 10.1093/nar/gkq1150. [DOI] [PMC free article] [PubMed] [Google Scholar]
- 21.O'Leary N.A., Wright M.W., Brister J.R., Ciufo S., Haddad D., McVeigh R., Rajput B., Robbertse B., Smith-White B., Ako-Adjei D., et al. Reference sequence (RefSeq) database at NCBI: current status, taxonomic expansion, and functional annotation. Nucleic Acids Res. 2016;44:D733–D745. doi: 10.1093/nar/gkv1189. [DOI] [PMC free article] [PubMed] [Google Scholar]
- 22.Benson D.A., Clark K., Karsch-Mizrachi I., Lipman D.J., Ostell J., Sayers E.W. GenBank. Nucleic Acids Res. 2015;43:D30–D35. doi: 10.1093/nar/gku1216. [DOI] [PMC free article] [PubMed] [Google Scholar]
- 23.Hsu F., Kent W.J., Clawson H., Kuhn R.M., Diekhans M., Haussler D. The UCSC Known Genes. Bioinformatics. 2006;22:1036–1046. doi: 10.1093/bioinformatics/btl048. [DOI] [PubMed] [Google Scholar]
- 24.Consortium UniProt. The Universal Protein Resource (UniProt) Nucleic Acids Res. 2007;35:D193–D197. doi: 10.1093/nar/gkl929. [DOI] [PMC free article] [PubMed] [Google Scholar]
- 25.Kent W.J., Sugnet C.W., Furey T.S., Roskin K.M., Pringle T.H., Zahler A.M., Haussler D. The human genome browser at UCSC. Genome Res. 2002;12:996–1006. doi: 10.1101/gr.229102. [DOI] [PMC free article] [PubMed] [Google Scholar]
- 26.Flicek P., Amode M.R., Barrell D., Beal K., Brent S., Chen Y., Clapham P., Coates G., Fairley S., Fitzgerald S., et al. Ensembl 2011. Nucleic Acids Res. 2011;39:D800–D806. doi: 10.1093/nar/gkq1064. [DOI] [PMC free article] [PubMed] [Google Scholar]
- 27.Harrow J., Frankish A., Gonzalez J.M., Tapanari E., Diekhans M., Kokocinski F., Aken B.L., Barrell D., Zadissa A., Searle S., et al. GENCODE: the reference human genome annotation for The ENCODE Project. Genome Res. 2012;22:1760–1774. doi: 10.1101/gr.135350.111. [DOI] [PMC free article] [PubMed] [Google Scholar]
- 28.Kanamori-Katayama M., Itoh M., Kawaji H., Lassmann T., Katayama S., Kojima M., Bertin N., Kaiho A., Ninomiya N., Daub C.O., et al. Unamplified cap analysis of gene expression on a single-molecule sequencer. Genome Res. 2011;21:1150–1159. doi: 10.1101/gr.115469.110. [DOI] [PMC free article] [PubMed] [Google Scholar]
- 29.FANTOM Consortium and the RIKEN PMI and CLST (DGT) Forrest A.R.R., Kawaji H., Rehli M., Baillie J.K., de Hoon M.J.L., Haberle V., Lassmann T., Kulakovskiy I.V., Lizio M., et al. A promoter-level mammalian expression atlas. Nature. 2014;507:462–470. doi: 10.1038/nature13182. [DOI] [PMC free article] [PubMed] [Google Scholar]
- 30.Lenhard B., Sandelin A., Carninci P. Metazoan promoters: emerging characteristics and insights into transcriptional regulation. Nat. Rev. Genet. 2012;13:233–245. doi: 10.1038/nrg3163. [DOI] [PubMed] [Google Scholar]
- 31.Isaac R.S., Jiang F., Doudna J.A., Lim W.A., Narlikar G.J., Almeida R.A. Nucleosome breathing and remodeling constrain CRISPR-Cas9 function. Elife. 2016;5:e13450. doi: 10.7554/eLife.13450. [DOI] [PMC free article] [PubMed] [Google Scholar]
- 32.Horlbeck M.A., Witkowsky L.B., Guglielmi B., Replogle J.M., Gilbert L.A., Villalta J.E., Torigoe S.E., Tjian R., Weissman J.S. Nucleosomes impede Cas9 access to DNA in vivo and in vitro. Elife. 2016;5:e12677. doi: 10.7554/eLife.12677. [DOI] [PMC free article] [PubMed] [Google Scholar]
- 33.Roy A.L., Singer D.S. Core promoters in transcription: old problem, new insights. Trends Biochem. Sci. 2015;40:165–171. doi: 10.1016/j.tibs.2015.01.007. [DOI] [PMC free article] [PubMed] [Google Scholar]
- 34.Groner A.C., Meylan S., Ciuffi A., Zangger N., Ambrosini G., Dénervaud N., Bucher P., Trono D. KRAB-zinc finger proteins and KAP1 can mediate long-range transcriptional repression through heterochromatin spreading. PLoS Genet. 2010;6:e1000869. doi: 10.1371/journal.pgen.1000869. [DOI] [PMC free article] [PubMed] [Google Scholar]
- 35.Kuscu C., Arslan S., Singh R., Thorpe J., Adli M. Genome-wide analysis reveals characteristics of off-target sites bound by the Cas9 endonuclease. Nat. Biotechnol. 2014;32:677–683. doi: 10.1038/nbt.2916. [DOI] [PubMed] [Google Scholar]
- 36.Wu X., Scott D.A., Kriz A.J., Chiu A.C., Hsu P.D., Dadon D.B., Cheng A.W., Trevino A.E., Konermann S., Chen S., et al. Genome-wide binding of the CRISPR endonuclease Cas9 in mammalian cells. Nat. Biotechnol. 2014;32:670–676. doi: 10.1038/nbt.2889. [DOI] [PMC free article] [PubMed] [Google Scholar]
- 37.O'Geen H., Henry I.M., Bhakta M.S., Meckler J.F., Segal D.J. A genome-wide analysis of Cas9 binding specificity using ChIP-seq and targeted sequence capture. Nucleic Acids Res. 2015;43:3389–3404. doi: 10.1093/nar/gkv137. [DOI] [PMC free article] [PubMed] [Google Scholar]
Associated Data
This section collects any data citations, data availability statements, or supplementary materials included in this article.