

SUMMARY
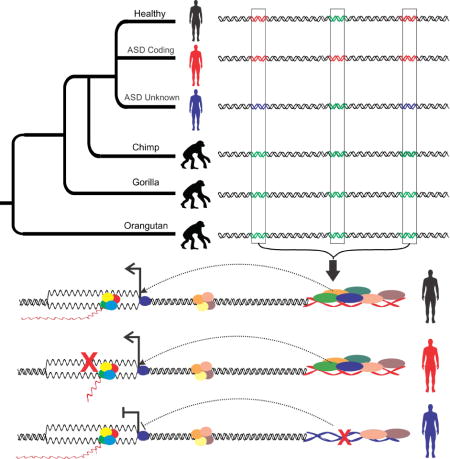
Comparative analyses have identified genomic regions potentially involved in human evolution, but do not directly assess function. Human accelerated regions (HARs) represent conserved genomic loci with elevated divergence in humans. If some HARs regulate human-specific social and behavioral traits, then mutations would likely impact cognitive and social disorders. Strikingly, rare biallelic point mutations–identified by whole genome and targeted “HAR-ome” sequencing–showed a significant excess in individuals with ASD whose parents share common ancestry compared to familial controls, suggesting a contribution in 5% of consanguineous ASD cases. Using chromatin interaction sequencing, massively parallel reporter assays (MPRA), and transgenic mice, we identified disease-linked, biallelic HAR mutations in active enhancers for CUX1, PTBP2, GPC4, CDKL5, and other genes implicated in neural function, ASD, or both. Our data provide genetic evidence that specific HARs are essential for normal development, consistent with suggestions that their evolutionary changes may have altered social and/or cognitive behavior.
Graphical abstract
INTRODUCTION
The complex social and cognitive behaviors that characterize modern humans—including language, civilization, and society—reflect human-specific neurodevelopmental mechanisms that have both genetic and cultural roots (Miller et al., 2012; Somel et al., 2013). The ability of comparative genomics to identify loci that are highly different between humans and other species promises to allow their association to some of these human-specific traits (McLean et al., 2011). The accelerated divergence of HARs between humans and other species has been suggested to reflect potential roles in the evolution of human-specific traits (Bird et al., 2007; Bush and Lahn, 2008; Capra et al., 2013; Lindblad-Toh et al., 2011; Pollard et al., 2006a; Prabhakar et al., 2008). The ultimate functional test of the importance of HARs comes in assessing the impact of deleterious mutations in HAR sequences, and virtually nothing is known about any potential functional effects of HAR mutations. Association of functional HAR mutations with disorders of cognition or social behavior could provide novel insights not only into the pathogenesis of important human disorders, but also into the mechanisms by which human-specific patterns of social and cognitive behavior originated.
The apparent loss of negative evolutionary pressure on HARs between humans and other primates could reflect any of three potential processes: neutral substitutions accumulating in sequences that have lost essential function, GC-biased gene conversion events, or a switch from strictly negative selection to include positive selection. Variation in healthy individuals and close hominin relatives suggests that rare mutations in HARs are generally deleterious, reflected in a paucity of recent alleles (i.e., non-ancestral alleles, 8.3%) and fixation of 96% of ancestral alleles (Burbano et al., 2012). Nonetheless it appears that at least some HARs underwent a switch to positive selection in humans, possibly followed by a switch back to negative selection within stable human populations.
Several recent studies have elucidated potential functions of HARs using in-silico predictions and animal models. Most HARs lie within 1Mb of a gene, and show enrichment for CTCF binding, suggesting that some HARs act as transcriptional enhancers through physical contact with promoters (Capra et al., 2013). Other HARs appear to encode RNAs, such as HAR1 (Pollard et al., 2006b). The enrichment of epigenetic signatures suggests that 29% of HARs function as enhancers during brain, heart, and limb development (Capra et al., 2013). Transgenic constructs encoding human or chimpanzee HAR sequences revealed species-specific functionality through expression levels, or in some cases changes in anatomical regions of expression (Capra et al., 2013). Nonetheless, definitive proof of essential HARs requires the characterization of functional HAR mutations in humans, i.e., by the association with genetic disease.
In recent years focus on regulatory mutations causing disease has increased, resulting in the identification of a handful of noncoding mutations. Unlike coding mutations, which are most often loss-of-function, regulatory mutations have potential to be activating or inactivating of gene transcription in specific tissues (Bae et al., 2014; Weedon et al., 2014), typically due to gain or loss of essential TF motifs. Regulatory mutations, including both biallelic and heterozygous, underlie a variety of human diseases (Weedon et al., 2014). The strong preservation of HARs between species identifies them as likely to be genetically essential, and hence as favorable targets to identify undiscovered disease-associated mutations.
A subset of HARs show evidence of neural function, with several within loci with significant associations to schizophrenia (Xu et al., 2015). Furthermore, GABAergic and glutamatergic genes were enriched among the HAR-associated schizophrenia genes. Interestingly, HAR-associated genes were enriched for processes involved in synaptic formation and exhibit a higher connectivity to regulatory networks in the prefrontal cortex (Xu et al., 2015). An intronic HAR with enhancer activity within AUTS2, a gene linked to ASD (Oksenberg et al., 2013), suggests that HAR variants could result in ASD, but no HAR mutations have yet been associated with any neurological diseases.
We utilized existing genomic data from healthy individuals and the Epigenomics Roadmap to demonstrate essential regulatory functions of HARs, particularly in neural tissues. We also performed 4C-sequencing, in combination with existing interaction data, to provide the first systematic map of target genes for more than 500 HARs. We investigated the mutational landscape of HARs by comparing de novo copy number variations (CNV) and biallelic point mutations in individuals with ASD and healthy controls, revealing a significant contribution of both to ASD risk. We identify several specific HARs likely to have essential functions in human brain that are potentially important targets of recent human brain evolution.
RESULTS
HARs are functionally constrained
We investigated HARs for evidence of transcriptional regulatory functions by first defining their mutational landscape in healthy, diverse human populations. We identified 2,737 HARs from several recent publications (Bird et al., 2007; Bush and Lahn, 2008; Lindblad-Toh et al., 2011; Pollard et al., 2006a; Pollard et al., 2006b; Prabhakar et al., 2008) (Table S1). Due in part to the identification methods, most HARs lie in intergenic and intronic noncoding regions (Figure S1), although several overlap promoters (48), or noncoding RNAs and pseudogenes (135). Within the Complete Genomics Diversity Panel (CG69) and low-coverage 1000 Genomes project (1000G), individual “HAR-omes” contain an average of 1,273 variants, with a 2-fold depletion of rare variants compared to coding, noncoding-conserved, and randomly selected loci (2.1% vs. 4.5%, p=4.2×10−44; 5.2%, p=4.7×10−70; and 4.8%, p=2.0×10−76; Table S2, Figure 1a). While common HAR alleles exhibit a significant elevation in homozygosity (Figure 1b, Figure S2), rare alleles are depleted for homozygosity, particularly for conserved nucleotides where they behave similar to coding mutations, suggesting possible damaging effects (Figure 1c).
Figure 1. Evidence of selective pressures due to regulatory functionality of HARs.
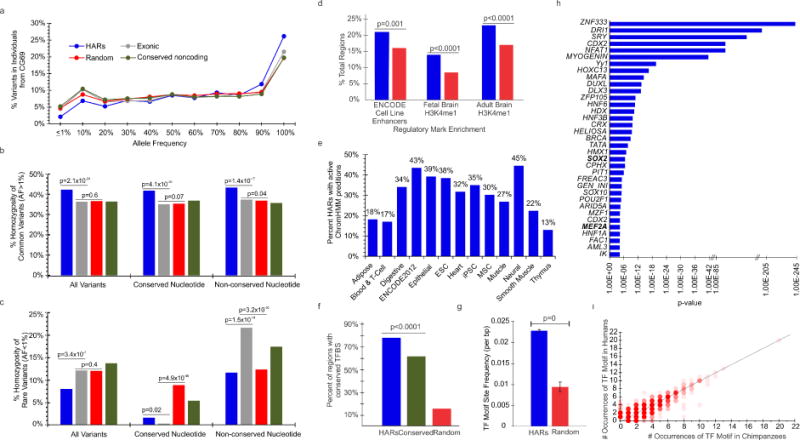
a)Average distribution of variants by maximum AF in CG69. Average homozygosity in CG69 for all, conserved, and non-conserved nucleotides for b) common and c) rare variants. d) HARs are significantly enriched for regulatory marks in fetal and adult brain (Dunham et al., 2012; Roadmap Epigenomics et al., 2015) with the greatest activity e) in neural tissues. HARs are enriched for f) conserved TF motifs (10,000 random samples) and g) frequency of predicted motifs. h) Enrichment of TF motifs within HARs as determined against random sequences by TRANSFAC. i) Human specific alleles in HARs alter TF motifs in comparison to chimpanzee. See also Figures S1, S2, and Tables S1, S2.
To explore whether HAR variants occur at human-specific bases, we compared alleles from 1000G to their respective chimpanzee base, revealing that 11% occur at human-specific nucleotides within 1,401 HARs. While human-specific sites account for about 2% of HAR nucleotides, they are enriched for point mutations, including 690 rare alleles (2,255 of 12,973 sites; OR=6.6, 95% CI 6.3–6.9, p<10−4), and display evidence of evolutionary constraint (i.e., fewer substitutions than expected by neutral models; average GERP-RS=2.23) (Cooper et al., 2005). While enrichment of alleles at human-specific sites might represent recent mutational events or, more likely, polymorphic non-accelerated sites, 365 alleles do not revert to ancestral alleles suggesting that a portion have been subject to recent mutations.
HARs are enriched for neural regulatory elements
We expanded recent in silico predictions of developmental activity (Capra et al., 2013) by utilizing DNAse I sensitivity, histone profiles, ChromHMM (Roadmap Epigenomics et al., 2015) segmentations, and in-silico motif predictions. HARs show significant enrichment for fetal and adult brain H3K4me1 profiles (p<0.0001), suggesting activity in the brain (Figure 1d). Furthermore, 81% of HARs overlapped marks of active transcription, promoters, or enhancers, including 45% in neural samples from ChromHMM (Figure 1e, Table S1), with many displaying tissue specificity (i.e., 168 in neural tissues).
We sought to define the TF motif landscape of HARs beyond the known enrichment for conserved TF sites [TFBS, (Capra et al., 2013; Pollard et al., 2006a)]. HARs were enriched for TFBSs (78%, p<0.0001, random sampling Figure 1f) and high-quality predicted matrices [2.5-fold increase, 15,989 sites (Figure 1g)]. Several enriched motifs are involved in neural developmental processes including MEF2A (p=4.8×10⁻⁵) and SRY-related HMG-box gene 2 (SOX2) (p=2.9×10⁻⁷) (Figure 1h), while others like ZNF333 show broader expression. SOX2 is expressed in stem cells, where it is essential for renewal of neural progenitors (Ferri et al., 2004; Kelberman et al., 2008). Upon decreased SOX2 expression, neural progenitors differentiate into neurons. The enrichment of SOX2 motifs supports a role in neural development, particularly during neurogenesis. Human-specific nucleotides altered the frequencies of some motifs (54 increased, 72 decreased, Figure 1i), including REST, CTCF, and NFIA. This divergence of TF motifs may reveal human-specific processes in cortical development.
Many HARs act as regulatory elements for dosage-sensitive and constrained neural genes
We combined existing ChIA-PET and HiC data (Goh et al., 2012; Jin et al., 2013; Li et al., 2010; Li et al., 2012) to map 576 HARs to promoter regions of more than 700 target genes, including 123 interactions with lncRNAs [(Ma et al., 2015) Table S1]. More than 42% of HARs interact with flanking gene promoters, suggesting that proximity is generally a good predictor of HAR target genes in lieu of cell-type specific interaction data. Of the 132 target genes overlapping OMIM disorders, 28 associate with ASD/ID (p=0.008, random sampling, Table S3, Figure 2a) and 38 cause neural phenotypes in mice. Since regulatory elements alter gene expression levels, not protein structure, we hypothesized that, for pathogenicity, target genes should be dosage sensitive, i.e., haploinsufficiency (HI). Indeed, the HI (Huang et al., 2010) of flanking and target genes are significantly elevated (i.e., dosage sensitive; HI=0.35, p=3.8×10−38; HI=0.34, p=9.0×10⁻¹³; T-Test; Figure 2b). The elevated dosage sensitivity is especially prominent for genes flanking neurally active HARs (HI=0.42, p=4.5×10⁻¹⁴, T-Test; Figure 2b). In comparison, sampling of conserved noncoding and random genomic elements revealed an average HI of 0.33 and 0.31, respectively. Additionally, gene constraint scores (pLI) (Lek et al., 2015) of flanking and target genes are elevated (pLI=0.42, p<0.001; and 0.40, p<0.001; random sampling). Together, HI and pLI scores suggest that HARs might provide a novel source of dosage regulation for highly constrained and haplosensitive genes.
Figure 2. HARs regulate dosage-sensitive genes involved in neural development.

a) Overlap of HAR associated and target genes with genes linked to ASD/ID and neural mouse phenotypes. b) Comparison of haploinsufficiency scores (Huang et al., 2010) across all genes, HAR associated genes, and HARs with predicted developmental brain regulatory activity (Capra et al., 2013). c) Mammalian phenotypes enriched within HAR genes. d) Enriched biological processes and mammalian phenotypes within HAR associated and target genes (Enrichr). See also Tables S3, S4.
The constraint of genes flanking (i.e., closest upstream and downstream) HARs suggests an important role and possibly an enrichment in specific essential biological functions. Consistent with prior studies, HAR genes were enriched for involvement in neural development, neuronal differentiation, and axonogenesis (Figure 2d, Table S4). Even more, HAR genes are highly enriched for mammalian phenotypes such as abnormal brain morphology (p=2.3×10⁻²⁷, Figure 2c). Strikingly, genes near HARs were enriched for associations in the Genetic Association Database of Diseases with ASD (p=0.03), schizophrenia (p=0.001), and autonomic nervous system functions (p=0.01) including AUTS2, CDKL5, FOXP1, MEF2C, NRXN1, and SMARCA2.
HARs in de novo CNVs associated with ASD
The functional characteristics of HARs suggest that, when mutated, they have the potential to negatively impact behavioral and cognitive functions. Our analysis of CNVs in 2100 sibling-matched ASD probands from the Simons Simplex Collection (Sanders et al., 2015) identified rare, de novo CNVs involving HAR’s to be enriched 6.5-fold–a 2-fold greater excess than reported for all de novo CNVs–with 2.1% (45 of 2100) probands versus 0.3% (7 of 2100) siblings harboring a rare, de novo event (p<0.0001, Figure 3a). In comparison, no significant difference was observed for inherited HAR-containing CNVs. Gender analyses revealed an excess of de novo CNVs affecting HARs in females (OR 2.48, p=0.008), but no significant difference for unaffected individuals (p=0.4). While many reported CNVs are large and impact genes, we identified two intergenic de novo HAR-containing CNVs in probands, but none in healthy siblings. Interestingly, a de novo duplication is located 300kb upstream of nuclear receptor subfamily 2, group F, member 2 (NR2F2 or COUP-TFII), where existing data reveals an interaction between the NR2F2 promoter and the duplicated HAR (Figure 3b). CNVs of NR2F2 occur in individuals with ASD and ID, as well as heart defects (Nava et al., 2014). NR2F2 is highly expressed in the caudal ganglionic eminence and migrating interneurons (Kanatani et al., 2015), and is downregulated as interneurons enter the cerebral cortex. Therefore, abnormal NR2F2 expression may disrupt interneuron migration. Our data suggest that de novo CNV’s affecting HARs, or HAR-containing genes, could be implicated in up to 1.9% of ASD cases in simplex families.
Figure 3. Enrichment of rare de novo CNVs and biallelic point mutations in individuals with ASD.
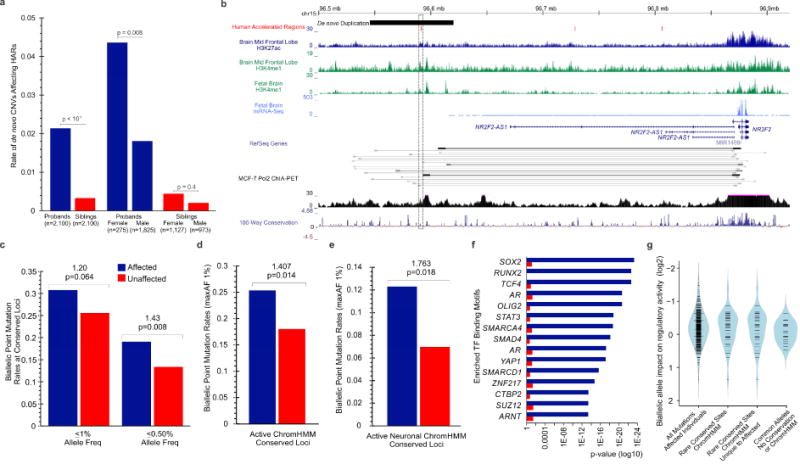
a) Excess of affected individuals with de novo CNVs affecting HARs. b) Intergenic de novo duplication approximately 250kb upstream of NR2F2 with existing ChIA-PET data indicating direct interaction between HAR and gene promoter. c) Excess biallelic mutations arising from the rarest alleles, including d) conserved loci within active regulatory elements (maxAF<1%) and within e) active neural regulatory elements. Transcription factor binding enrichment for target and associated genes of rare biallelic mutations (maxAF<1%) in f) affected and unaffected individuals. g) Increased impact of rare biallelic mutations in affected individuals at conserved sites using MPRA assay in primary mouse neurospheres. See also Figure S3 and Tables S5, S6, S7.
Enrichment of biallelic point mutations in neurally active HARs
We assessed the impact of biallelic HARs mutations on ASD pathogenesis in 218 families enriched for consanguinity (mostly 1st cousin marriages) with one or more children with ASD, as such offspring are enriched for recessive mutations (Morrow et al., 2008; Yu et al., 2013). We analyzed WGS from 30 affected and 5 unaffected individuals, and designed a custom “HAR-ome” capture array to sequence HARs in the others (188 affected and 172 unaffected, Table S6), covering 99% of targets with average read depth of 175X. Individuals possessed an average of 1,168 HAR variants (1,027 SNVs and 141 INDELs), of which at least 98% were common (MAF>1%) within the population. The level of homozygosity (44%) was similar to constrained CG69 populations (e.g., Han Chinese, 43%), with a depletion of rare homozygous alleles.
While common HAR variants may contribute to ASD risk, we sought to quantitate an effect for rare biallelic mutations. Considering that biallelic mutation rates can be confounded by background homozygosity despite using healthy family members as controls, we used the bulk HAR mutation rate to correct for effects between affected and unaffected family members. Individuals with ASD exhibited an excess of rare (AF <0.5%) biallelic HAR alleles (43% excess versus unaffected, p=0.008, random sampling; Figure 3c, Figure S3). The mutational excess increased within active ChromHMM regulatory marks (Roadmap Epigenomics et al., 2015) (ascertainment differential, AD=0.07, 41% excess versus unaffected, p=0.014, random sampling; Figure 3d). Strikingly, active neural elements harbored a 1.76-fold excess (AD=0.05) of rare biallelic HAR mutations (p=0.018, random sampling, Figure 3e), suggesting up to 42% may contribute to ASD in ≈ 5% of ASD cases. In comparison, non-neural ChromHMM conserved and non-conserved loci did not exhibit an excess (0.13 vs 0.11, p=0.246; 0.12 vs 0.11, p=0.367), suggesting that signal arising from neurally active HARs is not from unaccounted-for background population structure. Though our data do not distinguish highly penetrant mutations from risk alleles of more modest penetrance, these data expand, for the first time, the role of biallelic mutations in ASD by strongly implicating HARs.
Functional characterization of HARs with rare homozygous alleles revealed a significant enrichment for 13 TFBS motifs including HMX1 (p=9.7×10⁻⁶), BBX (p=5.8×10⁻³), and CDX2 (p=3.3×10⁻⁵). Strikingly, genes flanking candidate mutations are highly enriched for interactions with essential TFs involved in cerebral and hippocampal development such as SOX2 (p=4.8×10⁻²⁴ vs. 0.07 in controls), OLIG2 (p=2.1×10⁻²¹ vs. 0.2 in controls), and SMARCA4 (p=2.0×10⁻¹⁹ vs. 0.07 in controls, Figure 3f). Even more, 70% of genes associated with candidate HAR mutations are expressed in the brain and enriched for ASD (19 of 140, p=0.02), abnormal brain morphology phenotypes (p=0.001) and perinatal lethality (p=0.001), suggesting an impact on cerebral cortical neurogenesis.
We assessed the functional impact of 343 biallelic mutations in affected individuals (85 with AF<0.01) in primary mouse neurospheres using a custom MPRA assay (Melnikov et al., 2012). A greater portion of rare alleles at conserved loci with predicted regulatory function altered activity than those at nonconserved nucleotides which lacked ChommHMM predictions (35% vs 10%, p=0.02, Fisher’s Exact, 2-sided, Figure 3g, Table S7). While burden analyses implicate 31% of rare conserved biallelic mutations in neurally active HARs in ASD, remarkably, 29% of such mutations altered regulatory activity by MPRA (19% decreased, 10% increased activity). The enrichment of regulation-altering mutations in HARs with predicted activity suggests that many may contribute to the pathogenesis and diversity of ASD.
We also identified 335 ultra-conserved HARs, completely devoid of mutations within our ASD cohort, which were enriched for neural activity (143/335, p=0.02) and neurodevelopmental processes (Table S5). Of these HARs, 75 lacked mutation in 1000G samples. We find TF motifs for neural developmental TFs POU6F1 (5-fold increase, p=2.7×10⁻⁶) and POU2F1 (11-fold increase, p=3.2×10⁻³) are highly enriched. Even more, 79% (59 of the 75) exhibit regulatory activity in at least one cell type, including 40 in neural tissues (53%). This intriguing subset of HARs could reveal essential functions, potentially relating to more severe brain abnormalities when mutated.
HAR mutation affecting CUX1
We identified several rare homozygous mutations with active regulatory marks that were proximal to known neurodevelopmental and disease-associated genes (Table 1) in patients who lacked plausibly causative coding mutations. One such HAR mutation is a rare G>A mutation within HAR426 (Prabhakar et al., 2008), for which existing ChIA-Pet data shows an interaction with the dosage sensitive (pLI=1.0) CUX1 promoter 200kb distal (Figure 4a–c). The mutation was homozygous in 3 affected individuals from two unrelated consanguineous families of 1st cousin parents, one with two sons with ASD and IQs below 40 (AU-20400) and the other family having one daughter with ASD and an IQ below 40 (AU-13100). Linkage analysis revealed a linked region encompassing CUX1 in both families (AU-20400, LOD=1.81; AU-13200, LOD=1.33), but no shared candidate exonic mutations. The HAR mutation occurs only rarely in healthy individuals (1000G, MAF 9.8×10⁻⁴; Middle Eastern controls, MAF 0.5%), and only heterozygously, and is located within a methylated CpG dinucleotide. Interestingly, the mutation is predicted to create several TF motifs (Figure 4de). CUX1 encodes a vertebrate homologue of Drosophila Cut, a classical gene with both gain and loss-of-function effects on neuronal morphology and regulation of synaptic spine density in flies as well as mammalian cortical neurons (Cubelos et al., 2014; Cubelos et al., 2010; Grueber et al., 2003).
Table 1. Identification of candidate HAR mutations.
The location of the HAR mutations with target genes and location relative to refSeq gene annotations with () indicating brain expression. Expression profiles were obtained from BrainSpan’s normalized LCM microarray values of the developing and adult human brain (Hughes-Benzie et al., 1996).
| Location (hg19) | Reference Allele | Alternate Allele | Gene Location | Interacting Gene* (brain expression) | Potential Target Genes (normalized brain expression level) | Family ID | Predicted Regulatory Activity+ | Phenotype | Diseases & Function |
|---|---|---|---|---|---|---|---|---|---|
| 7:101249641 | G | A | Intergenic | CUX1 (26.5) | LINC01007,MYL1 0 (0.3) | AU-20400 AU-13200 |
Brain enhancer | ASD with ID, (Epilepsy in 1 child) | Regulates synaptic spines and dendritic complexity in upper cortical layers (CUX1)(Cubelos et al., 2014; Nieto et al., 2004) |
| 5:87776690 | T | G | Intergenic | MEF2C (323.5), TMEM161B (2.9) | LINC00461 (88.0) | AU-9200 | Brain enhancer | ASD with ID, dysmorphic features (small pointed chin, large ears) | ASD, ID, dysmorphic features (e.g., small chin, prominent forehead, large ears)(Bienvenu et al., 2013; Morrow et al., 2008) |
| 1:97463563 | TGGGTAC | TA | Intergenic | PTBP2 (62.5) | DPYD (4.0) | AU-4700 | Brain enhancer | ASD with ID | Brain-specific splicing regulator; regulates neurogenesis; locus associated with ID (PTBP2) |
| X:132496780 | T | C | Intronic | GPC4 (89.9) | AU-16100 | Brain enhancer | ASD with ID | Regulates synapses (Kalscheuer et al., 2003); Simpson-Golabi-Behmel syndrome (ID in 47%)(Hughes-Benzie et al., 1996) | |
| X:132496834 | GT | G | Intronic | GPC4 (89.9) | AU-23200 | Brain enhancer | ASD with ID, Epilepsy, ACC | ||
| X:18445494 | G | GAGCTGTAG | Promoter | CDKL5 (28.7) | AU-13500 AU022203 | Brain enhancer | ASD with ID | Autism, Rett Syndrome, epilepsy and Angelman syndrome(Avino and Hutsler, 2010; Hutsler and Casanova, 2015) | |
| 4:145793760 | C | T | Intergenic | HHIP (13.8),ANAPC10 (5.0) | AU-13700 | Enhancer (stem cell, fetal lung) | ASD with ID | Deletion associated with ID (ANAPC10) | |
| 7:39073195 | T | TC | Intronic | POU6F2 (4.4),VPS41 (27.6) | AU-19000 | Brain enhancer | ASD | Strong association to ASD in GWAS and Wilms Tumor (POU6F2)(Mizuno et al., 2006) | |
| 17:55675858 | C | G | Intronic | USP32 (22.3) | MSI2 (21.1) | AU-24600 | Brain enhancer | ASD with ID | Regulation of neural precursors during CNS development (MSI2)(Gusev et al., 2014) |
| X:136372832 | C | T | Intergenic | GPR101 (11),ZIC3 (57.8) | AU-21500 | Repressed Polycomb (brain) | PDD-NOS, ADHD | Involved in adrenergic receptor activity in brain (GPR101); X-linked visceral heterotaxy and cerebellar dysgenesis (ZIC3) | |
| 4:30653187 | T | G | Intergenic | MIR4275,PCDH7 (29.7) | AU-5000 | Low H3K9ac in derived neural progenitor | ASD | Possible ASD; high expression in developing brain; regulated by MECP2 during establishment of synaptic connections (PCDH7) | |
| 5:39527315 | G | A | Intergenic | DAB2 (7.9) | PTGER4 (4.3) | AU-26800 | Enhancer: HESC, Mesendoderm, Trophoblast | ASD with ID | Essential for embryonic development (DAB2) |
Interacting genes determined from 4C-sequencing, ChIA-Pet (Fullwood et al., 2010; Li et al., 2010) and HiC data (Jin et al., 2013). The interaction distances are limited to 1Mb. Potential interacting genes represent those containing intronic HARs and, for intergenic HARs, the closest flanking upstream and downstream genes without clear link to HAR in existing chromatin interaction data. +Predicted regulatory activity was determined using Capra et. al. and ChromHMM predictions from Epigenomics Roadmap. See also Figure S5.
Avino, T.A., and Hutsler, J.J. (2010). Abnormal cell patterning at the cortical gray-white matter boundary in autism spectrum disorders. Brain research 1360, 138–146.
Bienvenu, T., Diebold, B., Chelly, J., and Isidor, B. (2013). Refining the phenotype associated with MEF2C point mutations. Neurogenetics 14, 71–75.
Cubelos, B., Briz, C.G., Esteban-Ortega, G.M., and Nieto, M. (2014). Cux1 and Cux2 selectively target basal and apical dendritic compartments of layer II–III cortical neurons. Developmental neurobiology.
Gusev, A., Lee, S.H., Trynka, G., Finucane, H., Vilhjalmsson, B.J., Xu, H., Zang, C., Ripke, S., Bulik-Sullivan, B., Stahl, E., et al. (2014). Partitioning heritability of regulatory and cell-type-specific variants across 11 common diseases. American journal of human genetics 95, 535–552.
Hughes-Benzie, R.M., Pilia, G., Xuan, J.Y., Hunter, A.G., Chen, E., Golabi, M., Hurst, J.A., Kobori, J., Marymee, K., Pagon, R.A., et al. (1996). Simpson-Golabi-Behmel syndrome: genotype/phenotype analysis of 18 affected males from 7 unrelated families. American journal of medical genetics 66, 227–234.
Hutsler, J.J., and Casanova, M.F. (2015). Cortical Construction in Autism Spectrum Disorder: Columns, Connectivity and the Subplate. Neuropathology and applied neurobiology.
Kalscheuer, V.M., Tao, J., Donnelly, A., Hollway, G., Schwinger, E., Kubart, S., Menzel, C., Hoeltzenbein, M., Tommerup, N., Eyre, H., et al. (2003). Disruption of the serine/threonine kinase 9 gene causes severe X-linked infantile spasms and mental retardation. American journal of human genetics 72, 1401–1411.
Mizuno, A., Villalobos, M.E., Davies, M.M., Dahl, B.C., and Muller, R.A. (2006). Partially enhanced thalamocortical functional connectivity in autism. Brain research 1104, 160–174.
Morrow, E.M., Yoo, S.Y., Flavell, S.W., Kim, T.K., Lin, Y., Hill, R.S., Mukaddes, N.M., Balkhy, S., Gascon, G., Hashmi, A., et al. (2008). Identifying autism loci and genes by tracing recent shared ancestry. Science 321, 218–223.
Nieto, M., Monuki, E.S., Tang, H., Imitola, J., Haubst, N., Khoury, S.J., Cunningham, J., Gotz, M., and Walsh, C.A. (2004). Expression of Cux-1 and Cux-2 in the subventricular zone and upper layers II–IV of the cerebral cortex. The Journal of comparative neurology 479, 168–180.
Figure 4. Autism-linked HAR variant increases human CUX1 promoter activity in all cortical layers.

Two unrelated consanguineous families, a) AU-20400 and b) AU-13200 with c) homozygous mutation within long distance regulatory element of CUX1 within a methylated CpG marked by the presence of H3K4me1 in neuronal cell types. ChIA-PET (Fullwood et al., 2010; Li et al., 2010) data demonstrates interaction of HAR with promoter of CUX1. The mutation alters d) TF motifs in the reference genome by e) adding additional motifs. f) The G>A CUX1 interacting mutation results in a 2-fold increase in CUX1 promoter activity in N2A cells (neural precursor-like condition) and 2.5-fold increase in the presence of dominant-negative (DN) REST (neuronal-like condition). g) Dendritic filopodia and spines of control and Cux1 overexpressing neurons co-transfected with GFP plasmid. Bar represents 2μm. Quantifications show that Cux1 overexpression results in i) increased spine density than compared to controls and that this increase is markedly higher when treated with 4AP/BIC. Cux1 overexpression also results in h) significant increase in spine head surface area. Student’s t test p-value * ≤ 0.01; ** ≤ 0.0001 compared to control. j) Mutant A allele (Mt-A) HAR increases transcriptional activity of human CUX1 promoter linked to GFP reporter, compared to wild-type G allele (Wt-G) HAR, in E16.5 transgenic mice. k) Both Wt-G and Mt-A mutations drive expression of CUX1 across all layers of the cortical plate, with increased expression due to the mutation. See also Figure S4.
HAR426 joined to the human CUX1 promoter shows strong enhancer activity in a luciferase reporter assay, and the G>A mutation boosted this activity >3-fold (Figure 4f), compared to only a 1.5-fold increase from the wild-type allele, suggesting that the HAR426 G>A variant strongly increases neuronal expression of CUX1. This increase is among the 95th percentile of enhancer mutations, where the average change due to mutation is 5.5% (95% CI of 1%) (Patwardhan et al., 2012). Overexpression of Cux1 in cultured differentiating cortical neurons increased synaptic spine density in an activity-dependent manner (Figure 4g–i), as well as increasing spine head area, indicative of strengthened and more stable synapses, indicating that Cux1 modifies the intrinsic response of neurons to depolarization, possibly inhibiting dendritic spine pruning or promoting excessive synaptogenesis. The defects in spine morphology induced by CUX1 expression suggest that aberrant overexpression of CUX1 caused by the HAR mutation may interfere with normal spine refinement.
The in vivo functional effect of the CUX1 HAR mutation was modeled in transient transgenic mice (E16.5) expressing a green fluorescent protein (GFP) reporter controlled by the HAR (Wt-G & Mt-A allele) and the human CUX1 promoter. Transgenic mice with the Mt-A and CUX1 promoter showed GFP expression in cortex, consistent with the short CUX1 HAR isoform in both humans and mice (Nonaka-Kinoshita et al., 2013; Saito et al., 2011), while mice carrying the Mt-A allele showed elevated expression compared to the Wt-G HAR (Figure 4jk). Comparison of the HAR and CUX1 promoter to predicted sequences of the last common placental ancestor (105MyA) and phylogenetic reconstruction showed surprisingly divergent sequences of the CUX1 HAR and promoter in rodents compared to other mammals (Figure S4), suggesting rodent-specific evolution (as well as human-specific evolution) whereas CUX1 exons are highly conserved. These data suggest that allelic and evolutionary changes in the CUX1-associated HAR could affect expression levels that in turn can regulate spine density or other aspects of neuronal morphology.
HAR mutation affecting PTBP2, an essential neural splicing regulator
In a family of two brothers with ASD and ID, we identified a novel 5bp INDEL located between the DPYD and PTBP2 genes within an active brain enhancer element (Table 1, Figure 5a). Our 4C-seq in human SH-SY5Y cells suggests an interaction of the HAR and the promoter of the dosage-sensitive (pLI=0.99) brain-specific splicing regulator (PTBP2), which is essential for neuronal differentiation (Li et al., 2014; Licatalosi et al., 2012). Heterozygous deletions of the locus (PTBP2 and DPYD) are associated with ASD and ID (Carter et al., 2011; Willemsen et al., 2011). TF motif analysis suggests that the INDEL alters TF binding through the gain and loss of motifs (Figure 5bc). Luciferase analysis confirmed HAR enhancer activity with a 50% reduction in activity in the mutated HAR when co-transfected with DN-REST, thus in a neuronal-like state (Figure 5de). MPRA analysis revealed a similar loss (40% decrease) of enhancer activity caused by the mutation in primary mouse neurospheres (Table S7). No effects of the mutation on enhancer activity were seen in the progenitor-like state, suggesting a relatively neuron-specific effect, where PTBP2 also shows the most striking phenotypes in mice (Li et al, 2014).
Figure 5. Homozygous INDEL within a HAR that interacts with promoter region of essential splicing regulator, PTBP2.
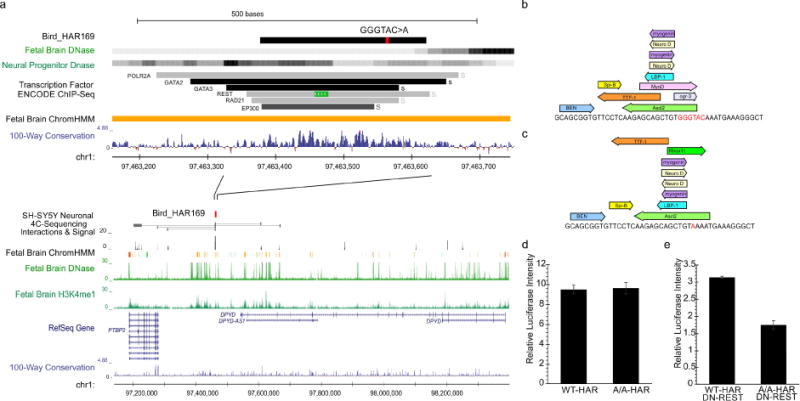
a) Homozygous GGGTAC>A mutation between PTBP2 and DPYD with enhancer activity in fetal brain tissues (ChromHMM) and several TF motifs from TF-chip and chromatin interactions (4C-seq) with the promoter region of PTBP2. The INDEL is located within b) predicted TF motifs in the reference genome, c) causing their loss. Luciferase analysis of the mutant (Mt) and reference (Wt) HAR using a minimal promoter revealed d) no change in neural progenitor-like cells, while e) co-transfection with DN-REST resulted in a 50% decrease in activity.
Two intronic GPC4 HAR mutations affecting regulatory activity
Two unrelated families harbored novel homozygous mutations in the same HAR within an intron of GPC4, encoding Glypican-4 (Figure 6a). The occurrence of two different rare biallelic mutations in the same HAR is extremely unlikely due to random chance given the low mutation rate. Our interaction data revealed linkage between the HAR and the promoter of dosage-sensitive (HI=0.8) GPC4 in primary adult human brain tissue (Figure 6a). GPC4 is essential for excitatory synapse development in mice (Allen et al., 2012). Human GPC3 and GPC4 are implicated in Simpson-Golabi-Behmel syndrome, which includes ID (Hughes-Benzie et al., 1996; Veugelers et al., 2000). The HAR exhibits activity in neural, muscle, and embryonic stem cells and the two mutations (Table 1) were predicted to remove TF motifs (Figure 6b). Both mutations reduce regulatory activity by 20–25% in mouse N2A cells (Figure 6c), with a diminished effect in a neuronal-like state using co-transfection of DN-REST (10–15% decrease, Figure 6d). Our MPRA data in primary neural cells from neurospheres also revealed a 30% decrease in activity for the T>C allele (Table S7). Together, these data suggest potential involvement of this HAR in synapse formation.
Figure 6. Two independent mutations reduce regulatory activity of intronic HAR within GPC4.
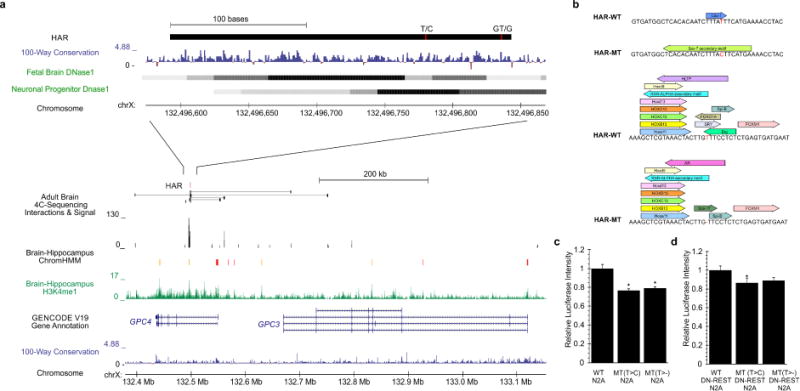
a) Homozygous mutations in two unrelated families with ASD b) affecting a HAR within the intron of GPC4 with enhancer activity in brain tissues (ChromHMM) where proximity and interaction data suggest interaction with GPC4 promoter. c) Loss of TF motifs due the mutations. Luciferase analysis of the mutant (Mt) and reference (Wt) HAR sequence using the GPC4 promoter revealed d) a 20–25% decrease in regulatory activity in N2A cells, while e) co-transfection with DN-REST resulted in a slightly diminished effect. T-Test p-value *≤0.05 compared to WT.
In addition to these functionally tested mutations, we find several additional properly segregating HAR mutations within affected individuals, many of which exhibit regulatory functions and are located near important genes for neurodevelopment (Table 1). Despite tissue specificity of many HARs, we find that several of these candidate HAR mutations affect regulatory potential, including variants within the promoter region of CDKL5 (Table 1, 25% loss in activity) and 400 kb downstream of MEF2C (Table 1, Figure S5, 50% loss in activity) both known genes underlying ASD and ID. Together, this set of rare biallelic HAR mutations in individuals highlight a previously undiscovered set of noncoding genomic loci with possible implications on human brain development and the manifestation of ASD.
DISCUSSION
We provide the first direct evidence that rare de novo CNV involving HARs can contribute in simplex ASD, and rare biallelic mutations in neurally active HARs can confer risk to ASD in as many as 5% of individuals from a consanguineous population. Epigenomic profiling and in vitro analyses showed functional effects of candidate mutations in several HARs that interact with promoters of dosage-sensitive neurodevelopmental genes including CUX1, PTBP2, GPC4, and MEF2C. Abnormal expression of these genes elicits severe defects in synaptogenesis or other developmental processes, suggesting that HAR mutations in ASD may confer risk through such processes and identifying a set of HARs with potentially essential functions in cognition and behavior.
The striking enrichment of SOX2 interactions among genes associated with HARs with rare biallelic ASD mutations, combined with the overrepresentation of SOX2 and other developmental dosage-sensitive TF binding motifs (e.g., OLIG2 and SMARCA4) within these HARs, suggest potential roles in neurogenesis. SOX2 is essential for maintenance of neural progenitors and neural differentiation, and loss of SOX2 causes hippocampal and cerebral malformations (Kelberman et al., 2008). Therefore, the alteration of TF binding within a HAR could affect the precise timing and cell types involved in neurogenesis or other neurodevelopmental processes.
A fundamental question about HARs is whether their characteristics in humans indicate loss of activity (i.e., assuming a neutral mutation rate) or that they underwent positive selection with evolved functions before switching to negative selection amongst humans (i.e., functionally constrained in humans). We provide the largest population level analysis of HARs using WGS data from CG69 and 1000G to reveal evidence of directional selection, which previous studies have suggested to include a combination of positive and negative pressures. If some HARs are still undergoing positive selection, they would thus represent an interesting class of evolving loci that may contribute to differences observed among diverse human populations.
The conservation of most human-specific HAR alleles within human populations suggests that they modified important functions that might be deleterious if lost. Analyses of human and chimpanzee alleles in TF motifs revealed enrichment for the creation and loss of essential developmental transcription factors such as CTCF and REST, suggesting that many human-specific nucleotides alter transcriptional regulatory potential, which is further supported by previous transgenic mice (Capra et al., 2013). Therefore, the comparative profiling of HARs for essential TF motifs can be used to identify candidate HARs and alleles regulating human-specific neural developmental processes for social and cognitive functions as well as synaptic complexity and brain size.
The divergence of humans compared to chimpanzees is apparent in a wide range of phenotypic differences, not only brain size but also recently acquired or expanded social and cognitive traits. The complexity and spectrum of such traits strongly suggests roles for diverse recently-evolved noncoding regulatory elements. The overlap of HAR- associated and target genes with diverse neurodevelopmental phenotypes and OMIM disorders (ASD, microcephaly, and seizures) suggest that further mutational and functional characterization of HARs may further dissect those involved in regulation of brain size, structure and/or other cognitive or social traits. Even more, the intriguing conservation of HARs within human populations, but divergence from chimpanzees, highlights their importance in human-specific neural evolution and diversification.
While our study focused on a cohort specifically selected to be enriched for biallelic mutations, other unconstrained cohorts, as well as other neurodevelopmental disorders, may harbor excesses in biallelic, inherited heterozygous, and de novo risk alleles in HARs, as well as other regulatory elements (Lim et al., 2013; Yu et al., 2013). HAR alleles will likely vary in risk from mild to highly penetrant or pathogenic. Future studies will likely expand our understanding of noncoding mutations in developmental disorders by implicating additional HARs and other conserved regions through targeted and WGS. Our rapid and cost effective “HAR-ome” sequence capture strategy can be productively applied to probe the roles of HARs in other conditions and cohorts, or in diverse or ancient human populations. Our data helps to explain part of the phenotypic variability and missing heritability of autism by implicating rare biallelic mutations within noncoding regulatory HARs.
METHODS AND RESOURCES
Contact for Reagent and Resource Sharing
Please contact C.A.W. (christopher.walsh@childrens.harvard.edu) for reagents and resources generated in this study.
EXPERIMENTAL MODEL AND SUBJECT DETAILS
Human subjects
Research on human samples was conducted following written informed consent and with approval of the Committees on Clinical Investigation at Boston Children’s Hospital and Beth Israel Deaconess Medical Center, and participating local institutions.
We selected simplex and multiplex families of Middle Eastern descent with known consanguinity (predominately 1st-cousin parents) with a diagnosis of ASD where WES did not reveal clear causative mutations (Table S6). Additionally, 15 families from the AGRE collection were included for WGS and targeted sequencing. A single affected and unaffected family member was chosen from each family in order to mitigate the effects of population stratification in the HAR burden analyses (Table S5). Beyond ASD, individuals also presented with ID and/or other comorbidities. Genomic DNA was isolated from blood samples.
Members contributing to the Homozygosity Mapping Consortium for Autism (HMCA)
Mahmoud M Abeidah, Mazhar Adli, Al Noor Centre for Children with Special Needs, Sadika Al-Awadi, Lihadh Al-Gazali, Zeinab I Alloub, Samira Al-Saad, Muna Al-Saffar, Bulent Ataman, Soher Balkhy, A James Barkovich, Brenda J Barry, Laila Bastaki, Margaret Bauman, Tawfeg Ben-Omran, Nancy E Braverman, Maria H Chahrour, Bernard S Chang, Haroon R Chaudhry, Michael Coulter, Alissa M D’Gama, Azhar Daoud, Dubai Autism Center, Valsamma Eapen, Jillian M Felie, Stacey B Gabriel, Generoso G Gascon, Micheal E Greenberg, Ellen Hanson, David A Harmin, Asif Hashmi, Sabri Herguner, R Sean Hill, Fuki M Hisama, Sarn Jiralerspong, Robert M Joseph, Samir Khalil, Najwa Khuri-Bulos, Omar Kwaja, Benjamin Y Kwan, Elaine LeClair, Elaine T Lim, Manzil Centre for Challenged Individuals, Kyriakos Markianos, Madelena Martin, Amira Masri, Brian Meyer, David Miller, Ganeshwaran H Mochida, Eric M Morrow, Nahit M Mukaddes, Ramzi H Nasir, Zafar Nawaz, Saima Niaz, Kazuko Okamura-Ikeda, Ozgur Oner, Jennifer N Partlow, Annapurna Poduri, Anna Rajab, Leonard Rappaport, Jacqueline Rodriguez, Klaus Schmitz-Abe, Sharjah Autism Centre, Yiping Shen, Christine R Stevens, Joan M Stoler, Christine M Sunu, Wen-Hann Tan, Hisaaki Taniguchi, Ahmad Teebi, Christopher A Walsh, Janice Ware, Bai-Lin Wu, Seung-Yun Yoo, Timothy W Yu.
Mice
Transient transgenic mice were generated using plasmids containing HAR (Wt-G or Mt-A), a 2.2-kb human CUX1 promoter and GFP. The 2.2-kb human CUX1 promoter, chr7:101,457,129-101,459,367 (hg19), was retrieved from bacterial artificial chromosome RP11-962B9 (Children’s Hospital Oakland Research Institute) by recombineering. The plasmids were linearized, and pronuclearly injected into one-cell FVB/N mouse embryos (The Jackson Laboratory, n = 50–80 embryos/plasmid) at the Brigham and Women’s Hospital Transgenic Core. Wt-G HAR-hCUX1-GFP mice (n = 7) and Mt-A HAR-hCUX1-GFP mice (n = 15) were analyzed at E16.5, and sex of the embryos was not determined. Brains were perfused and fixed in 4% paraformaldehyde/PBS, vibratome sectioned at 75 μm, and stained for GFP and endogenous Cux1 expression using chicken anti-GFP antibody (Abcam) and rabbit anti- CDP/CUX1 antibody (Santa Cruz). All animal experiments conformed to the guidelines approved by the Children’s Hospital Animal Care and Use Committee.
Cell Lines
N2A cell (ATCC) medium was 10% fetal bovine serum, Dulbecco’s Modified Eagle Medium, and 1X Penicillin-Streptomycin. SH-SY5Y cell (ATCC) medium was 10% fetal bovine serum, Dulbecco’s Modified Eagle Medium/F12, and 1X Penicillin-Streptomycin. Both cell lines were maintained in a 5% CO2 incubator at 37 °C.
Primary Neuronal Culture
For neuronal culture preparations E18 embryo cortex were trypsinized using 0.25 μg/ml trypsin (SIGMA-Aldrich) in EBSS (Gibco, Invitrogen, Carlsbad, CA) 3.8% MgSO4 (Sigma-Aldrich, St. Louis, MO), penicillin/streptomycin (Gibco, Invitrogen, Carlsbad, CA). The reaction was stopped and cells were mechanical dissociated in EBSS media complemented with 0.26 mg/ml Trypsin inhibitor, 0.08 mg/ml DNAse, and 3.8% MgSO4 heptahydrate (all from Sigma-Aldrich, St. Louis, MO). Dissociated cells were seeded onto 24 well Poly-D-Lys (Sigma-Aldrich, St. Louis, MO) coated plates in neurobasal media supplemented with B27 complement 1×, glutamax 1× and penicillin/streptomycin (Gibco, Invitrogen, Carlsbad, CA). 500 μl media were replaced every 2 days.
METHOD DETAILS
HAR-ome Sequence Capture
Our custom designed sequence capture panel utilizes the Agilent Haloplex technology to capture 99% of targeted HARs (808.7kb of 815.6kb, 2,733 of 2737 HARs). Deep sequencing of all samples was performed using the Illumina Hi-Seq 2500 with 150-bp paired-end reads with pooled 96 indexed samples per lane. All raw HAR-ome sequences were processed through our existing CLC genomics pipeline. Briefly, all FASTQ files were trimmed to remove low quality reads and bases. All sequences were then aligned with three rounds of local realignments. Variants were identified using the fixed ploidy variant caller incorporating base quality scores (20), read depth (10X), and uniquely mapped reads. In addition, VCF formatted genetic variants from WGS of ASD families, along with the Complete Genomics Diversity panel and 1000 Genomes project, were converted into an Annovar input format using the convert2annovar command.
Massively Parallel Reporter Assay (MPRA)
Rare biallelic HAR mutations in affected and unaffected individuals were used to design both wild-type and mutant MPRA probes. Each mutation was tiled using three unique 115bp ssDNA oligonucleotides overlapping by 90bp. Oligos were created as a single ssDNA pool by CustomArray (Bothell, WA). The MPRA assay was conducted as previously described (Melnikov et al., 2012). Briefly, the custom ssDNA oligo pool was amplified by emulsion PCR and cloned into pMPRA1 vector (Addgene, 49349). The luciferase gene and minimal promoter (pMPRA_donor2, Addgene, 49353) was cloned into the pMPRA1_Oligo construct pool. Neurospheres were created using the Miltenyi Biotec Neural Tissue Dissociation Kit. Briefly, the cortex from E14.5 embryonic mice were minced and dissociated with using the Miltenyi Biotec Neural Tissue Dissociation Kit. The cells were grown as suspended culture for 24 hours. Then, 2ug of MPRA constructs were transfected into batches of 5 million harvested cells resuspended in Neon resuspension buffer using the Neon System with electroporation settings: 1,400 V, 40 ms, 1 pulse. The cells were harvested after 48 hours post transfection and mRNA was isolated using the Dynabeads mRNA DIRECT Purification Kit. Resulting Tag-seq amplified cDNA was sequenced using 75bp sequencing with Illumina’s MiSeq technology. Reads were filtered for quality and perfect match to oligo barcodes.
Enhancer Activity Assay
We selected HAR mutations for functional testing based on proximity to important neurodevelopmental genes, established regulatory activity in Epigenomics Roadmap data, and existing chromatin interaction data. HARs were cloned from control and patient lymphocyte-derived DNA by PCR amplification. HARs and either a minimal Hsp68 or the target promoter were subcloned into luciferase vector pGL4.12 (Promega). The human CUX1 promoter used in enhancer activity assay is identical to the one used for the generation of transgenic mice. Luciferase plasmids were transfected into N2A cells, along with an internal control plasmid (phRL-TK(Int-), Promega) and dominant-negative REST (DN-REST) (gift from Dr. Gail Mandel) or GFP expression plasmids using Polyfect (Qiagen)(Chong et al., 1995). Luciferase activities were measured 72 h later.
Neuronal Spine Analysis
For spine analysis primary neurons were transfected with GFP or CAG-Cux1 using lipofectamine 2000 as previously described (Rodriguez-Tornos et al., 2013). Next, 12hr prior to inducing neuronal activity, cells were incubated with 2 mM tetrodotoxin (TTX) (Alomone-labs, Jerusalem, Israel). Then media was replaced with media containing with 4-aminopyridine (4AP) 100 μM, strychnine 1 μM, glycine 100 μM and bicuculline 30 μM (Sigma-Aldrich, St. Louis, MO). After stimulation, cells were fixed and stained with mouse anti-GFP (A11122) and goat anti-rabbit-Alexa488 (Life Technologies) as described (Cubelos et al., 2010). Confocal microscopy was performed with a TCS-SP5 (Leica) Laser Scanning System on a Zeiss Axiovert 200 microscope. Dendritic spine and filopodia processes of individual neurons were measured as previously described (Cubelos et al., 2010). Confocal microscopy was performed with a TCS-SP5 (Leica) Laser Scanning System on a Zeiss Axiovert 200 microscope and 50 μm sections were analyzed by taking 0.2 μm serial optical sections with Lasaf v1.8 software (Leica). Images were acquired using a 1024×1024 scan format with a 63× objective and analyzed using Fiji.
4C-sequencing
We used a modified version of a previously reported 4C-sequencing method to determine chromatin interactions between genomic loci and selected HARs. Briefly, we cultured human neuroblastoma SH-SY5Y cells with and without the addition of IGF-1 for 72 hours to differentiate the cells into mature neurons. Approximately 30M cells from each condition were collected for 4C-sequencing. In addition, fresh-frozen bulk adult cortical brain tissue from was homogenized on ice in 1X PBS containing protease inhibitors. The homogenized tissue was processed as previously reported including brief fixation in 1% formaldehyde, nuclear extraction and chromatin sonication using a Covaris sonicator (Gao et al., 2013). Indexed paired-end libraries were created following PCR enrichment of selected HARs using Phusion polymerase (NEB), followed by sequencing using Illumina MiSeq. Reads were mapped using BWA (Li and Durbin, 2009), allowing for chimeric reads representing the fusion of distal interaction regions creating through the ligation step of 4C. All data was visually inspected for mapped reads spanning distinct loci within 1mb. Mapped BAM files were converted to bedgraphs using BEDtools (Quinlan and Hall, 2010) and significant peaks were identified using SICER (Zang et al., 2009). Next, reads mapping within or spanning peaks located within 1mb of targeted HAR were extracted from mapped BAM files using Samtools (Li et al., 2009). We defined the known interacting genes for several HARs containing candidate mutations as either having a previously-reported physical interactions or by the presence of mapped paired-reads from 4C-sequencing.
Functional Validation of Mutation affecting regulation of myocyte enhancer factor-2c (MEF2C)
Another candidate HAR mutation is a homozygous T>G SNV in a developmental brain enhancer (family AU-9200) (Table 1, Figure S5a). The family comprises healthy, first cousin parents with three healthy sons and two sons with ASD, ID, and mild dysmorphisms including small pointed chin and large ears, a phenotype commonly observed with MEF2C mutations (Bienvenu et al., 2013; Novara et al., 2013). The point mutation is present in low frequencies in the 1000G (0.7%), though more common in South Asia, and absent in healthy Middle Eastern controls. One person of South Asian decent is reported to be homozygous for the mutation in 1000G, though no clinical data is available. This single homozygous allele might have arisen as an artifact of the low coverage sequencing in 1000G. Analysis of the phased 1000G data suggests that the frequency of rare alleles is much lower than expected based on the CG69 WGS, our targeted sequencing, and public datasets. This depletion of rare alleles persists across all genomic categories (i.e., coding, conserved noncoding, random regions, and HARs), suggesting at least two possible contributing factors arising from the low (<1X) read coverage in the 1000G data. First, 1000G was designed to use low coverage sequencing in a large population in order to identify common alleles in diverse populations. Such coverage will inherently limit the identification of rare alleles. Second, the imputation of missing genotypes in populations, especially smaller populations (e.g., South Asian) could lead to the artificial inflation of some allele frequencies, particularly in rare or recurrent mutations. Therefore, while the HAR mutation is estimated to be at a higher frequency in the South Asian population, the exact frequency would require higher depth sequencing of a larger population. Regardless of the population frequency limitations, this HAR mutation is likely to represent a phenotypic modifier that may act with other coding or noncoding mutations to account for the phenotypic spectrum in the family in a similar way to that proposed by common coding mutations (Gaugler et al., 2014).
We assessed the potential impact of rare coding mutations in this family using exome sequencing data of both affected individuals. Our analysis of rare biallelic coding mutations including stop-gain, INDELs (frameshift and non-frameshift), damaging missense (predicted pathogenic by SIFT, POLYPHEN, MUTATION TASTER, and FATHMM)(Adzhubei et al., 2010; Ng and Henikoff, 2003; Schwarz et al., 2010; Shihab et al., 2013) revealed only a single missense mutation in ARHGAP36 (p.Ile432Val) which was predicted to be damaging by 2 of the 4 programs. ARHGAP36 is a dosage sensitive gene lacking association with human disease. The combination of the gene’s likely dominant acting mechanism (pLI=0.99), presence of other homozygous mutations in the flanking amino acid (p.His431Arg) in healthy individuals, and inconsistent damaging predictions suggest that the identified mutation is likely benign. The lack of plausible coding mutations raises the possibility of a role for the HAR mutation in at least a portion of the individuals’ phenotypes, especially those matching typical MEF2C deletions, but we document this mutation here because we regard its pathogenicity as less definitive than others.
Given the potential functional role of this mutation, we sought to identify the target gene of the HAR and assess the mutation’s impact on gene regulation. Using our own 4C-seq of human SH-SY5Y neuroblastoma cells in a neuronal state, we identified interaction with the promoter regions of TMEM161B and MEF2C (HI=0.97), an interaction that is not observed in existing ChIA-PET data from cancer cell lines suggesting a neural-specific interaction (Figure S5b). The mutation is predicted to create a myocyte enhancer factor-2a (MEF2A) motif; which is highly expressed in differentiated neurons during synaptogenesis and controls postsynaptic dendritic differentiation as well as presynaptic differentiation in the brain (Yamada et al., 2013) (Figure S5cd). Analysis of the regulatory activity of the reference and mutated HAR sequence using the predicted promoter region of MEF2C in N2A cells revealed a 30% decrease in activity in neural progenitor like cells (Figure S5e). Since the mutation is predicted to create a motif for MEF2A, we would expect overexpression of MEF2A to amplify the mutation’s effect, which it did, resulting in a 53% decrease in activity (Figure S5e). Next, given the complexity of the promoter region of MEF2C (Figure S5b), we selected a second locus supported by epigenetic data as being a promoter and assessed its activity under the same conditions. While the second promoter had less activity than the first, we find that the mutation decreased the HARs activity by 16% in progenitor-like cells and 30% in the presence of MEF2A (Figure S5f). The 30–50% loss of MEF2C due to the HAR mutation would likely affect tissues where the HAR is active and be similar to the heterozygous loss of MEF2C due to coding mutations. The phenotypic similarity between these patients and others with heterozygous MEF2C deletions—who often show severe ID, seizures, verbal and motor developmental delay, large ears, small chin, prominent forehead, and either hypo or hypertonia (Bienvenu et al., 2013; Novara et al., 2013) – suggests a possible role for this SNV in the individual’s phenotype.
QUANTIFICATION AND STATISTICAL ANALYSIS
Population analysis of HARs
Human accelerated regions were obtained from recent publications and converted into the human (hg19) genome assembly using the UCSC genome browser liftover tool. All HARs located within 30 base-pairs of another HAR were merged into a single region prior to annotating with Annovar (Wang et al., 2010) using databases obtained from UCSC Genome Browser (Kent et al., 2002) and Annovar. All mutations overlapping HARs, conserved noncoding elements, refSeq coding exons, or randomly selected genomic loci of equal number and size to HARs were extracted from the 1000 Genomes and CG69 VCF files (Drmanac et al., 2010; Genomes Project et al., 2015). The rates of mutations were assessed for each population, subpopulation and across the entire collection of individuals for each genomic category (HARs, conserved noncoding elements, refSeq coding exons, and the average of 1000 randomly selected genomic loci equivalent to the size distribution of HARs). The total mutational rates, as well as the fraction of rare (AF<1%) mutations were compared between the HARs and the other categories using the 2-tailed p-value from a T-Test. In addition, groups were compared using the 95% confidence intervals. All statistical parameters and values are located in the text and figure legends.
Functional Predictions of HARs
Human and fetal brain H3K4me1 bed files, ChromHMM, and DNAse hypersensitivity data were obtained and analyzed from the Epigenomics Roadmap server (Roadmap Epigenomics et al., 2015). Significance of enrichments were computed using 10,000 samplings of random and conserved genomic regions. DAVID functional annotation tool (Huang et al., 2008) was used to test genes for enrichment in the Genetic Association Database of Diseases, while Enrichr was used to determine enrichment of biological processes, KEGG pathways, mammalian phenotypes, and human phenotypes (Chen et al., 2013; Huang et al., 2008). Results of statistical tests are located in the figure legends and results section.
Using existing ChIA-Pet, we overlaid all 2,737 HARs with existing datasets, revealing HAR-promoter interactions among 180 HARs and 207 genes. Additionally, despite the limited resolution on HiC compared to ChIA-Pet, 349 HARs were mapped to their target promoters in IMR90 human fibroblasts.
While interactions between HARs and promoters likely indicate regulatory activity, they could also result from random contacts in the nuclei. Therefore, we associated predicted regulatory activity of these loci in the ENCODE and Epigenomics Roadmap data revealing that 93% of HARs with identified chromatin interactions exhibit transcriptional or regulatory activity in at least one cell type, including 66% in ENCODE or IMR90 cell lines. Interestingly, these HARs were more frequently active in embryonic stem cells (75% overlap), followed by ENCODE and epithelial samples. Even more, we find several HARs which interacted with different genes depending on which cell line was assayed, suggesting that some fraction might regulate different genes based on their developmental time point. The tissue specific activity suggests that primary tissues will be required to fully understand the promoter interaction among most HARs.
Transcription factor binding motif analyses
Transcription factor binding motifs for all HARs using the human and chimpanzee sequences were performed using the FMatch tool with TransFac (BioBase) with the settings: vertebrate_non_redundant_miFP, database version 2015.3, significance p<0.01. Enrichment of motifs were determined using options: randomly generated sequences and 1000bp shift of input regions.
HAR-ome Sequence Capture
The genetic variants from all individuals were annotated using Annovar against public variant databases, regulatory databased (ENCODE, Epigenomics Roadmap, Ensembl, Capra et. al. predictions, and VISTA enhancers(Pennacchio et al., 2006)), CADD(Kircher et al., 2014), 100-way Vertebrate sequence conservation, GERP, gene databases (Refseq, Ensembl, and UCSC Known genes), and existing chromatin interaction maps (ChIA-PET and HiC) (Fullwood et al., 2010; Jin et al., 2013; Li et al., 2010). Simulations on 10,000 sets of randomly selected genomic and conserved regions within each individual whole genome sequence were analyzed and compared to HARs. The level, zygosity, and burden of HAR variation within our Middle Eastern cohort was compared to CG69. Furthermore, the identification of candidate mutations for ASD was performed by filtering all variants, removing all common variants (>1% allele frequency), heterozygous variants, and those that were homozygous in the control samples, as well as those common within our cohort (AF>2%).
Candidate mutations were screened for allelic segregation within the family. Additionally, mutations were screened in 101 healthy individuals from the United Arab Emirates. PCR primers were designed to span candidate mutations using Primer3Plus(Untergasser et al., 2007). All PCRs were conducted using a standard touchdown protocol. PCR products were purified and sequenced using Beckman Genomics’ Sanger sequencing service. Trace data from all family members and 101 controls were trimmed and multi-aligned using default settings in Geneious.
Burden Analysis
The rates of high quality homozygous variants were compared between affected and unaffected individuals at 5%, 1%, and 0.5% maximum allele frequencies in public databases as well as within our cohort. Additionally, all variants within 10bp of another variant were excluded in order to identify highly conserved loci. Furthermore, alleles with low quality calls at greater than 10% of the covering reads were excluded as these often represented poorly mapped and difficult regions for sequencing. The ratio of mutation rates between affected and unaffected individuals for each allele frequency was used to normalize the affected rates in affected individuals, thereby reducing our final burden to more accurately reflect an elevation due to ASD instead of population structure (Figure S2). All variants were required to have either GERP scores >2 or CADD scores >0. We overlaid ChromHMM predictions from the Epigenomics Roadmap project to identify alleles within loci with active enhancer, promoter, or transcriptional properties. We further screened these data to create a list of neuronal loci which included all brain tissues as well as neurosphere derived cells. Significance of observed excesses were tested using 10,000 random assignments of affected status.
Estimation of contribution of HAR mutations to ASD was determined using the population corrected mutational rates. First, the ascertainment differential was calculated as the difference between the corrected rates in affected individuals and the rate in unaffected individuals (Iossifov et al., 2014). This value represents the rate of alleles contributing to ASD and, when divided by the total rate in affected individuals, can be used to estimate the proportion of identified alleles that contribute to the diagnoses.
Functional prediction analyses
In order investigate enriched functional categories in HARs, as well as in our mutation datasets, we analyzed their target and associated genes. Associated genes include those where HARs are within the introns, within or near (less than 1kb) 5′ and 3′ UTRs, or are the closest flanking gene, as annotated by Annovar. All closest flanking genes (both upstream and downstream) were less than 2.1mb away, with 70% being less than 500kb away. All gene sets were analyzed using Enrichr (Chen et al., 2013) and DAVID functional annotation tool. Using our highly annotated datasets, candidate variants in promoter, intronic, and intergenic regions were identified after considering overlap with base conservation, histone data, TFBS, chromatin interactions, and predicted enhancers. The predicted functional consequences of each variant was determined by first by overlapping DNA and histone modifications with potential gene targets. Next, all candidates were analyzed using the vertebrate database and the default settings including filters to minimize false positives in TRANSFAC (Biobase) in order to determine the variants’ impact on TFBS. Finally, fetal and adult human brain expression profiles of potential target genes of HARs were determined using existing microarray analyses of LCM acquired tissues available from BrainSpan. All normalized microarray expression values represent the maximum observed across all ages and tissues.
ASD CNV analysis
Rare de novo CNVs in ASD cases and sibling-matched controls were obtained from recently published de novo analyses of the SSC ASD (Sanders et al., 2015). All CNVs were annotated with gene annotations and HARs using Annovar (Wang et al., 2010). Statistical comparisons of cases to the controls were conducted using Fisher’s Exact test.
Evolutionary Analysis of HAR and CUX1 promoter
Comparative evolutionary analysis of HAR426 and CUX1 was performed using modified version of the recently published “Forward Genomics” approach (Hiller et al., 2012). A multifasta file was extracted from the existing 100-way vertebrate multiple alignments from the UCSC genome browser (Kent et al., 2002; Pollard et al., 2010). The sequence of the last common placental ancestor was predicted from the phylip formatted alignment using the prequel algorithm (–keep-gaps –no-probs –msa-format PHYLIP), part of the PHAST tools(Yang, 1995). The percent identities were calculated through pairwise alignments of all species against the predicted common ancestral sequence using Needleall, part of the EMBOSS tools(Rice et al., 2000). Species with low quality or assembly gaps were excluded from the analysis. To further validate these findings, phylogenetic reconstruction was performed using the alignment files for the loci using RAxML(Stamatakis, 2014). Using default settings, 1,000 fast bootstraps and the GRT+gamma model, a maximum likelihood phylogram was created for the HAR and CUX1 promoter. These phylograms were compared to the existing phylogram available from the 100-way vertebrate alignment, obtained from UCSC genome browser.
Supplementary Material
Acknowledgments
We thank J. Partlow and B. Barry for human subject enrollment; N. Hatem and A. Lam for sample preparation and cloning; D. Gonzalez for immunofluorescence; K. Girskis for the primary neurosphere culturing; and members of the Walsh lab for comments. R.N.D. was supported by an NIH T32 fellowship from the Fundamental Neurobiology Training Grant (5 T32 NS007484-14) and the Nancy Lurie Marks Postdoctoral Fellowship. B.I.B. was supported by NIH Exploratory/Developmental Research Grant (NINDS 1 R21 NS091865-01). C.A.W. was supported by the Paul G. Allen Family Foundation and the NIMH (RC2MH089952 and RO1MH083565). Annotation was performed using Harvard Medical School’s Orchestra computing cluster, supported by NIH grant NCRR 1S10RR028832-01. C.A.W. is an Investigator of the Howard Hughes Medical Institute. We gratefully acknowledge the resources provided by the Autism Genetic Resource Exchange (AGRE) Consortium and the participating AGRE families. MN work is funded by grant MICINN SAF2014-52119-R. The Autism Genetic Resource Exchange is a program of Autism Speaks and is supported, in part, by grant 1U24MH081810 from the National Institute of Mental Health to Clara M. Lajonchere (PI).
Footnotes
Publisher's Disclaimer: This is a PDF file of an unedited manuscript that has been accepted for publication. As a service to our customers we are providing this early version of the manuscript. The manuscript will undergo copyediting, typesetting, and review of the resulting proof before it is published in its final citable form. Please note that during the production process errors may be discovered which could affect the content, and all legal disclaimers that apply to the journal pertain.
AUTHOR CONTRIBUTIONS
R.N.D. and C.A.W. designed the experiments. R.N.D performed sequencing experiments and analyses. B.B., B.C., C.C., A.A.H., M.N., and R.N.D. performed Sanger and functional validation. S.A.S., N.M.M., O.O., M.A.S., S.B., G.G.G., and HMCA provided samples and clinical details for individuals involved in the study. R.N.D and C.A.W. wrote the manuscript and all authors contributed to the final version of the manuscript.
DATA AND SOFTWARE AVAILABILITY
Whole Genome Sequence Data dgGAP: phs000639
References
- Adzhubei IA, Schmidt S, Peshkin L, Ramensky VE, Gerasimova A, Bork P, Kondrashov AS, Sunyaev SR. A method and server for predicting damaging missense mutations. Nature methods. 2010;7:248–249. doi: 10.1038/nmeth0410-248. [DOI] [PMC free article] [PubMed] [Google Scholar]
- Allen NJ, Bennett ML, Foo LC, Wang GX, Chakraborty C, Smith SJ, Barres BA. Astrocyte glypicans 4 and 6 promote formation of excitatory synapses via GluA1 AMPA receptors. Nature. 2012;486:410–414. doi: 10.1038/nature11059. [DOI] [PMC free article] [PubMed] [Google Scholar]
- Bae BI, Tietjen I, Atabay KD, Evrony GD, Johnson MB, Asare E, Wang PP, Murayama AY, Im K, Lisgo SN, et al. Evolutionarily dynamic alternative splicing of GPR56 regulates regional cerebral cortical patterning. Science. 2014;343:764–768. doi: 10.1126/science.1244392. [DOI] [PMC free article] [PubMed] [Google Scholar]
- Bienvenu T, Diebold B, Chelly J, Isidor B. Refining the phenotype associated with MEF2C point mutations. Neurogenetics. 2013;14:71–75. doi: 10.1007/s10048-012-0344-7. [DOI] [PubMed] [Google Scholar]
- Bird CP, Stranger BE, Liu M, Thomas DJ, Ingle CE, Beazley C, Miller W, Hurles ME, Dermitzakis ET. Fast-evolving noncoding sequences in the human genome. Genome biology. 2007;8:R118. doi: 10.1186/gb-2007-8-6-r118. [DOI] [PMC free article] [PubMed] [Google Scholar]
- Burbano HA, Green RE, Maricic T, Lalueza-Fox C, de la Rasilla M, Rosas A, Kelso J, Pollard KS, Lachmann M, Paabo S. Analysis of human accelerated DNA regions using archaic hominin genomes. PloS one. 2012;7:e32877. doi: 10.1371/journal.pone.0032877. [DOI] [PMC free article] [PubMed] [Google Scholar]
- Bush EC, Lahn BT. A genome-wide screen for noncoding elements important in primate evolution. BMC evolutionary biology. 2008;8:17. doi: 10.1186/1471-2148-8-17. [DOI] [PMC free article] [PubMed] [Google Scholar]
- Capra JA, Erwin GD, McKinsey G, Rubenstein JL, Pollard KS. Many human accelerated regions are developmental enhancers. Philosophical transactions of the Royal Society of London Series B, Biological sciences. 2013;368:20130025. doi: 10.1098/rstb.2013.0025. [DOI] [PMC free article] [PubMed] [Google Scholar]
- Carter MT, Nikkel SM, Fernandez BA, Marshall CR, Noor A, Lionel AC, Prasad A, Pinto D, Joseph-George AM, Noakes C, et al. Hemizygous deletions on chromosome 1p21.3 involving the DPYD gene in individuals with autism spectrum disorder. Clinical genetics. 2011;80:435–443. doi: 10.1111/j.1399-0004.2010.01578.x. [DOI] [PubMed] [Google Scholar]
- Chen EY, Tan CM, Kou Y, Duan Q, Wang Z, Meirelles GV, Clark NR, Ma’ayan A. Enrichr: interactive and collaborative HTML5 gene list enrichment analysis tool. BMC bioinformatics. 2013;14:128. doi: 10.1186/1471-2105-14-128. [DOI] [PMC free article] [PubMed] [Google Scholar]
- Chong JA, Tapia-Ramirez J, Kim S, Toledo-Aral JJ, Zheng Y, Boutros MC, Altshuller YM, Frohman MA, Kraner SD, Mandel G. REST: a mammalian silencer protein that restricts sodium channel gene expression to neurons. Cell. 1995;80:949–957. doi: 10.1016/0092-8674(95)90298-8. [DOI] [PubMed] [Google Scholar]
- Cooper GM, Stone EA, Asimenos G, Program NCS, Green ED, Batzoglou S, Sidow A. Distribution and intensity of constraint in mammalian genomic sequence. Genome research. 2005;15:901–913. doi: 10.1101/gr.3577405. [DOI] [PMC free article] [PubMed] [Google Scholar]
- Cubelos B, Briz CG, Esteban-Ortega GM, Nieto M. Cux1 and Cux2 selectively target basal and apical dendritic compartments of layer II–III cortical neurons. Developmental neurobiology. 2014 doi: 10.1002/dneu.22215. [DOI] [PubMed] [Google Scholar]
- Cubelos B, Sebastian-Serrano A, Beccari L, Calcagnotto ME, Cisneros E, Kim S, Dopazo A, Alvarez-Dolado M, Redondo JM, Bovolenta P, et al. Cux1 and Cux2 regulate dendritic branching, spine morphology, and synapses of the upper layer neurons of the cortex. Neuron. 2010;66:523–535. doi: 10.1016/j.neuron.2010.04.038. [DOI] [PMC free article] [PubMed] [Google Scholar]
- Drmanac R, Sparks AB, Callow MJ, Halpern AL, Burns NL, Kermani BG, Carnevali P, Nazarenko I, Nilsen GB, Yeung G, et al. Human genome sequencing using unchained base reads on self-assembling DNA nanoarrays. Science. 2010;327:78–81. doi: 10.1126/science.1181498. [DOI] [PubMed] [Google Scholar]
- Dunham I, Kundaje A, Aldred SF, Collins PJ, Davis CA, Doyle F, Epstein CB, Frietze S, Harrow J, Kaul R, et al. An integrated encyclopedia of DNA elements in the human genome. Nature. 2012;489:57–74. doi: 10.1038/nature11247. [DOI] [PMC free article] [PubMed] [Google Scholar]
- Ferri AL, Cavallaro M, Braida D, Di Cristofano A, Canta A, Vezzani A, Ottolenghi S, Pandolfi PP, Sala M, DeBiasi S, et al. Sox2 deficiency causes neurodegeneration and impaired neurogenesis in the adult mouse brain. Development. 2004;131:3805–3819. doi: 10.1242/dev.01204. [DOI] [PubMed] [Google Scholar]
- Fullwood MJ, Han Y, Wei CL, Ruan X, Ruan Y. Chromatin interaction analysis using paired-end tag sequencing. In: Ausubel Frederick M, et al., editors. Current protocols in molecular biology. Vol. 15. 2010. pp. 21–25. Chapter 21, Unit 21. [DOI] [PMC free article] [PubMed] [Google Scholar]
- Gao F, Wei Z, Lu W, Wang K. Comparative analysis of 4C-Seq data generated from enzyme-based and sonication-based methods. BMC Genomics. 2013;14:345. doi: 10.1186/1471-2164-14-345. [DOI] [PMC free article] [PubMed] [Google Scholar]
- Gaugler T, Klei L, Sanders SJ, Bodea CA, Goldberg AP, Lee AB, Mahajan M, Manaa D, Pawitan Y, Reichert J, et al. Most genetic risk for autism resides with common variation. Nat Genet. 2014;46:881–885. doi: 10.1038/ng.3039. [DOI] [PMC free article] [PubMed] [Google Scholar]
- Genomes Project C, Auton A, Brooks LD, Durbin RM, Garrison EP, Kang HM, Korbel JO, Marchini JL, McCarthy S, McVean GA, et al. A global reference for human genetic variation. Nature. 2015;526:68–74. doi: 10.1038/nature15393. [DOI] [PMC free article] [PubMed] [Google Scholar]
- Goh Y, Fullwood MJ, Poh HM, Peh SQ, Ong CT, Zhang J, Ruan X, Ruan Y. Chromatin Interaction Analysis with Paired-End Tag Sequencing (ChIA-PET) for mapping chromatin interactions and understanding transcription regulation. Journal of visualized experiments: JoVE. 2012 doi: 10.3791/3770. [DOI] [PMC free article] [PubMed] [Google Scholar]
- Grueber WB, Jan LY, Jan YN. Different levels of the homeodomain protein cut regulate distinct dendrite branching patterns of Drosophila multidendritic neurons. Cell. 2003;112:805–818. doi: 10.1016/s0092-8674(03)00160-0. [DOI] [PubMed] [Google Scholar]
- Hiller M, Schaar BT, Indjeian VB, Kingsley DM, Hagey LR, Bejerano G. A “forward genomics” approach links genotype to phenotype using independent phenotypic losses among related species. Cell reports. 2012;2:817–823. doi: 10.1016/j.celrep.2012.08.032. [DOI] [PMC free article] [PubMed] [Google Scholar]
- Huang DW, Sherman BT, Lempicki RA. Systematic and integrative analysis of large gene lists using DAVID bioinformatics resources. Nat Protocols. 2008;4:44–57. doi: 10.1038/nprot.2008.211. [DOI] [PubMed] [Google Scholar]
- Huang N, Lee I, Marcotte EM, Hurles ME. Characterising and predicting haploinsufficiency in the human genome. PLoS genetics. 2010;6:e1001154. doi: 10.1371/journal.pgen.1001154. [DOI] [PMC free article] [PubMed] [Google Scholar]
- Hughes-Benzie RM, Pilia G, Xuan JY, Hunter AG, Chen E, Golabi M, Hurst JA, Kobori J, Marymee K, Pagon RA, et al. Simpson-Golabi-Behmel syndrome: genotype/phenotype analysis of 18 affected males from 7 unrelated families. American journal of medical genetics. 1996;66:227–234. doi: 10.1002/(SICI)1096-8628(19961211)66:2<227::AID-AJMG20>3.0.CO;2-U. [DOI] [PubMed] [Google Scholar]
- Iossifov I, O’Roak BJ, Sanders SJ, Ronemus M, Krumm N, Levy D, Stessman HA, Witherspoon KT, Vives L, Patterson KE, et al. The contribution of de novo coding mutations to autism spectrum disorder. Nature. 2014;515:216–221. doi: 10.1038/nature13908. [DOI] [PMC free article] [PubMed] [Google Scholar]
- Jin F, Li Y, Dixon JR, Selvaraj S, Ye Z, Lee AY, Yen CA, Schmitt AD, Espinoza CA, Ren B. A high-resolution map of the three-dimensional chromatin interactome in human cells. Nature. 2013;503:290–294. doi: 10.1038/nature12644. [DOI] [PMC free article] [PubMed] [Google Scholar]
- Kanatani S, Honda T, Aramaki M, Hayashi K, Kubo K, Ishida M, Tanaka DH, Kawauchi T, Sekine K, Kusuzawa S, et al. The COUP-TFII/Neuropilin-2 is a molecular switch steering diencephalon-derived GABAergic neurons in the developing mouse brain. Proceedings of the National Academy of Sciences of the United States of America. 2015;112:E4985–4994. doi: 10.1073/pnas.1420701112. [DOI] [PMC free article] [PubMed] [Google Scholar]
- Kelberman D, de Castro SC, Huang S, Crolla JA, Palmer R, Gregory JW, Taylor D, Cavallo L, Faienza MF, Fischetto R, et al. SOX2 plays a critical role in the pituitary, forebrain, and eye during human embryonic development. J Clin Endocrinol Metab. 2008;93:1865–1873. doi: 10.1210/jc.2007-2337. [DOI] [PMC free article] [PubMed] [Google Scholar]
- Kent WJ, Sugnet CW, Furey TS, Roskin KM, Pringle TH, Zahler AM, Haussler D. The human genome browser at UCSC. Genome research. 2002;12:996–1006. doi: 10.1101/gr.229102. [DOI] [PMC free article] [PubMed] [Google Scholar]
- Kircher M, Witten DM, Jain P, O’Roak BJ, Cooper GM, Shendure J. A general framework for estimating the relative pathogenicity of human genetic variants. Nat Genet. 2014;46:310–315. doi: 10.1038/ng.2892. [DOI] [PMC free article] [PubMed] [Google Scholar]
- Lek M, Karczewski K, Minikel E, Samocha K, Banks E, Fennell T, O’Donnell-Luria A, Ware J, Hill A, Cummings B, et al. Analysis of protein-coding genetic variation in 60,706 humans. bioRxiv. 2015 doi: 10.1038/nature19057. [DOI] [PMC free article] [PubMed] [Google Scholar]
- Li G, Fullwood MJ, Xu H, Mulawadi FH, Velkov S, Vega V, Ariyaratne PN, Mohamed YB, Ooi HS, Tennakoon C, et al. ChIA-PET tool for comprehensive chromatin interaction analysis with paired-end tag sequencing. Genome biology. 2010;11:R22. doi: 10.1186/gb-2010-11-2-r22. [DOI] [PMC free article] [PubMed] [Google Scholar]
- Li G, Ruan X, Auerbach RK, Sandhu KS, Zheng M, Wang P, Poh HM, Goh Y, Lim J, Zhang J, et al. Extensive promoter-centered chromatin interactions provide a topological basis for transcription regulation. Cell. 2012;148:84–98. doi: 10.1016/j.cell.2011.12.014. [DOI] [PMC free article] [PubMed] [Google Scholar]
- Li H, Durbin R. Fast and accurate short read alignment with Burrows-Wheeler transform. Bioinformatics. 2009;25:1754–1760. doi: 10.1093/bioinformatics/btp324. [DOI] [PMC free article] [PubMed] [Google Scholar]
- Li H, Handsaker B, Wysoker A, Fennell T, Ruan J, Homer N, Marth G, Abecasis G, Durbin R. The Sequence Alignment/Map format and SAMtools. Bioinformatics. 2009;25:2078–2079. doi: 10.1093/bioinformatics/btp352. [DOI] [PMC free article] [PubMed] [Google Scholar]
- Li Q, Zheng S, Han A, Lin CH, Stoilov P, Fu XD, Black DL. The splicing regulator PTBP2 controls a program of embryonic splicing required for neuronal maturation. eLife. 2014;3:e01201. doi: 10.7554/eLife.01201. [DOI] [PMC free article] [PubMed] [Google Scholar]
- Licatalosi DD, Yano M, Fak JJ, Mele A, Grabinski SE, Zhang C, Darnell RB. Ptbp2 represses adult-specific splicing to regulate the generation of neuronal precursors in the embryonic brain. Genes & development. 2012;26:1626–1642. doi: 10.1101/gad.191338.112. [DOI] [PMC free article] [PubMed] [Google Scholar]
- Lim ET, Raychaudhuri S, Sanders SJ, Stevens C, Sabo A, Macarthur DG, Neale BM, Kirby A, Ruderfer DM, Fromer M, et al. Rare Complete Knockouts in Humans: Population Distribution and Significant Role in Autism Spectrum Disorders. Neuron. 2013;77:235–242. doi: 10.1016/j.neuron.2012.12.029. [DOI] [PMC free article] [PubMed] [Google Scholar]
- Lindblad-Toh K, Garber M, Zuk O, Lin MF, Parker BJ, Washietl S, Kheradpour P, Ernst J, Jordan G, Mauceli E, et al. A high-resolution map of human evolutionary constraint using 29 mammals. Nature. 2011;478:476–482. doi: 10.1038/nature10530. [DOI] [PMC free article] [PubMed] [Google Scholar]
- Ma W, Ay F, Lee C, Gulsoy G, Deng X, Cook S, Hesson J, Cavanaugh C, Ware CB, Krumm A, et al. Fine-scale chromatin interaction maps reveal the cis-regulatory landscape of human lincRNA genes. Nature methods. 2015;12:71–78. doi: 10.1038/nmeth.3205. [DOI] [PMC free article] [PubMed] [Google Scholar]
- McLean CY, Reno PL, Pollen AA, Bassan AI, Capellini TD, Guenther C, Indjeian VB, Lim X, Menke DB, Schaar BT, et al. Human-specific loss of regulatory DNA and the evolution of human-specific traits. Nature. 2011;471:216–219. doi: 10.1038/nature09774. [DOI] [PMC free article] [PubMed] [Google Scholar]
- Melnikov A, Murugan A, Zhang X, Tesileanu T, Wang L, Rogov P, Feizi S, Gnirke A, Callan CG, Jr, Kinney JB, et al. Systematic dissection and optimization of inducible enhancers in human cells using a massively parallel reporter assay. Nature biotechnology. 2012;30:271–277. doi: 10.1038/nbt.2137. [DOI] [PMC free article] [PubMed] [Google Scholar]
- Miller DJ, Duka T, Stimpson CD, Schapiro SJ, Baze WB, McArthur MJ, Fobbs AJ, Sousa AM, Sestan N, Wildman DE, et al. Prolonged myelination in human neocortical evolution. Proceedings of the National Academy of Sciences of the United States of America. 2012;109:16480–16485. doi: 10.1073/pnas.1117943109. [DOI] [PMC free article] [PubMed] [Google Scholar]
- Morrow EM, Yoo SY, Flavell SW, Kim TK, Lin Y, Hill RS, Mukaddes NM, Balkhy S, Gascon G, Hashmi A, et al. Identifying autism loci and genes by tracing recent shared ancestry. Science. 2008;321:218–223. doi: 10.1126/science.1157657. [DOI] [PMC free article] [PubMed] [Google Scholar]
- Nava C, Keren B, Mignot C, Rastetter A, Chantot-Bastaraud S, Faudet A, Fonteneau E, Amiet C, Laurent C, Jacquette A, et al. Prospective diagnostic analysis of copy number variants using SNP microarrays in individuals with autism spectrum disorders. European journal of human genetics: EJHG. 2014;22:71–78. doi: 10.1038/ejhg.2013.88. [DOI] [PMC free article] [PubMed] [Google Scholar]
- Ng PC, Henikoff S. SIFT: Predicting amino acid changes that affect protein function. Nucleic acids research. 2003;31:3812–3814. doi: 10.1093/nar/gkg509. [DOI] [PMC free article] [PubMed] [Google Scholar]
- Nonaka-Kinoshita M, Reillo I, Artegiani B, Martinez-Martinez MA, Nelson M, Borrell V, Calegari F. Regulation of cerebral cortex size and folding by expansion of basal progenitors. The EMBO journal. 2013;32:1817–1828. doi: 10.1038/emboj.2013.96. [DOI] [PMC free article] [PubMed] [Google Scholar]
- Novara F, Rizzo A, Bedini G, Girgenti V, Esposito S, Pantaleoni C, Ciccone R, Sciacca FL, Achille V, Della Mina E, et al. MEF2C deletions and mutations versus duplications: a clinical comparison. European journal of medical genetics. 2013;56:260–265. doi: 10.1016/j.ejmg.2013.01.011. [DOI] [PubMed] [Google Scholar]
- Oksenberg N, Stevison L, Wall JD, Ahituv N. Function and regulation of AUTS2, a gene implicated in autism and human evolution. PLoS genetics. 2013;9:e1003221. doi: 10.1371/journal.pgen.1003221. [DOI] [PMC free article] [PubMed] [Google Scholar]
- Patwardhan RP, Hiatt JB, Witten DM, Kim MJ, Smith RP, May D, Lee C, Andrie JM, Lee SI, Cooper GM, et al. Massively parallel functional dissection of mammalian enhancers in vivo. Nature biotechnology. 2012;30:265–270. doi: 10.1038/nbt.2136. [DOI] [PMC free article] [PubMed] [Google Scholar]
- Pennacchio LA, Ahituv N, Moses AM, Prabhakar S, Nobrega MA, Shoukry M, Minovitsky S, Dubchak I, Holt A, Lewis KD, et al. In vivo enhancer analysis of human conserved non-coding sequences. Nature. 2006;444:499–502. doi: 10.1038/nature05295. [DOI] [PubMed] [Google Scholar]
- Pollard KS, Hubisz MJ, Rosenbloom KR, Siepel A. Detection of nonneutral substitution rates on mammalian phylogenies. Genome research. 2010;20:110–121. doi: 10.1101/gr.097857.109. [DOI] [PMC free article] [PubMed] [Google Scholar]
- Pollard KS, Salama SR, King B, Kern AD, Dreszer T, Katzman S, Siepel A, Pedersen JS, Bejerano G, Baertsch R, et al. Forces shaping the fastest evolving regions in the human genome. PLoS genetics. 2006a;2:e168. doi: 10.1371/journal.pgen.0020168. [DOI] [PMC free article] [PubMed] [Google Scholar]
- Pollard KS, Salama SR, Lambert N, Lambot MA, Coppens S, Pedersen JS, Katzman S, King B, Onodera C, Siepel A, et al. An RNA gene expressed during cortical development evolved rapidly in humans. Nature. 2006b;443:167–172. doi: 10.1038/nature05113. [DOI] [PubMed] [Google Scholar]
- Prabhakar S, Visel A, Akiyama JA, Shoukry M, Lewis KD, Holt A, Plajzer-Frick I, Morrison H, Fitzpatrick DR, Afzal V, et al. Human-specific gain of function in a developmental enhancer. Science. 2008;321:1346–1350. doi: 10.1126/science.1159974. [DOI] [PMC free article] [PubMed] [Google Scholar]
- Quinlan AR, Hall IM. BEDTools: a flexible suite of utilities for comparing genomic features. Bioinformatics. 2010;26:841–842. doi: 10.1093/bioinformatics/btq033. [DOI] [PMC free article] [PubMed] [Google Scholar]
- Rice P, Longden I, Bleasby A. EMBOSS: the European Molecular Biology Open Software Suite. Trends in genetics: TIG. 2000;16:276–277. doi: 10.1016/s0168-9525(00)02024-2. [DOI] [PubMed] [Google Scholar]
- Roadmap Epigenomics C, Kundaje A, Meuleman W, Ernst J, Bilenky M, Yen A, Heravi-Moussavi A, Kheradpour P, Zhang Z, Wang J, et al. Integrative analysis of 111 reference human epigenomes. Nature. 2015;518:317–330. doi: 10.1038/nature14248. [DOI] [PMC free article] [PubMed] [Google Scholar]
- Rodriguez-Tornos FM, San Aniceto I, Cubelos B, Nieto M. Enrichment of conserved synaptic activity-responsive element in neuronal genes predicts a coordinated response of MEF2, CREB and SRF. PloS one. 2013;8:e53848. doi: 10.1371/journal.pone.0053848. [DOI] [PMC free article] [PubMed] [Google Scholar]
- Saito T, Hanai S, Takashima S, Nakagawa E, Okazaki S, Inoue T, Miyata R, Hoshino K, Akashi T, Sasaki M, et al. Neocortical layer formation of human developing brains and lissencephalies: consideration of layer-specific marker expression. Cerebral cortex. 2011;21:588–596. doi: 10.1093/cercor/bhq125. [DOI] [PubMed] [Google Scholar]
- Sanders SJ, He X, Willsey AJ, Ercan-Sencicek AG, Samocha KE, Cicek AE, Murtha MT, Bal VH, Bishop SL, Dong S, et al. Insights into Autism Spectrum Disorder Genomic Architecture and Biology from 71 Risk Loci. Neuron. 2015;87:1215–1233. doi: 10.1016/j.neuron.2015.09.016. [DOI] [PMC free article] [PubMed] [Google Scholar]
- Schwarz JM, Rodelsperger C, Schuelke M, Seelow D. MutationTaster evaluates disease-causing potential of sequence alterations. Nature methods. 2010;7:575–576. doi: 10.1038/nmeth0810-575. [DOI] [PubMed] [Google Scholar]
- Shihab HA, Gough J, Cooper DN, Stenson PD, Barker GL, Edwards KJ, Day IN, Gaunt TR. Predicting the functional, molecular, and phenotypic consequences of amino acid substitutions using hidden Markov models. Hum Mutat. 2013;34:57–65. doi: 10.1002/humu.22225. [DOI] [PMC free article] [PubMed] [Google Scholar]
- Somel M, Liu X, Khaitovich P. Human brain evolution: transcripts, metabolites and their regulators. Nature reviews Neuroscience. 2013;14:112–127. doi: 10.1038/nrn3372. [DOI] [PubMed] [Google Scholar]
- Stamatakis A. RAxML version 8: a tool for phylogenetic analysis and post-analysis of large phylogenies. Bioinformatics. 2014;30:1312–1313. doi: 10.1093/bioinformatics/btu033. [DOI] [PMC free article] [PubMed] [Google Scholar]
- Untergasser A, Nijveen H, Rao X, Bisseling T, Geurts R, Leunissen JA. Primer3Plus, an enhanced web interface to Primer3. Nucleic acids research. 2007;35:W71–74. doi: 10.1093/nar/gkm306. [DOI] [PMC free article] [PubMed] [Google Scholar]
- Veugelers M, Cat BD, Muyldermans SY, Reekmans G, Delande N, Frints S, Legius E, Fryns JP, Schrander-Stumpel C, Weidle B, et al. Mutational analysis of the GPC3/GPC4 glypican gene cluster on Xq26 in patients with Simpson-Golabi-Behmel syndrome: identification of loss-of-function mutations in the GPC3 gene. Hum Mol Genet. 2000;9:1321–1328. doi: 10.1093/hmg/9.9.1321. [DOI] [PubMed] [Google Scholar]
- Wang K, Li M, Hakonarson H. ANNOVAR: functional annotation of genetic variants from high-throughput sequencing data. Nucleic acids research. 2010;38:e164. doi: 10.1093/nar/gkq603. [DOI] [PMC free article] [PubMed] [Google Scholar]
- Weedon MN, Cebola I, Patch AM, Flanagan SE, De Franco E, Caswell R, Rodriguez-Segui SA, Shaw-Smith C, Cho CH, Lango Allen H, et al. Recessive mutations in a distal PTF1A enhancer cause isolated pancreatic agenesis. Nat Genet. 2014;46:61–64. doi: 10.1038/ng.2826. [DOI] [PMC free article] [PubMed] [Google Scholar]
- Willemsen MH, Valles A, Kirkels LA, Mastebroek M, Olde Loohuis N, Kos A, Wissink-Lindhout WM, de Brouwer AP, Nillesen WM, Pfundt R, et al. Chromosome 1p21.3 microdeletions comprising DPYD and MIR137 are associated with intellectual disability. Journal of medical genetics. 2011;48:810–818. doi: 10.1136/jmedgenet-2011-100294. [DOI] [PubMed] [Google Scholar]
- Xu K, Schadt EE, Pollard KS, Roussos P, Dudley JT. Genomic and network patterns of schizophrenia genetic variation in human evolutionary accelerated regions. Molecular biology and evolution. 2015 doi: 10.1093/molbev/msv031. [DOI] [PMC free article] [PubMed] [Google Scholar]
- Yamada T, Yang Y, Huang J, Coppola G, Geschwind DH, Bonni A. Sumoylated MEF2A coordinately eliminates orphan presynaptic sites and promotes maturation of presynaptic boutons. The Journal of neuroscience: the official journal of the Society for Neuroscience. 2013;33:4726–4740. doi: 10.1523/JNEUROSCI.4191-12.2013. [DOI] [PMC free article] [PubMed] [Google Scholar]
- Yang Z. A space-time process model for the evolution of DNA sequences. Genetics. 1995;139:993–1005. doi: 10.1093/genetics/139.2.993. [DOI] [PMC free article] [PubMed] [Google Scholar]
- Yu TW, Chahrour MH, Coulter ME, Jiralerspong S, Okamura-Ikeda K, Ataman B, Schmitz-Abe K, Harmin DA, Adli M, Malik AN, et al. Using whole-exome sequencing to identify inherited causes of autism. Neuron. 2013;77:259–273. doi: 10.1016/j.neuron.2012.11.002. [DOI] [PMC free article] [PubMed] [Google Scholar]
- Zang C, Schones DE, Zeng C, Cui K, Zhao K, Peng W. A clustering approach for identification of enriched domains from histone modification ChIP-Seq data. Bioinformatics. 2009;25:1952–1958. doi: 10.1093/bioinformatics/btp340. [DOI] [PMC free article] [PubMed] [Google Scholar]
Associated Data
This section collects any data citations, data availability statements, or supplementary materials included in this article.