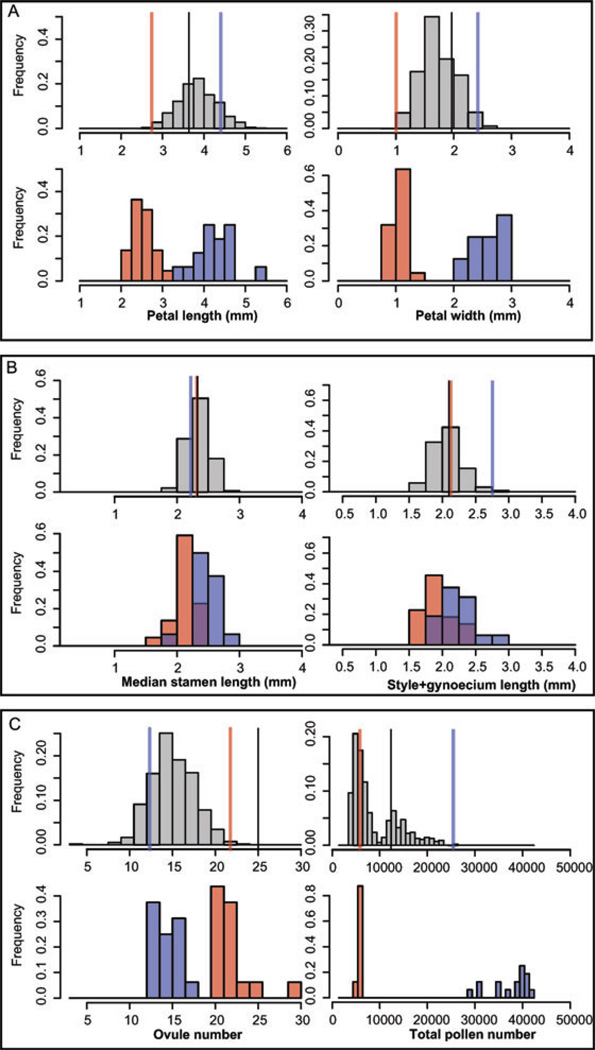
Figure 2.
Histograms of representative floral and reproductive traits in the F2 (grey) as well as in Capsella rubella (red) and C. grandiflora (blue). Phenotypic values of the parental accessions are shown as lines in the upper panel of each plot (C. rubella 1GR1 in red, C. grandiflora 2e-TS1 in blue, and the F1 value in black). The traits are A. Petal length (mm) (left), Petal width (mm) (right), B. Median stamen length (mm) (left), Style + gynoecium length (mm) (right), C. Ovule number per flower (left), and Pollen number per flower (right).

