ABSTRACT
Synthetic cannabinoids were originally developed by academic and pharmaceutical laboratories with the hope of providing therapeutic relief from the pain of inflammatory and degenerative diseases. However, recreational drug enthusiasts have flushed the market with new strains of these potent drugs that evade detection yet endanger public health and safety. Although many of these drug derivatives were published in the medical literature, others were merely patented without further characterization. AB‐FUBINACA is an example of one of the new indazole‐carboxamide synthetic cannabinoids introduced in the past year. Even though AB‐FUBINACA has become increasingly prominent in forensic drug and toxicology specimens analyses, little is known about the pharmacology of this substance. To study its metabolic fate, we utilized Wistar rats to study the oxidative products of AB‐FUBINACA in urine and its effect on gene expressions in liver and heart. Rats were injected with 5 mg/kg of AB‐FUBINACA each day for 5 days. Urine samples were collected every day at the same time. On day 5 after treatment, we collected the organs such as liver and heart. The urine samples were analyzed by mass spectrometry, which revealed several putative metabolites and positioning of the hydroxyl addition on the molecule. We used quantitative PCR gene expression array to analyze the hepatotoxicity and cardiotoxicity on these rats and confirmed by real‐time quantitative RT‐PCR. We identified three genes significantly associated with dysfunction of oxidation and inflammation. Our study reports in vivo metabolites of AB‐FUBINACA in urine and its effect on the gene expressions in liver and heart. J. Cell. Biochem. 117: 1033–1043, 2016. © 2015 The Authors. Journal of Cellular Biochemistry Published by Wiley Periodicals. Inc.
Keywords: SYNTHETIC CANNABINOIDS, AB‐FUBINACA, GENE EXPRESSION, RAT, URINE
At the turn of the 21st century, cannabinoid receptor research yielded thousands of indole‐based agonists in an attempt to minimize the psychedelic effects yet maximize the anti‐inflammatory and orexigenic effects associated with marijuana intoxication. The first analogues that paved the way were the JWH series, typically found as napthoyl‐indole compounds developed by John W. Huffman from Clemson University [Huffman et al., 2005]. Others soon followed such as the AM series by Alexandros Makriyannis that introduced halogenated derivatives of related JWH types, as well as newer phenyl‐indole compounds [Palmer et al., 2002]. By the end of the decade, these synthetic cannabinoid products were flooding both the online and the local markets with packages of herbal blends sold as “incense” or “spice” to avoid legal scrutiny. Therefore, these products have become the prevalent drugs of abuse in the past several years due to their easy availability, potency, ambiguous legal status, and invisibility in routine urine drug screens.
AB‐FUBINACA (C20H21FN4O2) is a synthetic cannabinoid that was originally described in a 2009 patent filed by Pfizer Global Research & Development as an alternative analog based on an indazole‐carboxamide substructure [Buchler, 2009]. Although there are no specific references to the name AB‐FUBINACA, the patent describes 523 analogues with C20H21FN4O2 references to AB‐FUBINACA as “Example 2”. In vitro data shows that this compound is a very potent ligand for the cannabinoid (CB1) receptor, with a binding constant of 0.9 nM and an EC50 of 23.2 nM for receptor activation as measured by GTPγS hydrolysis [Thomsen et al., 2015]. By 2012, AB‐FUBINACA was found in blended herbal products in Japan, Europe, and the United States. In early 2014, the drug was placed on the DEA Controlled Substances List as a Schedule I drug Drug Enforcement Administration in Department of Justice [2014]. These actions had very little impact in deterring its manufacture and distribution, since it had largely replaced the JWH and AM series as the active compound in herbal products.
Information about the toxicity and metabolic characteristics of these substances often lags behind the distribution and usage in the public domain. Meanwhile, the “users” visited hospital emergency departments with extreme paranoia and agitation without a clear diagnosis of the origin [Zimmermann et al., 2009; Freeman et al., 2013; Behonick et al., 2014]. In order to better understand the toxicological implications of this new synthetic cannabinoid, there is a critical need to identify the metabolites for clinical and forensic detection. Our hypothesis was formed to study the oxidative products resulting from AB‐FUBINACA metabolism, its effect on the gene expressions on liver and heart, and the excreted compounds in urine using a rat animal model.
Recent advances in mass spectrometry technology makes it possible to perform sensitive data collection on toxicology specimens when volumes are limited and drug concentrations are low [Guale et al., 2013; Kronstrand et al., 2014]. In our study, we described our results from scanning urine by liquid chromatography time‐of‐flight mass spectrometry (LC‐TOF/MS). It is possible to set multiple acquisition cycles to screen by liquid chromatography tandem mass spectrometry (LC‐MS/MS) [Freijo et al., 2014], but we employed this technique to perform structural studies of putative hydroxylation sites. A recent study reported the findings of metabolites by incubating AB‐FUBINACA in human liver microsomes [Takayama et al., 2014]; our study is the first to determine the metabolites of AB‐FUBINACA excreted in rat urine and to investigate its effect on gene expressions on heart and liver.
MATERIALS AND METHODS
CHEMICALS AND REAGENTS
The AB‐FUBINACA reference standard and AB‐FUBINACA‐d4 internal standard were purchased from Cayman Chemical (Ann Arbor, MI). Solvents, salts, and other liquids such as isopropanol, 1‐chlorobutane, ammonium formate, magnesium sulfate, dimethyl sulfoxide, ammonium hydroxide, and acetic acid were purchased from Sigma–Aldrich (St. Louis, MO). GC/GC–MS grade methanol was obtained from Honeywell Burdick and Jackson (Morristown, NJ). Test tubes were obtained from Fisher Scientific (Pittsburgh, PA).
ANIMAL EXPERIMENTAL PROCEDURES
Wistar rats were purchased from Harlan Laboratories (Houston, TX). Rats weighing from 160 to 200 g were housed in a temperature and humidity controlled room with a 12:12 h light‐dark cycle with ad libitum access to food and water. After acclimatization, each rat was transferred to an individual metabolic cage for the course of the experiment. Each experimental animal (n = 5) was delivered via peritoneal injection daily for 5 days with 5 mg/kg of AB‐FUBINACA dissolved in dimethyl sulfoxide. The control animals (n = 3) were treated the same as experimental group and received dimethyl sulfoxide injections daily. Urine samples of day 1 were collected at 3, 6, 9, 12, and 24 h after injection, whereas for the rest of the study, urines were collected every 24 h daily after the injection. Urine samples were frozen and stored at −20°C until analysis. At day 5, the end of the experiment, each rat was sacrificed; tissues including liver and heart were collected for gene expression analyses. All animal experiments were conducted in accordance with the guidelines of the Animal Protocol Review committee of the Texas Southern University, Houston, TX.
PREPARATION OF URINE SAMPLES FOR MASS SPECTROMETRY ANALYSIS
Liquid–liquid extractions were used to prepare specimens for TOF screening and LC‐MS/MS structural elucidation. Urine samples were thawed at room temperature for complete dissolving the ice particles before the extraction step. We transferred 0.2 ml of urine to a fresh test tube for the following extraction. The pH of the solution was alkalinized by adding 0.2 ml of 100 mM ammonium hydroxide (pH 10), followed by the addition of 1.0 ml isopropanol and 1.0 ml of 1‐chlorobutane. An aqueous solution consisting of 2.0 ml saturated magnesium sulfate was added to each tube followed by vortexing and centrifugation. The organic layer was removed by glass pipette to a fresh test tube and evaporated to dryness under nitrogen stream. All samples were reconstituted by 0.2 ml of 7 mM ammonium formate in water/acetonitrile (9:1) for instrumental analysis.
LC‐TOF/MS
Drug metabolite screening was accomplished by LC‐TOF/MS scanning according to our previously published protocol [Guale et al., 2013]. Briefly, the liquid chromatograph was powered by an Agilent 1290 Infinity system consisting of binary pumps, degasser, column heater, and auto‐sampler. Based on manufacturer recommendations, the pumps were programmed to deliver an increasing gradient of methanol against an aqueous mobile phase of 5 mM ammonium formate over the following time course: 5% methanol from 0 to 0.5 min, increasing to 30% methanol at 1.5 min, 60% methanol at 4.5 min, to 95% methanol at 6.5 min, and a reset to 5% methanol as acquisition stopped at 10 min with a 3 min post‐run. Separations were performed using an Agilent Eclipse Plus C18 1.8 mm, 3.0 × 100 mm column. The auto‐sampler injected 4 μl of sample per run, with automated needle washes in between. The column flow rate was kept at 0.6 ml/min with the heater at a constant 50°C.
The mass analyzer was an Agilent 6230 TOF‐MS operated in positive ion scan mode with mass scanning from 100 to 1000 m/z. The ion source was upgraded from the original Agilent Jet Stream (AJS) source to the dual‐sprayer version for improved reference mass delivery. The instrument acquired data using the following parameters: drying gas temperature 350°C, drying gas flow 8.0 L/min, nebulizer 35 psi, sheath gas temperature 400°C, sheath gas flow 11 L/min, VCap 3500 V, nozzle 0 V, fragmentor 125 V, skimmer 65 V, and octopole RF peak 750 V. A constant flow of Agilent TOF reference solution through the reference nebulizer allowed the system to continuously correct for any mass drift by using the reference mass ions purine at 121.05087 m/z and HP‐921 at 922.00979 m/z.
LC‐MS/MS
The quantitative analysis of AB‐FUBINACA was carried out by an Agilent 6460 tandem mass spectrometer, integrated with the Agilent 1200 liquid chromatography system. Separations were performed using an Agilent Eclipse Plus C18 1.8 mm, 3.0 × 100 mm column. The mobile phases A and B consisted of 7 mM ammonium formate and 0.05% formic acid in water and acetonitrile, respectively. The gradient program followed a course of 7% mobile phase B, which increased to 10% B at 2.0 min, 50% B at 5.0 min, 85% B at 7.0 min for 3 min, and then a reset to 7% B at 10 min with a 6 min post‐run to re‐equilibrate the column. The auto‐sampler injected 4 μl of sample per run, with automated needle washes in between. The flow rate was 0.4 ml/min with temperature control at 50°C.
The mass analyzer was operated in positive mode with the following instrumental parameters settings: capillary voltage 3.5 kV, fragmentor voltage 125 V, skimmer voltage 65 V, drying gas flow rate 8.0 L/min set to 350°C, sheath gas flow rate 11 L/min set at 400°C, and nebulizer at 35 psi. For AB‐FUBINACA, the data acquisition method was specified with the precursor ion at 369.2 m/z to transitions of 324 m/z and 252.9 m/z and precursor ion at 373.2 m/z to transitions of 328.1 m/z and 109 m/z for AB‐ FUBINACA‐d4. One of the primarily anticipated metabolites was through hydroxylation, so metabolite fragmentation studies were carried out with a precursor ion monitored at 385.2 m/z [M + 16] as an oxidized product. Another potential metabolite is the further desalkylation of the 4‐fluorobenzyl groups from the hydroxylated derivative to yield a 277 m/z product. These metabolites were fragmented with collision energies of 20 V and 38 V, respectively.
REAL‐TIME PCR FOR RT2 PROFILER PCR ARRAYS
RT2 Profiler PCR arrays are a sensitive gene expression profiling real‐time PCR‐based technology for analyzing focused panels of genes involved in biological process, signal transduction, or disease research pathways. We chose to study the effect of AB‐FUBINACA on toxicity in the liver and heart.
EXTRACTION OF TOTAL RNAs FROM LIVER AND HEART
Total RNA was extracted from 100 to 200 mg of liver and heart tissues using the Trizol reagent (Invitrogen, Inc.), followed by Qiagen RNeasy Mini Kit (Qiagen, Inc.). RNA concentrations were determined by spectrophotometry, and RNA integrity based on 28S and 18S was evaluated on a 1% agarose gel.
FIRST‐STRAND cDNA SYNTHESIS
We used 4 μg total RNA for reverse transcription of each sample using the RT2 first‐strand kit (Qiagen). The genomic DNA was eliminated follow the instruction in the kit. We generated the cDNA by incubating the reaction at 42°C for 15 min as described in the kit. The product was ready for RT2 profiler PCR arrays.
RT2 PROFILER PCR ARRAYS
We studied the gene expression profile of hepatotoxicity for the rat liver (PARN‐093ZE‐2) and cardiotoxicity for the rat heart (PARN‐095ZE‐2). Both PCR arrays were purchased from Qiagen (Qiagen). The 384‐well array plate contains 4 replicate primer assays for 84 pathway‐genes and 5 housekeeping genes. In addition, one well contains a genomic DNA control, three wells contain reverse‐transcription controls, and three wells contain positive PCR controls.
Briefly, we prepare PCR reaction containing cDNA synthesis reaction mixture with RT2 SYBR Green ROX master mix. We applied 20 μl mixtures to each well and sealed the array. The PCR assay was performed using the ABI Prism 7900HT Sequence Detection System (Applied Biosystems, Inc.). The PCR reaction was performed using the protocol as suggested by Qiagen: Hot Start denaturation at 95° C for 10 min, followed by 40 cycles of 95°C for 15 s and 60°C for 1 min to perform fluorescence data collection.
GENE EXPRESSION DATA ANALYSIS
We used the ΔΔCt method to analyze the results. The software was provided by Qiagen RT2 Profiler Data Analysis Software. A Ct value equal to 35 is considered a negative call. The wells of genomic DNA should be greater than 35, which indicate the contamination of genomic DNA is very low to affect the gene expression profiling. The average Ct of the positive PCR controls should be 20 ± 2 on each RT2 profiler PCR array, which indicates efficient PCR amplification. Each gene was normalized with housekeeping genes to obtain ΔCt value. We used hypoxanthine phosphoribosyltransferase 1 (Hprt1) as the housekeeping gene for this study. In this study, we have five rats treated with AB‐FUBINACA in DMSO and we have three rats as controls injected with DMSO. The ΔΔCt was calculated for each gene of experimental group (n = 5) and control group (n = 3). The fold‐change for each gene from experimental group to control group was calculated as 2(−ΔΔCt). If the fold‐change is greater than 1, the result is reported as a fold up‐regulation. If the fold‐change is less than 1, the negative inverse of the result is reported as a fold down‐regulation. The P values are calculated based on a Student's t‐test of the replicate 2^ (−ΔCt) values for each gene in the control group and treatment groups, and P values less than 0.05 are significant. We provide the complete list of gene expression data analysis including fold changes and P values as supplement in excel format.
REAL‐TIME QUANTITATIVE RT‐PCR ASSAY
We chose to use real‐time quantitative RT‐PCR method to confirm the altered gene expression levels that were determined by RT2 profiler PCR array. Briefly, total RNA (1 μg) was treated with DNase I (Zymo Research, Inc.) to remove trace amount of contamination of genomic DNA. We synthesized the cDNA from each RNA sample using a high capacity cDNA reverse transcription kit supplied by Applied Biosystems (Applied Biosystems, Inc.) The cDNA was subsequently used for real‐time quantitative PCR to quantify the gene expression levels. We used SYBR Green I dye (SYBR Green PCR kit, Applied Biosystem) to employ real‐time quantitative PCR using ABI Prism 7900 Sequence Detection System (Applied Biosystems) [Dutta et al., 2003; Mak et al., 2010]. The primers were designed using GenScript Real‐time PCR Primer Design software, with primer crossing exon junction.
The nucleotide sequences of each primer were Blast searched against the Genbank database to confirm the uniqueness of each primer. We listed the primers used for this study in Table I. The concentration of each primer was optimized. The Ct value of each sample was normalized with endogenous house keeping gene Hprt1. We used unpaired student t‐test one‐tail statistic to evaluate the difference between control and experimental treated samples (Prism ver. 5.0). The P‐value of <0.05 is considered significant.
Table I.
Primer Sequences of Rat Used by Real‐Time Quantitative RT‐PCR
| Gene | Primer sequences | Concentration used for the assay |
|---|---|---|
| Liver | ||
| Abcd4 | Forward primer 5′ GGATTGGAGAGCTTCAGGAG | 2 μM |
| Reverse primer 5′GCAGTGTCTGATGGCTCTGT | 2 μM | |
| Hao2 | Forward primer 5′CTGGGACTTCAACAAGCAGA | 2 μM |
| Reverse primer 5′TCGCCTATTGCCAAGTACAG | 2 μM | |
| Map3k6 | Forward primer 5′TCAGCATGACCAACAATGTG | 2 μM |
| Reverse primer 5′AACGCAATCCGAGTTCTTCT | 2 μM | |
| Mbl2 | Forward primer 5′CCCTGTTCACATCCTTCCTT | 2 μM |
| Reverse primer 5′AGAACTGCAGGCAATCACAG | 2 μM | |
| Lss | Forward primer 5′AGTGTACCTCCGCAGTGATG | 2 μM |
| Reverse primer 5′TTGAGGGTCTCCCTGATCTC | 2 μM | |
| Heart | ||
| Ccl7 | Forward primer 5′TCCCTGGGAAGCTGTTATCT | 2 μM |
| Reverse primer 5′CAGGGCTTTGGAGTTGAAGT | 2 μM | |
| Cfd | Forward primer 5′GCTTCAGTGCAAGTGAATGG | 2 μM |
| Reverse primer 5′ACCTCATCCTTGGTCACTCC | 2 μM | |
| House keeping gene | ||
| Hprt1 | Forward primer 5′AGGACCTCTCGAAGTGTTGG | 2 μM |
| Reverse primer 5′TTTCCACTTTCGCTGATGAC | 2 μM |
RESULTS
AB‐FUBINACA AND ITS DERIVATIVES ARE DETECTED IS DETECTED IN THE URINE BY LC‐ TOF/MS
The chemical structure of AB‐FUBINACA is shown in Figure 1A. We used time‐of‐flight analysis to measure the concentration of AB‐FUBINACA in urines collected at 3, 6, 9, and 24 h after a single dosage injection in rats (n = 5). The time curve of AB‐FUBINACA concentration in urines is shown in Figure 1B. The result shows that excreted AB‐FUBINACA was readily detected in urine at 3 h after the injection, and the excreted compound decreased gradually but maintained at approximately 50% of the concentration of the 3 h time point. This result demonstrated that AB‐FUBINACA is detectable in the urine and the degradation of the compound is slow.
Figure 1.
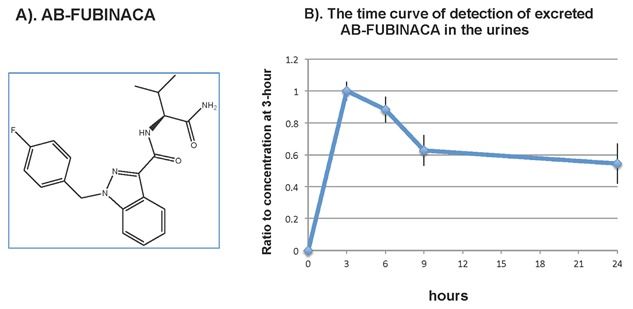
Chemical structure of AB‐FUBINACA and the detection of excreted AB‐FUBINACA in the urines. (A) Chemical structure of AB‐FUBINACA. (B) The time curve of detection of excreted AB‐FUBINACA in the urines from rats after administered AB‐FUBINACA daily via peritoneal cavity in rats. As described in the method, Wistar rats (n = 5) were injected via peritoneal cavity with 5 mg/kg body weight of AB‐FUBINACA. Urine samples were collected at 3, 6, 9, and 24 h after treatment. The concentration of excreted AB‐FUBINACA was determined using LC‐TOF/MS. The results were expressed as the ratio of AB‐FUBINACA at 3 h versus time.
LC‐MS/MS DETECTS AB‐FUBINACA DERIVATIVES IN THE URINE
The TOF mass spectrophotometry detected AB‐FUBINACA peak at retention time of 6.51 min with m/z 369.1731 and salt form of m/z 391.1550 (Fig. 2A). We also detected two prominent peaks, which revealed an accurate mass at m/z 385.1683 with its corresponding salt form at m/z 407.1499 (metabolite‐1, Fig. 2B), and the metabolite‐2 of m/z 277.1311 paired with its sodium adduct at m/z 299.1123 (Fig. 2C). The peak with m/z 277.1311 was eluted at retention time of 3.91 min, followed by the second peak with m/z 385.1683 at 6.09 min.
Figure 2.
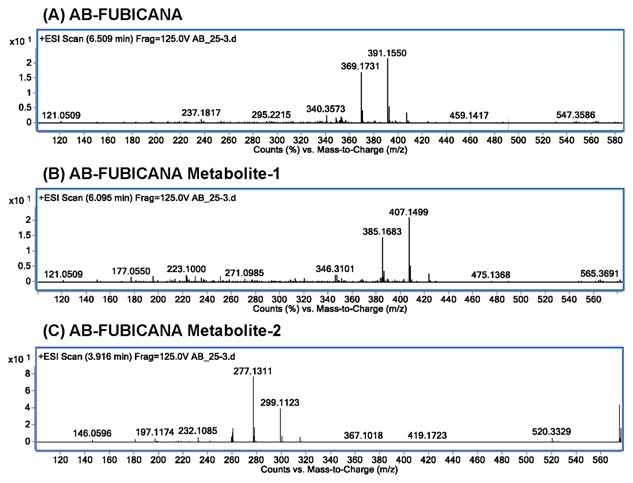
The TOF mass spectrum for AB‐FUBINACA and its metabolites. (A) The TOF mass spectrum for AB‐FUBINACA at retention time of 6.509 min yielded exact mass of m/z 369.1731, paired with salt adduct m/z 391.1550. (B) The TOF mass spectrum for AB‐FUBINACA metabolite‐1 at retention time of 6.095 min shows exact mass of m/z 385.1683, paired with salt adduct m/z 407.1499. (C) The TOF mass spectrum for AB‐FUBINACA metabolite‐2 at retention time of 3.916 min shows exact mass of m/z 277.1311, paired with salt adduct m/z 299.1123.
We calculated the total area of these two dominant peaks including the protonated and salt form; we showed that the two derivatives (hydroxy metabolite‐1 and Metabolite‐2) were increased with time in the urines. Figure 3A is shown as the LC‐TOF/ms mass result of AB‐FUBINACA, it is the spectrum of AB‐FUBINACA when applied with collision energy of 20 V. We detected much more metabolite‐2 in the urine (Fig. 3B). Furthermore, we observed that as the concentration of native form of AB‐FUBINACA decreased gradually, the derivative forms increased with time (Fig. 3B), which suggested that the parent compound AB‐FUBINACA converted to hydroxyl metabolite‐1 and metabolite‐2.
Figure 3.
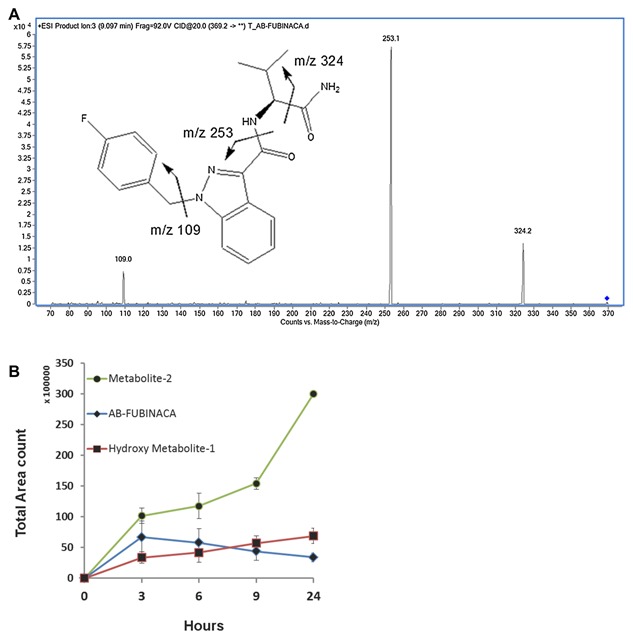
The conversion of AB‐FUBINACA to its derivatives in rat urines as determined by LC‐TOF/MS. (A) The LC‐tandem mass result for AB‐FUBINACA: The spectrum of AB‐FUBINACA by LC‐TOF/MS when applied with collision energy of 20 V. The m/z of 109, 253, and 324 are shown. (B) We used LC‐TOF/MS to determine the concentration of excreted AB‐FUBINACA (blue diamond) and its derivatives, hydroxyl metabolite‐1 (red square) and metabolite‐2 (green circle) at 3, 6, 9, and 24 h after day‐1 injection of 5 mg/kg of AB‐FUBINACA via peritoneal cavity. The results are presented as total area count versus time (hours).
STRUCTURAL ELUCIDATION OF AB‐FUBINACA DERIVATIVES IN URINE BY LC‐MS/MS
We used product‐ion‐scan to elucidate the structure information of metabolite isomers of compounds m/z 277 (metabolite‐2) and m/z 385 (hydroxyl metabolite‐1). We applied with a collision energy of 38 V, the compound m/z 277 eluted at 6.95 min yielded fragments of m/z 145 and m/z 117, suggesting a structure of hydroxyl AB‐FUBINACA with eliminated 4‐fluorobenzyl group (Fig. 4A). This result also suggested that the hydroxylation occurred at alkyl moiety. This is the major metabolite. The m/z 385 eluted at 8.63 min yielded product ions of m/z 340, 253 and 109, suggesting a structure of oxidized AB‐FUBINACA with hydroxyl group at alkyl moiety (Fig. 4B).
Figure 4.
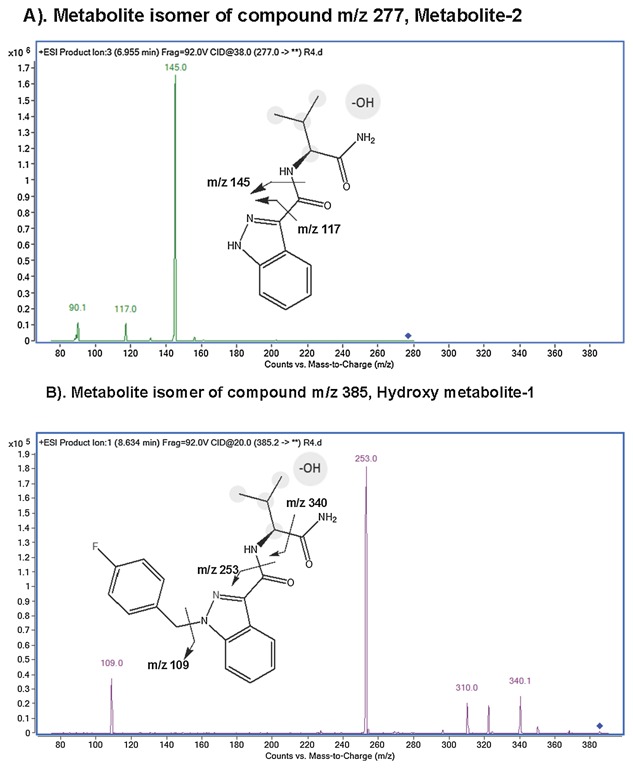
The chemical structures of AB‐FUBINACA derivatives, metabolite‐2 and hydroxyl metabolite‐1. (A) The major metabolite (metabolite‐2) is shown. It is resulted from hydroxylation and N‐dealkylation of AB‐FUBINACA in the rat. The ion exchange of the chemical structure is shown. (B) The second abundant of metabolite (Hydroxy metabolite‐1) is shown. The metabolite contains hydroxyl group on the propyl moiety.
Taken together, using LC‐MS/MS we can detect the compound of AB‐FUBINACA and its metabolites in the urines from rats treated with AB‐FUBINACA.
THE EFFECT OF AB‐FUBINACA ON GENE EXPRESSIONS IN THE LIVER AND HEART
Next, we studied the effect of AB‐FUBINACA on gene expressions in the livers and hearts on the rats treated with the compound. We investigated the genes involved in hepatotoxicity and cadiotoxicity. Each pathway contains 84 genes; we used the real‐time PCR to profile the pathway after AB‐FUBINACA treatment in rats.
As shown in Figure 5 in the liver, 17 genes were up‐regulated (>two‐folds, shown in Red dots) and 11 genes were down‐regulated (<two‐folds, shown in green dots) after AB‐FUBINACA treatment. In the hearts (Fig. 6), 13 genes were up‐regulated and 3 genes were down‐regulated after AB‐FUBINACA treatment. Among these differentially regulated genes, we identified five genes (Abcb4, Hao2, Map3k6, Mbl2, and Lss) in the liver and two genes (Ccl7 and Cfd) in the heart, which were significantly regulated (P‐value is less than or equal to 0.05) analyzed by PCR array.
Figure 5.
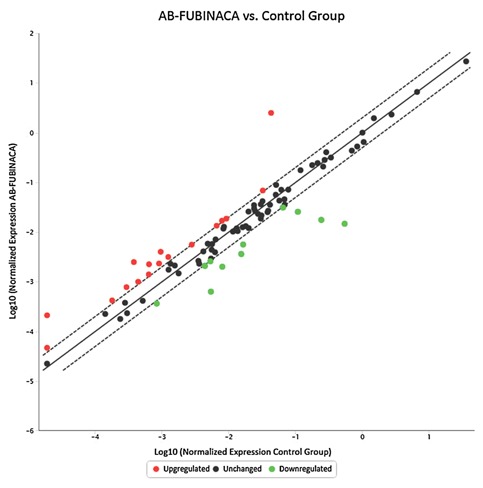
The gene expression profile of hepatotoxicity in rat livers after AB‐FUBINACA treatment. The scatter plot is generated as log 10 of 2^ (‐ΔCt) in AB‐FUBINACA treated experimental group in Y‐axis versus log 10 of 2^ (−ΔCt) in controls in X‐axis. The Y‐axis is Log10 based from −6 to +2. The X‐axis is Log10 based from −5 to +1. Each data point is expressed as fold‐changes calculated from 2(−ΔΔCt). Each gene was the average of experimental group n = 5 and control group n = 3. Among the 84 genes studied, the dotted line represents genes unchanged (less and equal to twofold; black dot). The up‐regulated genes represent genes of fold changes greater than twofold (Red dots). There are 17 genes upregulated genes. The down‐regulated genes represent genes of fold changes less than twofold (green dots). There are 11 down‐regulated genes.
Figure 6.
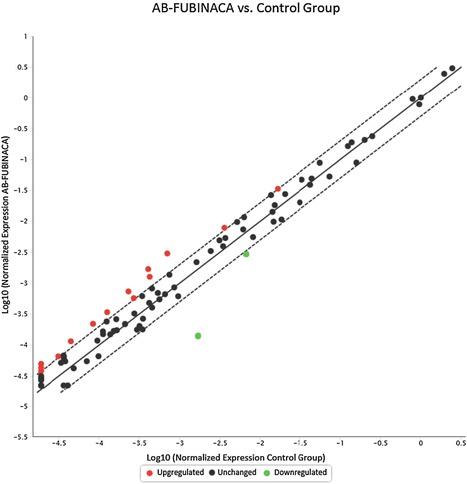
The gene expression profile of cardiotoxicity in rat hearts after AB‐FUBINACA treatment. The scatter plot is generated as log 10 of 2^ (−ΔCt) in AB‐FUBINACA treated experimental group in Y‐axis versus log 10 of 2^ (−ΔCt) in controls in X‐axis. Each data point is expressed as fold‐changes calculated from 2(−ΔΔCt). The Y‐axis is Log10 based from −5.5 to +1. The X‐axis is Log10 based from −5.0 to +0.5. Each gene was the average of experimental group n = 5 and control group n = 3. Among the 84 genes studied, the dotted line represents genes unchanged (less and equal to twofold; black dot). The up‐regulated genes represent genes of fold changes greater than twofold (Red dots). There are 14 up‐regulated genes. The down‐regulated genes represent genes of fold changes less than twofold (green dots). There are two down‐regulated genes.
To verify the results obtained by PCR array, we used real‐time quantitative RT‐PCR to quantify the gene expression levels of those significantly differentiated. The quantitative gene expression analysis demonstrated that Map3k6 levels in the liver were up‐regulated (P = 0.0423) after AB‐FUBINACA treatment (Fig. 7), whereas Hao2 gene was significantly downregulated (P = 0.0323). These genes are generally involved in directing cellular immune response after the stimuli such as AB‐FUBINACA. In the heart, Cfd was significantly downregulated (P = 0.0479) after AB‐FUBINACA treatment; this gene mainly function as pro‐inflammatory response after insult such as AB‐FUBINACA. Thus, the gene expression analyses indicated that AB‐FUBINACA has effects on cellular response in both the liver and heart. The protein analyses of these proteins will be employed in the future.
Figure 7.
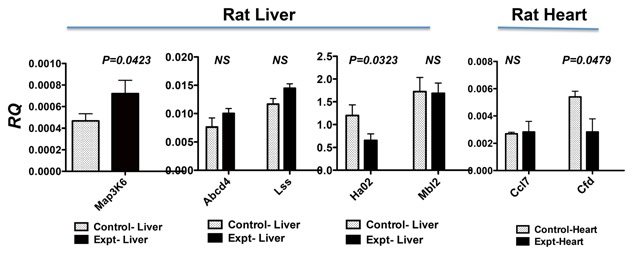
Real‐time quantitative RT‐PCR analysis of genes identified by PCR arrays. Total RNA was treated with DNase I, followed by reverse transcription to generate cDNA. We used SYBR Green I dye to quantify gene expression levels in cDNAs using gene‐specific primers. Each gene was normalized with house keeping gene Hprt1. The results are expressed as relative quantification values (RQ). Animals treated with AB‐FUBINACA (black bar) were compared with PBS‐treated control animals (open bar). The results were analyzed by unpaired t‐test with one‐tail using the software by Prism, version 5.0. The P values less than 0.05 are considered significant; the P values are listed in the figure. The P values higher than 0.05 are not significant as shown in NS. Both results of rat liver and heart are presented in this figure.
DISCUSSION
AB‐FUBINACA has been listed as Schedule I controlled substance by Drug Enforcement Administration in Department of Justice [2014]. Thus, to qualitatively detect AB‐FUBINACA and its metabolites in biological sample has become an important issue for forensic cases. In this study, we administrated daily of AB‐FUBINACA to rat, we identified two major putative hydroxyl metabolites of AB‐FUBINACA by LC‐TOF/MS. We studied the effect of AB‐FUBINACA on gene expressions in rat liver and heart after treatment. This is the first study to demonstrate the sensitive measurement of biological products of AB‐FUBINACA and its derivative in urines. This is also the first study that identified genes associated with the effects of AB‐FUBINACA in the liver and heart.
In general, monitoring the drug metabolites allows widening the detection window for the usage of parent drugs, because of the longer half‐life of metabolites. These metabolites, produced after phase I and II metabolism, usually present more polar and hydrophilic properties to be eliminated in urine. In here, we proposed two putative metabolite structures of AB‐FUBINACA found in the rat urine by LC‐TOF/MS. Metabolite‐2 is postulated preceding the further desalkylation by releasing the 4‐fluorobenzyl groups to yield m/z 277.1311. The two hydroxyl forms increased as native form of AB‐FUBINACA decreased, which suggested the conversion of AB‐FUBINACA to hydroxyl isoforms of AB‐FUBINACA. AB‐FUBINACA, metabolite‐1 and metabolite‐2 were found predominantly in their salt forms. The abundance of the salt form could affect the detecting sensitivity. When performing quantitative analysis using LC/MS for AB‐FUBINACA, it is suggested to take salt adducts into consideration or to avoid sample pretreatment involving sodium. The intendancy of forming sodium adducts for AB‐FUBINACA is postulated associating with sodium chelating by two carbonyl groups on carboxamide moieties.
The further structural elucidation by LC Triple Quad revealed that the hydroxylation takes place on isopropyl moiety for both metabolite‐1 and ‐2, although the specific attached‐carbon is undetermined. Other hydroxyl metabolites with hydroxyl group on indazole or benzyl ring were detected during the product ion scan by LC Triple Quad. However, they are in trace amount without showing analytical importance. Moreover, Takayama et al. [2014] incubated several substrates including AB‐FUBINACA with human liver microsomes, which yielded one mono‐hydroxylated metabolite. Thomsen et al. [2015] did the similar experiment incubated several substrates including AB‐FUBINACA with human liver microsomes. The discovered that using AB‐FUBINACA substrate yield three product ions at m/z 109, 253, and 324; these are mono‐ and di‐ hydroxylation derivatives. In our studies, we identified hydroxylation products at m/z 277 and 385. Thus, the hydroxylation of AB‐FUBINACA is species‐specific. Taken all, the in vitro studies supported our in vivo findings that AB‐FUBINACA was hydrolyzed to yield hydroxylated derivatives, which can be detected by mass spectrometry.
We investigated the effect of AB‐FUBINACA on gene expressions in rat liver and its heart. The increased conversion of AB‐FUBINACA to hydroxyl isoforms of AB‐FUBINACA might occur in the liver through oxidation process. In the gene expression analysis, we identified Map3k6, which was significantly differentially upregulated in the liver of AB‐FUBINACA treated animals as determined by real‐time quantitative RT‐PCR method. MAPK genes respond to stress stimuli such as oxidative stress, which activate enzymes to oxidize AB‐FUBINACA. Studies have been shown that MAPK cascade and downstream transcription factors represent key regulatory components of reactive oxygen species signaling [Skopelitis et al., 2006; Wang et al., 2008; Schmidt et al., 2013].
Rats after AB‐FUBINACA treatment show a twofold decreased of Hao2 gene expressions. Hydroxy acid oxidase in humans has three genes, HAO1, HAO2, and HAO3. In humans and rats, Hao2 express predominantly in the liver and kidney, and Hao2 are functioning in α‐oxidation of long‐chain fatty acids process [Jones et al., 2000]. Thus, the treatment of AB‐FUBINACA has a significant impact on fatty acid metabolism.
Interestingly, Hao2 has been identified as a candidate gene for regulating systolic blood pressure in rats; it shows a potential link to hypertension [Rice et al., 2000; Lee et al., 2003]. A recent study by Merck reported a development of inhibitors to regulate Hao2 gene to reduce blood pressure in salt‐treated rats [Barawkar et al., 2011]. Our study showed a decreased level of Hao2 mRNA after AB‐FUBINACA treatment, suggesting AB‐FUBINACA might be a potential treatment to regulate blood pressure.
The gene expression analysis in the heart after AB‐FUBINACA treatment revealed Cfd was differentially down‐regulated. Cfd [Prentice et al., 2013] is involved in inflammatory response after injury or stimuli in myocardial infarction or stroke. Like Hao2 in the liver, this study suggested AB‐FUBINACA might play a role in regulating heart disease. Further study in this area is warranted.
Supporting information
Additional supporting information may be found in the online version of this article at the publisher's web‐site.
Table S1. Genes in RT2 Profiler PCR arrays: Rat heart.
Table S2. Genes in RT2 Profiler PCR arrays: Rat liver.
ACKNOWLEDGMENTS
The work is funded by the United Stated Agency for International Development (USAID)\Egyptian Ministry of Higher Education to Dr. A. Mozayani. Dr. Mostafa Ahmed received Fellowship from the USAID grant funding.
Author Contributions: Hsin‐Hung Chen performed urine analyses using the LC/MS‐TOF, provided the figures of Figures 1 to 4 and the initial first draft of manuscript writing. Aybike Dip performed the experiments using the rats and assisted in urine analyses. Mostafa Ahmed performed the extraction of RNA, gene expression analyses, provided Figures 5 and 6, and he also did some writing of the manuscript. Michael L. Tan assisted Mostafa Ahmed to do the experiments in gene expression analysis in liver and heart. Jeffrey P. Walterscheid assisted in LC/MS‐TOF data analysis and wrote the first draft of this manuscript. Hua Sun is responsible for the real‐time quantitative RT‐PCR determination, provided the results of Figure 7. Ba‐Bie Teng is responsible to the data analysis of gene expressions on liver and heart. She wrote the final draft of the manuscript. She is the corresponding author. Ashraf Mozayani is responsible for the progress of the whole project. She is the senior author of this manuscript.
Current address of Mostafa Ahmed: Department of Chemistry, Faculty of Science (New Valley), Assiut University, Assiut, Egypt.
Current address of Hsin‐Hung Chen: Forensic Toxicology Drug Testing Laboratory, 2490 Wilson St., Fort Meade, MD 20755.
Conflicts of interest: The authors declare that they have no conflict of interest.
REFERENCES
- Barawkar DA, Meru A, Bandyopadhyay A, Banerjee A, Deshpande AM, Athare C, Koduru C, Khose G, Gundu J, Mahajan K, Patil P, Kandalkar SR, Niranjan S, Bhosale S, De S, Mukhopadhyay S, Chaudhary S, Koul S, Singh U, Chugh A, Palle VP, Mookhtiar KA, Vacca J, Chakravarty PK, Nargund RP, Wright SD, Roy S, Graziano MP, Singh SB, Cully D, Cai TQ. 2011. ‘ Potent and selective inhibitors of long chain l‐2‐Hydroxy acid oxidase reduced blood pressure in DOCA salt‐treated rats’. ACS Med Chem Lett 2 (12):919–923. [DOI] [PMC free article] [PubMed] [Google Scholar]
- Behonick G, Shanks KG, Firchau DJ, Mathur G, Lynch CF, Nashelsky M, Jaskierny DJ, Meroueh C. 2014. Four postmortem case reports with quantitative detection of the synthetic cannabinoid, 5F‐PB‐22. J Anal Toxicol 38(8):559–562. [DOI] [PMC free article] [PubMed] [Google Scholar]
- Buchler I, 2009; Indazole derivatives. http://patentacopewipoint/search/en/detail. docld=WO2009106982; Pfizer Global Research & Development, 700 Chesterfield Parkway West Chesterfield, MO 63017‐1732, USA.
- Drug Enforcement Administration DoJ. 2014. Schedules of controlled substances: Temporary placement of four synthetic cannabinoids into Schedule I. Final order. Fed Regist 79 27;7577–7582. [PubMed] [Google Scholar]
- Dutta R, Singh U, Li TB, Fornage M, Teng BB. 2003. Hepatic gene expression profiling reveals perturbed calcium signaling in a mouse model lacking both LDL receptor and Apobec1 genes. Atherosclerosis 169(1):51–62. [DOI] [PubMed] [Google Scholar]
- Freeman MJ, Rose DZ, Myers MA, Gooch CL, Bozeman AC, Burgin WS. 2013. Ischemic stroke after use of the synthetic marijuana “spice”. Neurology 81(24):2090–2093. [DOI] [PMC free article] [PubMed] [Google Scholar]
- Freijo TD, Jr. , Harris SE, Kala SV. 2014. A rapid quantitative method for the analysis of synthetic cannabinoids by liquid chromatography‐tandem mass spectrometry. J Anal Toxicol 38(8):466–478. [DOI] [PubMed] [Google Scholar]
- Guale F, Shahreza S, Walterscheid JP, Chen HH, Arndt C, Kelly AT, Mozayani A. 2013. Validation of LC‐TOF‐MS screening for drugs, metabolites, and collateral compounds in forensic toxicology specimens. J Anal Toxicol 37(1):17–24. [DOI] [PMC free article] [PubMed] [Google Scholar]
- Huffman JW, Zengin G, Wu MJ, Lu J, Hynd G, Bushell K, Thompson AL, Bushell S, Tartal C, Hurst DP, et al. 2005. Structure‐activity relationships for 1‐alkyl‐3‐(1‐ naphthoyl) indoles at the cannabinoid CB(1) and CB(2) receptors: Steric and electronic effects of naphthoyl substituents. New highly selective CB(2) receptor agonists. Bioorg Med Chem 13(1):89–112. [DOI] [PubMed] [Google Scholar]
- Jones JM, Morrell JC, Gould SJ. 2000. Identification and characterization of HAOX1, HAOX2, and HAOX3, three human peroxisomal 2‐hydroxy acid oxidases. J Biol Chem 275(17):12590–12597. [DOI] [PubMed] [Google Scholar]
- Kronstrand R, Brinkhagen L, Birath‐Karlsson C, Roman M, Josefsson M. 2014. LC‐QTOF‐MS as a superior strategy to immunoassay for the comprehensive analysis of synthetic cannabinoids in urine. Anal Bioanal Chem 406(15):3599–3609. [DOI] [PubMed] [Google Scholar]
- Lee SJ, Liu J, Qi N, Guarnera RA, Lee SY, Cicila GT. 2003. Use of a panel of congenic strains to evaluate differentially expressed genes as candidate genes for blood pressure quantitative trait loci. Hypertens Res 26(1):75–87. [DOI] [PubMed] [Google Scholar]
- Mak S, Sun H, Acevedo F, Shimmin LC, Zhao L, Teng BB, Hixson JE. 2010. Differential expression of genes in the calcium‐signaling pathway underlies lesion development in the LDb mouse model of atherosclerosis. Atherosclerosis 213(1):40–51. [DOI] [PMC free article] [PubMed] [Google Scholar]
- Palmer SL, Thakur GA, Makriyannis A. 2002. Cannabinergic ligands. Chem Phys Lipids 121(1–2):3–19. [DOI] [PubMed] [Google Scholar]
- Prentice RL, Zhao S, Johnson M, Aragaki A, Hsia J, Jackson RD, Rossouw JE, Manson JE, Hanash SM. 2013. Proteomic risk markers for coronary heart disease and stroke: Validation and mediation of randomized trial hormone therapy effects on these diseases. Genome Med 5(12):112. [DOI] [PMC free article] [PubMed] [Google Scholar]
- Rice T, Rankinen T, Province MA, Chagnon YC, Perusse L, Borecki IB, Bouchard C, Rao DC. 2000. Genome‐wide linkage analysis of systolic and diastolic blood pressure: The Quebec Family Study. Circulation 102(16):1956–1963. [DOI] [PubMed] [Google Scholar]
- Schmidt R, Mieulet D, Hubberten HM, Obata T, Hoefgen R, Fernie AR, Fisahn J, San Segundo, Schippers E, et al. 2013. Salt‐responsive ERF1 regulates reactive oxygen species‐dependent signaling during the initial response to salt stress in rice. Plant Cell 25(6):2115–2131. [DOI] [PMC free article] [PubMed] [Google Scholar]
- Skopelitis DS, Paranychianakis NV, Paschalidis KA, Pliakonis ED, Delis ID, Yakoumakis DI, Kouvarakis A, Papadakis AK, Stephanou EG, Roubelakis‐Angelakis KA. 2006. Abiotic stress generates ROS that signal expression of anionic glutamate dehydrogenases to form glutamate for proline synthesis in tobacco and grapevine. Plant Cell 18(10):2767–2781. [DOI] [PMC free article] [PubMed] [Google Scholar]
- Takayama T, Suzuki M, Todoroki K, Inoue K, Min JZ, Kikura‐Hanajiri R, Goda Y, Toyo'oka T. 2014. UPLC/ESI‐MS/MS‐based determination of metabolism of several new illicit drugs, ADB‐FUBINACA, AB‐FUBINACA, AB‐PINACA, QUPIC, 5F‐QUPIC and alpha‐ PVT, by human liver microsome. Biomed Chromatogr 28(6):831–838. [DOI] [PubMed] [Google Scholar]
- Thomsen R, Nielsen LM, Holm NB, Rasmussen HB, Linnet K, Consortium I. 2015. Synthetic cannabimimetic agents metabolized by carboxylesterases. Drug Test Anal 7(7):565–76. [DOI] [PubMed] [Google Scholar]
- Wang X, Chen X, Chen L, Wang B, Peng C, He C, Tang M, Zhang F, Hu J, Li R, et al. 2008. Optimizing high‐performance liquid chromatography method for quantification of glucosamine using 6‐aminoquinolyl‐N‐hydroxysuccinimidyl carbamate derivatization in rat plasma: Application to a pharmacokinetic study. Biomed Chromatogr 22(11):1265–1271. [DOI] [PubMed] [Google Scholar]
- Zimmermann US, Winkelmann PR, Pilhatsch M, Nees JA, Spanagel R, Schulz K. 2009. Withdrawal phenomena and dependence syndrome after the consumption of “spice gold”. Dtsch Arztebl Int 106(27):464–467. [DOI] [PMC free article] [PubMed] [Google Scholar]
Associated Data
This section collects any data citations, data availability statements, or supplementary materials included in this article.
Supplementary Materials
Additional supporting information may be found in the online version of this article at the publisher's web‐site.
Table S1. Genes in RT2 Profiler PCR arrays: Rat heart.
Table S2. Genes in RT2 Profiler PCR arrays: Rat liver.


