

Abstract
We compared changes in blood glucose (BG) and risk of hypoglycaemia during and after exercise in 40 patients with type 1 diabetes (T1D) treated with insulin degludec (IDeg) or insulin glargine (IGlar) in a randomized, open‐label, two‐period, crossover trial. After individual titration and a steady‐state period, patients performed 30 min of moderate‐intensity cycle ergometer exercise (65% peak rate of oxygen uptake). BG, counter‐regulatory hormones and hypoglycaemic episodes were measured frequently during and for 24 h after exercise. BG changes during exercise were similar with IDeg and IGlar [estimated treatment difference (ETD) for maximum BG decrease: 0.14 mmol/l; 95% confidence interval (CI) −0.15, 0.42; p = 0.34], as was mean BG (ETD −0.16 mmol/l; 95% CI −0.36, 0.05; p = 0.13). No hypoglycaemic episodes occurred during exercise. Post‐exercise mean BG, counter‐regulatory hormone response and number of hypoglycaemic episodes in 24 h after starting exercise were similar with IDeg (18 events in 13 patients) and IGlar (23 events in 15 patients). This clinical trial showed that, in patients with T1D treated with a basal‐bolus regimen, the risk of hypoglycaemia induced by moderate‐intensity exercise was low with IDeg and similar to that with IGlar.
Keywords: exercise, glycaemic control, insulin therapy, type 1 diabetes
Introduction
Physical exercise is beneficial for patients with type 1 diabetes (T1D), although associated with an increased risk of hypoglycaemia 1, 2. Individuals with T1D lack the physiological adjustments of healthy individuals to maintain euglycaemia during physical activity 3, 4, and may avoid exercise 5. Published research and practical guidelines recommend individual adjustments to insulin dose and carbohydrate intake 6, 7, 8; however, variation in pharmacodynamic profiles and duration of action between different basal insulins may alter their contribution to hypoglycaemia risk. The aim of the present study was to compare changes in blood glucose (BG) concentration and hypoglycaemia risk during and after exercise in patients with T1D treated with insulin degludec (IDeg) or insulin glargine (IGlar).
Methods
This single‐centre, randomized, open‐label, two‐period, multiple‐dose, crossover trial complied with the Declaration of Helsinki 9 and Good Clinical Practice Guidelines 10, and was approved by the local health authority and ethics committee.
Healthy adults (aged 18–45 years, inclusive) with T1D eligible for the study had a body mass index (BMI) 18–27 kg/m2, glycated haemoglobin (HbA1c) level ≤9.5% (80 mmol/mol) and peak rate of oxygen uptake (VO2peak) >35 and <60 ml O2/kg/min, and were performing regular physical cardiorespiratory activity (≥500 metabolic equivalent of task min per week 11) during the last 3 months before screening. Exclusion criteria included cancer, cardiac diseases, supine blood pressure outside the range 90–140 mmHg for systolic blood pressure or 50–90 mmHg for diastolic blood pressure, recurrent severe hypoglycaemia or hypoglycaemic unawareness, smoking and confirmed hyperglycaemia [BG ≥17 mmol/l (∼306 mg/dl)] during the run‐in/steady‐state periods. Written informed consent was obtained from all patients. The trial was registered at ClinicalTrials.gov (NCT01704417).
Patients were randomized to one of two treatment sequences: IDeg (Tresiba®, 100 units/ml in 3‐ml prefilled investigational pens, PDS290; Novo Nordisk, Bagsværd, Denmark) followed by IGlar (Lantus®, 100 units/ml in 3‐ml SoloStar®; Sanofi, Paris, France) or IGlar followed by IDeg. The two treatments were separated by a 7‐ to 21‐day washout). Insulin aspart (IAsp) (NovoRapid®, 100 units/ml in 3‐ml FlexPen®; Novo Nordisk, Bagsværd, Denmark) was used as bolus insulin.
Treatment periods included a 14‐ to 28‐day titration run‐in on each basal insulin, to reach stable glycaemic control and a prebreakfast self‐measured plasma glucose (SMPG) value of 4–6 mmol/l (∼72–108 mg/dl). A 6‐day steady‐state period followed, during which individual doses were kept constant, standard meals were served and usual physical activity maintained to obtain a reproducible BG profile from day to day, ensuring BG was controlled before exercise [pre‐exercise BG ≥5 mmol/l (∼90 mg/dl) and ≤10 mmol/l (∼180 mg/dl); maximum difference of 2 mmol/l (∼36 mg/dl) between the two exercise bouts].
On day 5 of the steady‐state period, patients' individual lunchtime IAsp doses (12:00 hours) and carbohydrate were reduced by ∼60% (median 40 g carbohydrate, both treatments) to achieve consistent pre‐exercise BG levels, avoiding high BG levels >10 mmol/l (∼180 mg/dl). Three hours after lunch (15:00 hours) patients performed a 30‐min ergometer bicycle exercise bout at 65% VO2peak. Gas exchange and heart rate were measured and %VO2peak and carbohydrate oxidation rates during exercise were calculated 12. Blood was drawn via venous cannula every 5 min during exercise and at various time points for 22.5 h for laboratory measurement of BG, counter‐regulatory hormones and β‐hydroxybutyrate. Hypoglycaemic episodes [plasma glucose <3.1 mmol/l (∼56 mg/dl) or episodes requiring assistance of another person (nocturnal between 00:01 and 05:59 hours, inclusive)] were recorded for 24 h after start of exercise. Individualized corrective carbohydrate doses, adjusted at 10‐min intervals, were given as necessary.
A clinically relevant treatment difference between pre‐exercise BG concentration and minimum BG concentration during exercise of 0.65 mmol/l (∼11.7 mg/dl) could be detected (80% power) with a sample of 36 patients (assuming standard deviation of 1.35). BG concentration endpoints were analysed in a linear mixed model (BG concentration before exercise as covariate, treatment and period as fixed factors, and patient as a random effect). To account for unequal variances, the within‐patient variation depended on treatment. Rate of hypoglycaemia was analysed in a negative binomial regression model with a log‐link function (treatment and period as fixed factors and patient as a random effect). All other endpoints are summarized descriptively.
Results
Of 72 patients screened, 41 were eligible and 40 randomized (one withdrew). Thirty‐nine patients completed the trial, as one was excluded during the first run‐in (BG ≥17 mmol/l: IGlar group). The 35 men and 5 women enrolled had a mean ± standard deviation (s.d.) age of 33.9 ± 7.7 years, BMI of 23.9 ± 1.9 kg/m2, VO2peak of 39.4 ± 3.7 ml O2/kg/min, HbA1c of 7.7 ± 0.8% (61 ± 9 mmol/mol) and diabetes duration of 16.7 ± 8.2 years.
The prerequisite that certain parameters were similar between the two treatments was fulfilled: basal and bolus insulin doses (Table S1), glycaemic control during steady‐state period (Figure S1), BG concentration immediately before exercise (Figure 1A), mean relative intensity during the exercise [VO2peak IDeg: 64.6 ± 4.1; IGlar: 65.5 ± 3.8%; (Table S2)] and pre‐ and post‐exercise heart rate [∼64 and ∼158 bpm, respectively, with IDeg and IGlar (Figure S2)].
Figure 1.
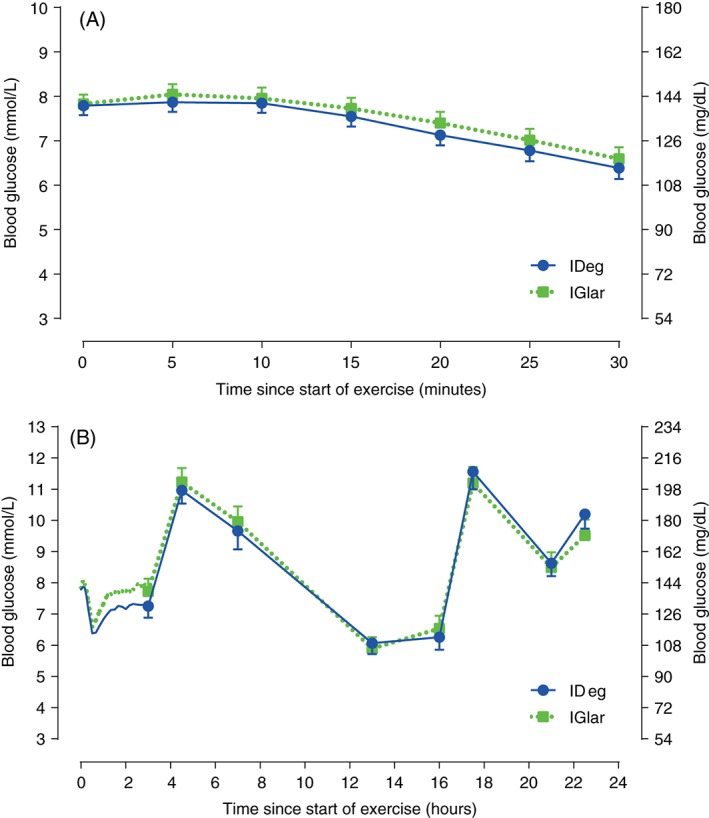
Blood glucose concentration (A) during 30 min exercise and (B) for up to 22.5 h after start of exercise. Blood samples were taken frequently (every 5 min during exercise and every 10 min for 2.5 h after exercise) from time 0 to 3 h, while blood sampling time points in the remaining post‐exercise period are marked by symbols and vertical bars. IDeg, insulin degludec; IGlar, insulin glargine; vertical bars are standard error of the mean.
During exercise, endpoints were similar with IDeg and IGlar, including decrease in BG concentration (Figure 1A), estimated maximum BG decrease [estimated treatment difference (ETD): 0.14 mmol/l; 95% confidence interval (CI) −0.15, 0.42 (∼2.5 mg/dl; 95% CI −2.7, 7.57); p = 0.34], estimated mean BG concentration [IDeg: 7.28 mmol/l (∼131 mg/dl); IGlar: 7.43 mmol/l (∼134 mg/dl); ETD: −0.16 mmol/l; 95% CI −0.36, 0.05 (∼ −2.9 mg/dl; 95% CI −6.5, 0.9); p = 0.13], respiratory equivalent ratio (>1 for both groups) and carbohydrate oxidation [IDeg 2.9 ± 0.6 and IGlar 2.8 ± 0.6 g/min (Table S2)]. There were no hypoglycaemic episodes nor requirement for carbohydrate administration during exercise.
The BG concentration for 22.5 h after start of exercise is shown in Figure 1B. Estimated mean BG concentration [IDeg: 7.12 mmol/l (∼128 mg/dl); IGlar: 7.61 mmol/l (∼137 mg/dl); ETD: −0.50 mmol/l; 95% CI −1.14, 0.15 (∼ −9 mg/dl; 95% CI −20.5, 2.7); p = 0.13] and estimated minimum BG concentration [IDeg: 6.05 mmol/l (∼109 mg/dl); IGlar: 6.39 mmol/l (∼115 mg/dl); ETD: −0.34 mmol/l; 95% CI −0.88, 0.20 (∼6.1 mg/dl; 95% CI −15.9, 3.6); p = 0.21] for the 2.5 h immediately after exercise were similar between groups. Concentration of counter‐regulatory hormones and β‐hydroxybutyrate showed similar exercise‐related changes for IDeg and IGlar (Figure S3). The number of hypoglycaemic episodes [estimated rate ratio (ERR) 0.76 (95% CI 0.40, 1.45); p = 0.39], nocturnal hypoglycaemic episodes [ERR 1.00 (95% CI 0.40, 2.47); p = 1.00 (Table 1)] and carbohydrate administrations (IDeg: 32 in 14 patients; IGlar: 33 in 12 patients) for 24 h after start of exercise were similar with IDeg and IGlar. The total mean ± s.d. bolus insulin dose for 24 h after start of exercise was similar (IDeg 0.29 ± 0.13 and IGlar 0.33 ± 0.15 units/kg).
Table 1.
Hypoglycaemic episodes [plasma glucose ≤3.1 mmol/l (∼56 mg/dl) or requiring assistance] with insulin degludec (IDeg) and insulin glargine (IGlar) during the 24 h after start of exercise.
| Hypoglycaemic episodes | IDeg | IGlar | ||
|---|---|---|---|---|
| Episodes | Patients (%) | Episodes | Patients (%) | |
| Hypoglycaemic episodes | 18 | 13 (33.3) | 23 | 15 (37.5) |
| Nocturnal hypoglycaemic episodes | 10 | 10 (25.6) | 10 | 9 (22.5) |
IDeg, insulin degludec; IGlar, insulin glargine.
IDeg, n = 39; IGlar, n = 40.
One serious adverse event (hypoglycaemic seizure) occurred 5 days after the IGlar period as a result of a medication error (IGlar/lispro mix‐up). No other relevant safety issues were raised.
Discussion
The results of the present study show that, despite different pharmacodynamic profiles and duration of action, BG concentrations during and after exercise were similar with IDeg and IGlar. No hypoglycaemic episodes occurred during exercise. The number of hypoglycaemic episodes for 24 h after start of exercise was low and similar between IDeg and IGlar, concurring with a recent meta‐analysis of self‐reported exercise‐related hypoglycaemia with these insulins 13.
In the present study, moderate‐intensity cycling increased tissue fuel requirements above those required when at rest and represented a useful model for exploring the impact of basal insulin choice concomitant with the synergistic effect of muscular contraction on carbohydrate metabolism. We observed a similarly high rate of carbohydrate oxidation (IDeg 2.9 g/min and IGlar 2.8 g/min) in exercising patients (Table S2). Furthermore, sub‐maximum cycling caused a significant counter‐regulatory hormone response (Figure S3), which helped to minimize BG changes from rest during the exercise period. The equivalent counter‐regulatory hormone response enabled the impact of different basal insulins to be explored. We found no differences in BG responses despite markedly different pharmacodynamic profiles of IDeg and IGlar (Figure 1).
The main strength of the present study was the controlled setting to achieve similar and reasonable pre‐exercise BG concentrations that were kept within recommended limits 14 with both treatments. Morning dosing ensured the highest possible insulin concentration in the circulation at the time of exercise, particularly for IGlar, with its half‐life being half that of IDeg 15.
The tightly controlled setting limits the applicability of the study to a real‐life situation where patients may not adjust carbohydrate intake before exercise. This, in conjunction with a reduced bolus dose, can lead to high pre‐exercise BG 1. In addition, the experimental design did not include any reduction in post‐exercise bolus dose as this would have complicated data interpretation, although this has been shown to preserve euglycaemia and prevent hypoglycaemia 8. Finally, in the present study, we investigated only one form of exercise and further studies might usefully investigate others such as high‐intensity exercise or resistance training.
In summary, this study showed that the risk of hypoglycaemia in patients with T1D induced by moderate intensity exercise was low with IDeg and similar compared with IGlar.
Conflict of Interest
The study was sponsored by Novo Nordisk A/S. None of the authors received any financial or monetary transfer of value for their participation in the writing of the manuscript. T. H. reports having received research funds from Adocia, Astra Zeneca, BD, Biocon, Boehringer Ingelheim, Dance Pharmaceuticals, Grünenthal, Eli Lily and Company, Medtronic, Novo Nordisk, Novartis, Sanofi and Senseonics and having received speaker honoraria and travel grants from Eli Lily and Company, Mylan and Novo Nordisk. S. C. B. reports having received honoraria, teaching and research grants from the Abbott, Astra Zeneca, Boehringer Ingelheim, BMS, Diartis, Eli Lily and Company, GlaxoSmithKline, Johnson & Johnson, Merck Sharp & Dohme, Novartis, Novo Nordisk, Pfizer, Roche, Sanofi‐Aventis, Schering‐Plough, Servier and Takeda. R. B. reports having received honoraria, travel and educational grant support from, Boehringer‐Ingelheim, Eli Lily and Company, Novo Nordisk, Sanofi‐Aventis. E. Z. and L. N. have no disclosures to report. K. S.‐P., R. R., E. R. and H. L. H. are employees and shareholders in Novo Nordisk A/S.
T. H. is the guarantor of this work and, as such, had full access to all the data in the study and takes responsibility for the integrity of the data and the accuracy of the data analysis. T. H., E. Z. and L. N. conducted the study. E. R. carried out the statistical analyses. All authors were involved in the study design, contributed to the discussion of the results and reviewed and approved the manuscript.
The results of this study were presented in abstract form at the World Diabetes Congress, Melbourne, Australia, 2–6 December 2013.
Supporting information
Figure S1. Mean five‐point self‐measured plasma glucose profiles with insulin degludec and insulin glargine during the steady‐state period (the days leading up to the exercise bout).
Figure S2. Mean heart rate pre‐exercise and over 2‐min intervals during 30‐min exercise.
Figure S3. Mean concentration of glucagon (A), cortisol (B), epinephrine (C), norepinephrine (D), growth hormone (E) and β‐hydroxybutyrate (F) before and after the 30‐min exercise bout.
Table S1. Daily basal doses of insulin degludec and insulin glargine and daily bolus insulin doses (insulin aspart) during the steady‐state period.
Table S2. Exercise workload, respiratory exchange ratio and carbohydrate oxidation during 30‐min exercise with insulin degludec and insulin glargine.
Acknowledgements
We thank trial staff and participants for their participation. The authors thank Malene Wibe Poulsen (Novo Nordisk) for medical writing assistance and Mark Nelson (Watermeadow Medical) for submission assistance.
References
- 1. West DJ, Morton RD, Bain SC, Stephens JW, Bracken RM. Blood glucose responses to reductions in pre‐exercise rapid‐acting insulin for 24 h after running in individuals with type 1 diabetes. J Sports Sci 2010; 28: 781–788. [DOI] [PubMed] [Google Scholar]
- 2. Metcalf KM, Singhvi A, Tsalikian E et al. Effects of moderate‐to‐vigorous intensity physical activity on overnight and next‐day hypoglycemia in active adolescents with type 1 diabetes. Diabetes Care 2014; 37: 1272–1278. [DOI] [PMC free article] [PubMed] [Google Scholar]
- 3. Riddell MC, Perkins BA. Type 1 diabetes and vigorous exercise: applications of exercise physiology to patient management. Can J Diabetes 2006; 30: 63–71. [Google Scholar]
- 4. DeFronzo RA, Ferrannini E, Sato Y, Felig P, Wahren J. Synergistic interaction between exercise and insulin on peripheral glucose uptake. J Clin Invest 1981; 68: 1468–1474. [DOI] [PMC free article] [PubMed] [Google Scholar]
- 5. Brazeau AS, Rabasa‐Lhoret R, Strychar I, Mircescu H. Barriers to physical activity among patients with type 1 diabetes. Diabetes Care 2008; 31: 2108–2109. [DOI] [PMC free article] [PubMed] [Google Scholar]
- 6. Perry E, Gallen IW. Guidelines on the current best practice for the management of type 1 diabetes, sport and exercise. Pract Diab Int 2009; 26: 116–123. [Google Scholar]
- 7. West DJ, Stephens JW, Bain SC et al. A combined insulin reduction and carbohydrate feeding strategy 30‐ámin before running best preserves blood glucose concentration after exercise through improved fuel oxidation in type 1 diabetes mellitus. J Sports Sci 2010; 29: 279–289. [DOI] [PubMed] [Google Scholar]
- 8. Campbell MD, Walker M, Trenell MI et al. Large pre‐ and postexercise rapid‐acting insulin reductions preserve glycemia and prevent early‐ but not late‐onset hypoglycemia in patients with type 1 diabetes. Diabetes Care 2013; 36: 2217–2224. [DOI] [PMC free article] [PubMed] [Google Scholar]
- 9. World Medical Association . World Medical Association Declaration of Helsinki: Ethical principles for medical research involving human subjects. Last amended by the 59th WMA General Assembly, Seoul, 2008. [Google Scholar]
- 10. International Conference on Harmonisation (ICH) Harmonised tripartite guideline: guideline for good clinical practice E6 (R1), Step 4. 10 June 1996.
- 11. The IPAQ Group . Guidelines for Data Processing and Analysis of the International Physical Activity Questionnaire (IPAQ) – Short and Long Forms. 2005. Available from URL: https://docs.google.com/viewer?a=v&pid=sites&srcid=ZGVmYXVsdGRvbWFpbnx0aGVpcGFxfGd4OjE0NDgxMDk3NDU1YWRlZTM. Accesssed 30 October 2015.
- 12. Frayn KN. Calculation of substrate oxidation rates in vivo from gaseous exchange. J Appl Physiol 1983; 55: 628–634. [DOI] [PubMed] [Google Scholar]
- 13. Heller SR, Gough SCL, Oyer DS, Jensen KH, Kinduryte O, Philis‐Tsimikas A. Exercise‐related hypoglycemia occurs at similar frequency with insulin degludec and insulin glargine (Abstract). Diabetes 2013; 62(Suppl. 1): A187. [Google Scholar]
- 14. American Diabetes Association . Medical Management of Type 1 Diabetes. Alexandria, VA: American Diabetes Association, 2008. [Google Scholar]
- 15. Heise T, Hövelmann U, Nosek L, Hermanski L, Bøttcher SG, Haahr H. Comparison of the pharmacokinetic and pharmacodynamic profiles of insulin degludec and insulin glargine. Expert Opin Drug Metab Toxicol 2015; 11: 1193–1201. [DOI] [PubMed] [Google Scholar]
Associated Data
This section collects any data citations, data availability statements, or supplementary materials included in this article.
Supplementary Materials
Figure S1. Mean five‐point self‐measured plasma glucose profiles with insulin degludec and insulin glargine during the steady‐state period (the days leading up to the exercise bout).
Figure S2. Mean heart rate pre‐exercise and over 2‐min intervals during 30‐min exercise.
Figure S3. Mean concentration of glucagon (A), cortisol (B), epinephrine (C), norepinephrine (D), growth hormone (E) and β‐hydroxybutyrate (F) before and after the 30‐min exercise bout.
Table S1. Daily basal doses of insulin degludec and insulin glargine and daily bolus insulin doses (insulin aspart) during the steady‐state period.
Table S2. Exercise workload, respiratory exchange ratio and carbohydrate oxidation during 30‐min exercise with insulin degludec and insulin glargine.