

Abstract
Aim
To evaluate, using post hoc analyses, whether the novel combination of a basal insulin, insulin degludec, and a glucagon‐like peptide‐1 receptor agonist, liraglutide (IDegLira), was consistently effective in patients with type 2 diabetes (T2D), regardless of the stage of T2D progression.
Methods
Using data from the DUAL I extension [insulin‐naïve patients uncontrolled on oral antidiabetic drugs (OADs), n = 1660, 52 weeks] and DUAL II (patients uncontrolled on basal insulin plus OADs, n = 398, 26 weeks) randomized trials, the efficacy of IDegLira was investigated with regard to measures of disease progression stage including baseline glycated haemoglobin (HbA1c), disease duration and previous insulin dose.
Results
Across four categories of baseline HbA1c (≤7.5–9.0%), HbA1c reductions were significantly greater with IDegLira (1.1–2.5%) compared with IDeg or liraglutide alone in DUAL I. In DUAL II, HbA1c reductions were significantly greater with IDegLira (0.9–2.5%) than with IDeg in all but the lowest HbA1c category. In DUAL I, insulin dose and hypoglycaemia rate were lower across all baseline HbA1c categories for IDegLira versus IDeg, while hypoglycaemia was higher with IDegLira than liraglutide, irrespective of baseline HbA1c. In DUAL II, insulin dose and hypoglycaemia rate were similar with IDegLira and IDeg (maximum dose limited to 50 U) independent of baseline HbA1c. The reduction in HbA1c with IDegLira was independent of disease duration and previous insulin dose but varied depending on pre‐trial OAD treatment.
Conclusions
IDegLira effectively lowered HbA1c across a range of measures, implying suitability for patients with either early or advanced T2D.
Keywords: basal insulin, GLP‐1 analogue, glycaemic control, type 2 diabetes
Introduction
Despite the advances in treatment for type 2 diabetes (T2D), many patients remain in poor glycaemic control for many years 1, 2, 3. This may be attributable to the complex pathophysiology of T2D or a combination of factors, including clinical inertia, an actual or perceived fear of weight gain and hypoglycaemia, or a lack of adherence to treatment 2, 4, 5, 6.
IDegLira (Xultophy®) is the first fixed‐ratio combination of a basal insulin, insulin degludec (IDeg), and a glucagon‐like peptide‐1 receptor analogue, liraglutide. IDegLira is administered as a once‐daily injection independently of meals or time of day in people with T2D and is titrated in dose steps, with each dose step containing 1 U of IDeg and 0.036 mg of liraglutide. For patients starting IDegLira as add‐on therapy to oral antidiabetic drugs (OADs), the recommended starting dose is 10 dose steps (10 U IDeg and 0.36 mg liraglutide) once daily, while for patients switching to IDegLira from basal insulin, the recommended starting dose is 16 dose steps (16 U IDeg and 0.6 mg liraglutide) once daily; the maximum dose is 50 dose steps (50 U IDeg/1.8 mg liraglutide) once daily 7.
The efficacy and safety of the two components of IDegLira, IDeg and liraglutide, have been extensively investigated in clinical development programmes (reviewed in Bode 8, Keating 9 and Vora et al. 10). The IDegLira phase IIIa programme comprised the 52‐week DUAL I (26‐week main trial and 26‐week extension trial) and the 26‐week DUAL II trials 11, 12, 13.
The objective of the present post hoc analyses was to determine the robustness of the efficacy results with IDegLira and its component parts in the DUAL I and DUAL II trials as a function of three variables, which could be considered surrogates of baseline disease severity: glycated haemoglobin (HbA1c) level at baseline, diabetes duration and diabetes treatment at screening.
Materials and Methods
The detailed trial designs and methods have been reported previously 11, 12, 13. DUAL I was a 26‐week trial 12, with an extension to 52 weeks 13, comparing IDegLira with IDeg or liraglutide in insulin‐naïve patients uncontrolled on OADs (metformin with or without pioglitazone). Throughout the present report, when referring to DUAL I, results from the full 52‐week trial are reported. In DUAL II, IDegLira was compared with IDeg for a treatment period of 26 weeks in patients who were previously uncontrolled on 20–40 U of basal insulin plus metformin with or without sulphonylureas or glinides; these latter two classes were discontinued at randomization 11. In DUAL II, IDeg was limited to a maximum dose of 50 U so that the contribution of the liraglutide component of IDegLira could be evaluated at equivalent insulin doses. The trial protocols were approved by independent ethics committees or institutional review boards at all participating institutions and conducted in accordance with the Declaration of Helsinki and Good Clinical Practice guidelines 14, 15. Written informed consent from all patients was obtained before enrolment. The trials were registered at clinicaltrials.gov: NCT01336023 and NCT01392573.
The baseline characteristics of the patients with T2D in the two trials are summarized in Table S1.
Statistical Analysis
In the present post hoc analyses, changes in HbA1c, end‐of‐trial insulin dose and confirmed hypoglycaemia rate were assessed for each study across baseline HbA1c categories: ≤7.5% (≤58 mmol/mol); >7.5 to ≤8.5% (>58 to ≤69 mmol/mol); >8.5 to ≤9.0% (>69 to ≤75 mmol/mol); and >9.0% (>77 mmol/mol). Change in HbA1c was also analysed across four body mass index (BMI) categories: <25 kg/m2 (DUAL I only), ≥25 to <30, ≥30 to <35 and ≥35 kg/m2, and across concomitant medication (metformin vs metformin plus other OADs). Change in HbA1c and end‐of‐trial insulin dose were assessed using analysis of covariance, with treatment, region, previous antidiabetic treatment and stratification factors (DUAL I only) as fixed factors and baseline HbA1c as covariate. Confirmed hypoglycaemia was defined as the occurrence of episodes requiring assistance (severe), or episodes in which plasma glucose concentration (determined from self‐monitored plasma glucose) was below 3.1 mmol/l, irrespective of symptoms. For DUAL I, the number of confirmed hypoglycaemic episodes was analysed using a negative binomial regression model with a log link and the logarithm of the exposure time as offset. The model included treatment, region, sub‐study, HbA1c stratification factors and previous antidiabetic treatment at screening as fixed factors. The same model was used to analyse hypoglycaemia in DUAL II, but was not applied to the different baseline HbA1c categories, as the difference for the whole trial was non‐significant.
For each treatment group, change in HbA1c was tested for dependence on disease duration, using a regression model with disease duration as a covariate, to estimate whether the coefficient was significantly different from zero. The variables specified above were also included in the model. Changes in HbA1c with IDegLira and the comparators were also assessed by pre‐trial therapy. In DUAL I, IDegLira was stratified into metformin versus metformin plus pioglitazone. In DUAL II, data were analysed according to metformin or metformin and sulphonylurea/glinide pretreatment, and according to pre‐trial insulin dose (≤30 or >30 U). For change in HbA1c and insulin dose, missing data were imputed using last observation carried forward.
The HbA1c values are presented in % and in mmol/mol. Values in mmol/mol were calculated from the value expressed in % using the International Federation of Clinical Chemistry and Laboratory Medicine equation: HbA1c (mmol/mol) = (HbA1c [%] − 2.15) × 10.929 16.
Results
Change in Glycated Haemoglobin Across Different Baseline Categories
In both trials, IDegLira effectively lowered HbA1c across all baseline categories of HbA1c (Figure 1A, B). In DUAL I, HbA1c reductions with IDegLira were significantly greater versus reductions with IDeg or with liraglutide in all baseline HbA1c categories (Figure 1A), with observed mean reductions from baseline of 1.1–2.5% (12–27 mmol/mol). In DUAL II, HbA1c observed mean reductions were 0.9–2.5% (10–27 mmol/mol) across baseline HbA1c categories with IDegLira, which were significantly greater versus the reductions with IDeg in all baseline HbA1c categories except for ≤7.5% (≤58 mmol/mol), in which patient numbers were low (Figure 1B). The largest reductions in HbA1c occurred in the highest baseline HbA1c category: 2.5% (27 mmol/mol) with IDegLira in both trials (Figure 1).
Figure 1.
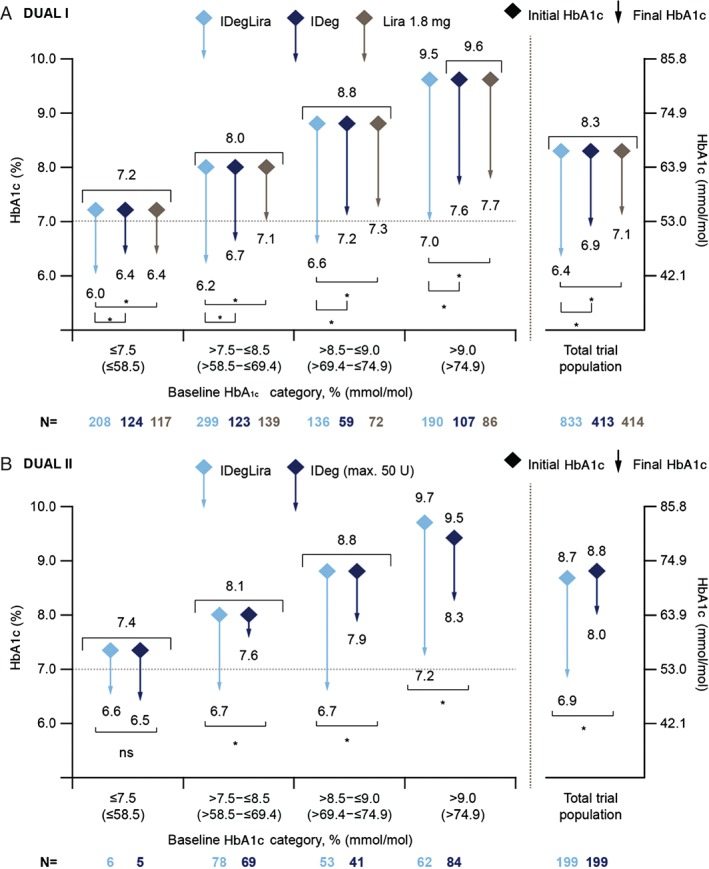
Change in glycated haemoglobin (HbA1c; y‐axis) in relation to categories of baseline HbA1c (x‐axis) in DUAL I (A) and DUAL II (B). Mean HbA1c for each treatment at baseline (diamonds) and at end‐of‐trial (end of arrow) with extent of the reduction in HbA1c depicted by the length of the arrow. Vertical axes show HbA1c (left axis expressed in %, right axis expressed in mmol/mol). Data are mean from observed values based on full analysis set with last observation carried forward; p‐values from analysis of covariance analysis. *p < 0.01. IDeg, insulin degludec; IDegLira, insulin degludec/liraglutide combination; Lira, liraglutide; ns, not significant.
In both trials, the reductions in HbA1c occurred with IDegLira regardless of diabetes duration (Figure 2). In DUAL I, the regression coefficients [± standard error (s.e.)] showed that for one additional year with diabetes, the mean HbA1c was reduced by −0.0037% (± 0.0067) for IDegLira, 0.0037% (± 0.0091) for IDeg and −0.0126% (± 0.0094) for liraglutide (all non‐significant; Figure 2A). In DUAL II, the regression coefficients showed that for an additional 26 weeks with diabetes, the mean HbA1c was reduced by 0.0018% (± 0.0117; non‐significant) for IDegLira and −0.0227% (± 0.0114; p = 0.0487) for IDeg (max 50 U; Figure 2B).
Figure 2.
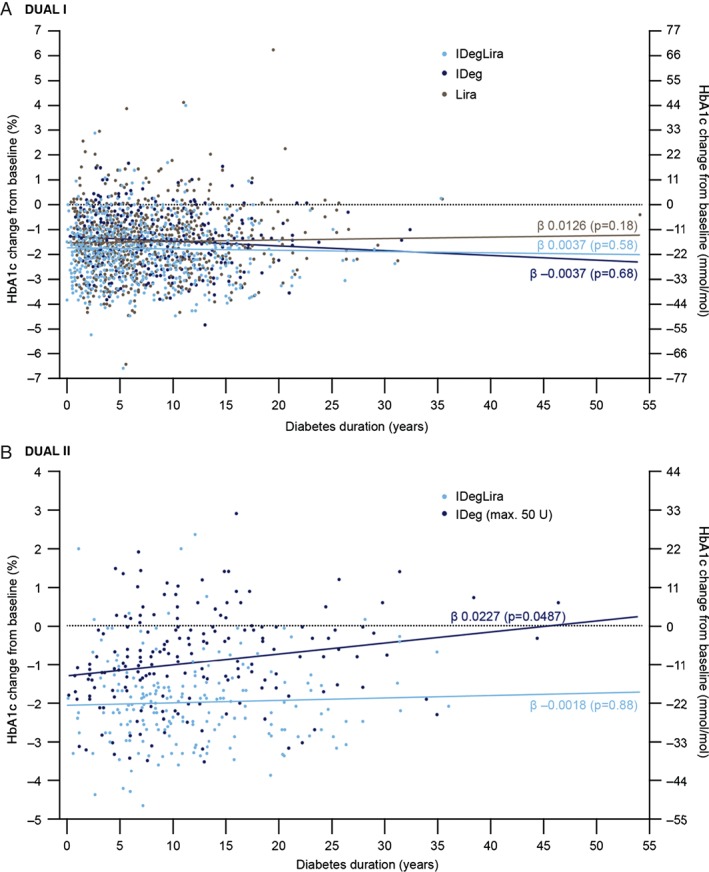
Change in glycated haemoglobin (HbA1c; y‐axis) in relation to duration of diabetes (x‐axis) in DUAL I (A) and DUAL II (B). The fit line for each treatment is least squares mean. The regression analysis estimates the linear relationship between disease duration and change in HbA1c from baseline. The regression coefficient (β) is the slope of the line given by the relationship, and the reported p value corresponds to the test of whether the slope of the line is equal to 0, indicating no relationship between the two variables. IDeg, insulin degludec; IDegLira; insulin degludec/liraglutide combination; Lira, liraglutide. DUAL I regression coefficients (β) ± standard error of the mean (s.e.m.): IDegLira 0.0037 ± 0.0067 (p = 0.58), IDeg −0.0037 ± 0.0091 (p = 0.68), liraglutide 0.0126 ± 0.0094 (p = 0.18). DUAL II regression coefficients (β) ± s.e.m.: IDegLira −0.0018 ± 0.0117 (p = 0.88), IDeg 0.0227 ± 0.0114 (p = 0.0487).
In DUAL I, the analysis of HbA1c reduction according to concomitant medication showed that, in the IDegLira arm, the reduction in HbA1c was slightly greater in patients treated with (and continuing) metformin plus pioglitazone [2.1% (23 mmol/mol)] compared with those using metformin alone [1.8% (19 mmol/mol); estimated treatment difference (ETD) 0.21% (2.3 mmol/mol); p = 0.02; Table 1A]; this difference between pre‐trial treatments was not seen in the IDeg or liraglutide arms. The HbA1c reductions were significantly greater with IDegLira compared with IDeg and liraglutide in patients in the metformin group and those in the metformin plus pioglitazone group (p < 0.001 in all comparisons; Table 1A).
Table 1.
Changes in glycated haemoglobin (HbA1c) by antidiabetic treatment (A, B) or by basal insulin dose (C) at screening.
| (A) DUAL I: Changes in HbA1c by antidiabetic treatment at screening | ||||||
|---|---|---|---|---|---|---|
| Group I | Group II | Group I − Group II | p | |||
| Metformin | Metformin + pioglitazone | |||||
| N | Observed change in HbA1c*, † from baseline to EOT | N | Observed change in HbA1c*, † from baseline to EOT | Estimated difference at EOT (95% CI) | ||
| IDegLira | 693 | −1.8 (1.1)* | 140 | −2.1 (1.1)* | 0.21 (0.03; 0.39)* | 0.02 |
| −19.7 (12.0)† | −23.0 (12.0)† | 2.3 (0.3; 4.3)† | ||||
| IDeg | 344 | −1.4 (1.1)* | 69 | −1.6 (1.0)* | 0.07 (−0.19; 0.33)* | 0.59 |
| −15.3 (12.0)† | −17.5 (10.9)† | 0.8 (−2.1; 3.6)† | ||||
| Lira | 341 | −1.2 (1.2)* | 73 | −1.3 (1.2)* | −0.01 (−0.26; 0.24)* | 0.94 |
| −13.1 (13.1)† | −14.2 (13.1)† | −0.11 (−2.84; 2.62)† | ||||
| Between treatment differences | |||
| Estimated difference at EOT (95% CI) | Estimated difference at EOT (95% CI) | ||
| IDegLira − IDeg | −0.43 (−0.56; −0.30)* | −0.59 (−0.87; −0.31)* | <0.0001 |
| −4.69 (−6.12; −3.28)† | −6.45 (−9.51; −3.39)† | ||
| IDegLira − Lira | −0.60 (−0.73; −0.47)* | −0.81 (−1.08; −0.53)* | <0.0001 |
| −6.56 (−7.98; −5.14)† | −8.85 (−11.80; −5.79)† | ||
| (B) DUAL II: Changes in HbA1c by antidiabetic treatment at screening | ||||||
|---|---|---|---|---|---|---|
| Group I | Group II | Group I − Group II | p | |||
| Basal insulin + metformin | Basal insulin + metformin with SU or glinides | |||||
| N | Observed change in HbA1c*, †from baseline to EOT | N | Observed change in HbA1c*, †from baseline to EOT | Estimated differenceat EOT (95% CI) | ||
| IDegLira | 95 | −2.1 (1.0)* | 104 | −1.7 (1.2)* | −0.42 (−0.71; −0.12)* | 0.006 |
| −23.0 (10.9)† | −18.6 (13.1)† | −4.59 (−7.76; −1.31)† | ||||
| IDeg | 98 | −1.2 (1.2)* | 101 | −0.6 (1.1)* | −0.65 (−0.94; −0.36)* | <0.0001 |
| −13.1 (13.1)† | −6.7 (12.0)† | −7.10 (−10.3; −3.93)† | ||||
| Between treatment differences | |||
| Estimated difference at EOT (95% CI) | Estimated difference at EOT (95% CI) | ||
| IDegLira − IDeg | −0.95 (−1.23; −0.66)* | −1.14 (−1.43; −0.85)* | <0.0001 |
| −10.38 (−13.44; 7.21)† | −12.46 (−15.63; −9.29)† | ||
| (C) DUAL II: Changes in HbA1c by basal insulin dose at screening | ||||||
|---|---|---|---|---|---|---|
| Group I | Group II | Group I − Group II | p | |||
| Basal insulin dose ≤30 U | Basal insulin dose >30 U | |||||
| N | Observed change in HbA1c*, †from baseline to EOT | N | Observed change in HbA1c*, †from baseline to EOT | Estimated differenceat EOT (95% CI) | ||
| IDegLira | 126 | −1.9 (1.1)* | 70 | −1.9 (1.0)* | −0.02 (−0.30; 0.26)* | 0.91 |
| −20.8 (12.0)† | −20.8 (10.9)† | −0.2 (−3.3; 2.8)† | ||||
| IDeg | 124 | −0.9 (1.2)* | 73 | −0.9 (1.2)* | −0.22 (−0.56; 0.11)* | 0.19 |
| −9.8 (13.1)† | −9.8 (13.1)† | −2.4 (−6.1; 1.2)† | ||||
Data are observed mean (standard deviation). Estimated treatment differences are based on analysis of covariance. CI, confidence interval; EOT, end‐of‐trial; IDeg, insulin degludec; IDegLira, insulin degludec/liraglutide combination; Lira, liraglutide.
HbA1c in %.
HbA1c in mmol/mol.
In DUAL II, ∼50% of patients in each treatment arm were receiving metformin only pre‐trial, and continued this unchanged during the trial. The remaining 50% continued on their pre‐trial metformin and discontinued sulphonylureas or glinides at randomization (Table S1C). The reduction in HbA1c with IDegLira was greater in patients treated with metformin only [2.1% (23 mmol/mol)] compared with patients treated with metformin plus pre‐trial sulphonylureas or glinides [1.7% (19 mmol/mol); ETD −0.42% (−4.6 mmol/mol); p = 0.006; Table 1B]. Similarly, with IDeg, the reduction in HbA1c was greater in patients treated with metformin as the only pre‐trial OAD versus metformin plus pre‐trial sulphonylureas or glinides (Table 1B). Additionally, the HbA1c reductions were significantly greater with IDegLira versus those with IDeg in patients treated with metformin only, and those treated with metformin plus sulphonylureas or glinides pre‐trial (p < 0.001 for both comparisons; Table 1B).
Notably, in DUAL II, pre‐trial insulin dose (≤30 or >30 U) had no effect on end‐of‐trial HbA1c in either of the treatment arms [end‐of‐trial difference for IDegLira: 0.02% (0.22 mmol/mol); p = 0.91; Table 1C].
In DUAL I, the reduction of HbA1c with IDegLira was 1.8–1.9% (20–21 mmol/mol) across all baseline BMI categories 13. In each BMI category, HbA1c decreased more with IDegLira versus IDeg or liraglutide alone (all p < 0.001; Figure S1A). In DUAL II, the reduction of HbA1c with IDegLira was 1.6–2.1% (17–23 mmol/mol; Figure S1B) and was greater with IDegLira compared with insulin degludec in all BMI categories.
Insulin Dose and Rate of Hypoglycaemia
In DUAL I, the mean observed insulin dose for all patients at end‐of‐trial was lower with IDegLira (39 U) versus IDeg (62 U) 13. The ETD in mean daily insulin doses for IDegLira and IDeg was −23 U (−26; −20), p < 0.0001. Similarly, across all HbA1c categories, mean insulin dose was lower with IDegLira versus IDeg (not analysed statistically; Figure 3A).
Figure 3.
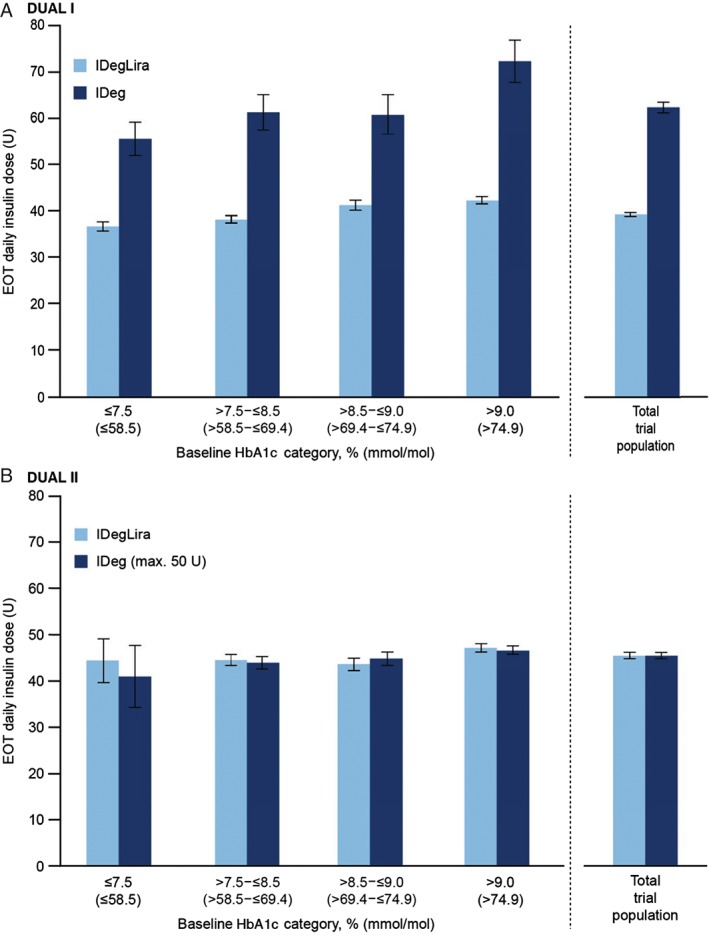
Insulin dose at end‐of‐trial according to baseline HbA1c category in DUAL I (A) and DUAL II (B). Data are mean dose (U) from the safety analysis set, last observation carried forward. Error bars are standard error of the mean. EOT, end‐of‐trial; IDeg, insulin degludec; IDegLira, insulin degludec/liraglutide combination.
In DUAL II, the insulin dose was capped at 50 U; therefore, as planned, end‐of‐trial insulin dose was similar in the two arms for all patients (45 U in each arm, not statistically significant) 11. This similarity in dose was maintained across the HbA1c baseline categories (Figure 3B).
In DUAL I, the rate of hypoglycaemia was significantly lower with IDegLira versus IDeg for the total trial population (Figure 4). Rates of hypoglycaemia were numerically lower with IDegLira than with IDeg in all HbA1c categories, and significantly lower in the categories ≤7.5% (≤58 mmol/mol) and >8.5 to ≤9.0% (>69 to ≤75 mmol/mol). The rate of hypoglycaemia was higher with IDegLira than with liraglutide for the overall trial population and for all HbA1c categories.
Figure 4.
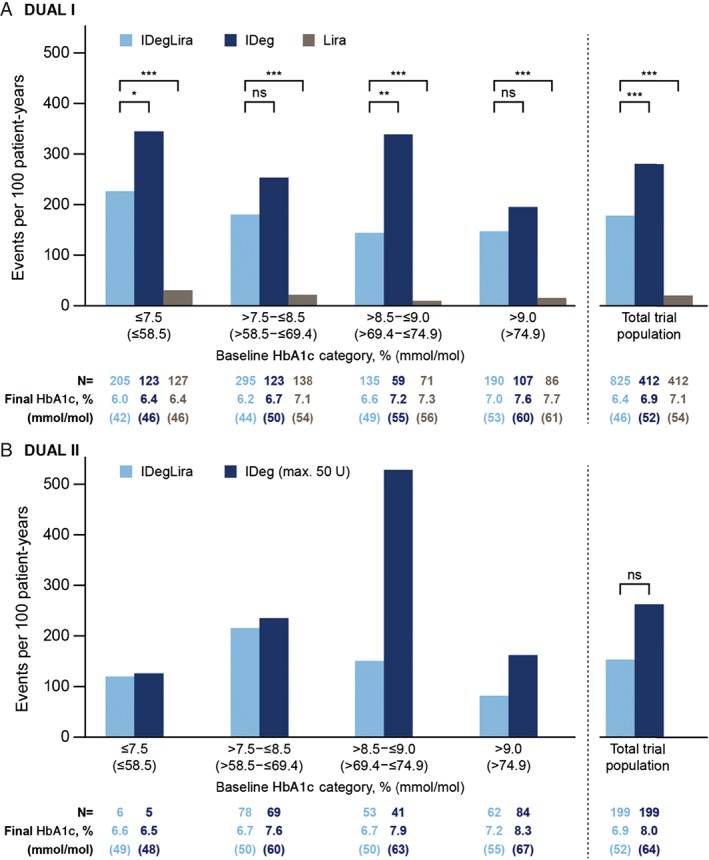
Confirmed hypoglycaemia rate by baseline HbA1c category in DUAL I (A) and DUAL II (B). *p < 0.05; **p = 0.001; ***p < 0.0001. Confirmed hypoglycaemia: patient requiring assistance and/or recorded plasma glucose <3.1 mmol/l; rates from the safety analysis set; p‐values from the full analysis set using a negative binomial regression model. IDeg, insulin degludec; IDegLira; insulin degludec/liraglutide combination; Lira, liraglutide; ns, not significant.
The pattern of hypoglycaemia by HbA1c category in DUAL II is shown in Figure 4B. The rates of hypoglycaemia were similar except for the category HbA1c >8.5 to ≤9.0% (>69 to ≤75 mmol/mol), where there were a high number of events (25 and 30 events) in 2 IDeg‐treated patients. When these 2 patients were excluded, the rate of confirmed hypoglycaemia decreased from 530 events/100 patient‐years of exposure to 246 events/100 patient‐years of exposure.
Discussion
These post hoc analyses of the DUAL I (26‐week main trial period + 26‐week extension trial) and DUAL II trials were performed to determine whether the efficacy of IDegLira versus comparators would differ across various measures of disease progression in T2D. The results showed that patients with values characteristic of more advanced T2D benefit from treatment with IDegLira to the same extent as those at an earlier stage of the disease. IDegLira was efficacious, with respect to HbA1c‐lowering, across all categories of baseline HbA1c up to 10% (86 mmol/mol; the HbA1c value specified as a maximum in the inclusion criteria of both studies). There was no apparent relationship between duration of disease and efficacy in terms of HbA1c for IDegLira, IDeg or liraglutide in DUAL I. Similarly, in DUAL II there was no relationship between disease duration and efficacy in terms of HbA1c with IDegLira. The apparent declining efficacy of IDeg with increased disease duration was probably influenced by the trial design and the 50‐U dose cap in DUAL II (meaning the insulin dose was not fully titrated). The difference in HbA1c reduction depending on pre‐trial OADs was small but significant in both trials, both within a treatment arm and between treatment arms. In contrast, the pre‐trial insulin dose in DUAL II did not affect the outcome. Importantly, the greater reduction in HbA1c with IDegLira versus comparators was apparently irrespective of previous OAD treatment. The greater HbA1c reductions in DUAL II in patients receiving metformin only pre‐trial versus those receiving metformin plus sulphonylureas or glinides in the IDegLira and IDeg arms was probably attributable to the discontinuation of the sulphonylureas or glinides at randomization. It should be noted, however, that the HbA1c reductions in this group were large, considering patients discontinued a treatment at randomization. Additionally, IDegLira was efficacious across all BMI categories investigated (<25 to ≥35 kg/m2) 13.
Limitations of the present analyses are that they were post hoc and the number of patients in some categories was small. In DUAL II, IDeg was capped at a maximum dose of 50 U, and this may have exaggerated the advantage of IDegLira with respect to glycaemic control over continued titration of basal insulin. Additional titration would also be expected to be associated with a greater risk of hypoglycaemia and weight gain, as seen during DUAL I. The number of patients in DUAL II was much smaller than in DUAL I and the numbers in the subgroups are consequently smaller. The analyses were also based on clinical trials that excluded extreme phenotypes, which are difficult to manage, e.g. patients with HbA1c values >10% (86 mmol/mol), BMI >40 kg/m2 (excluded in DUAL I) or receiving insulin doses in excess of 40 U/day (excluded in DUAL II).
The consistent finding of a high level of efficacy for patients with a wide spectrum of baseline characteristics is reassuring from the perspective of clinical decision‐making.
In conclusion, the robustness of the efficacy of IDegLira is independent of the variables generally regarded as indicative of the stage of disease progression (baseline levels of HbA1c, duration of diabetes and baseline diabetes medication) in two different trial populations. This indicates that IDegLira is an effective option for treatment intensification for patients inadequately controlled using OADs or basal insulin, irrespective of their baseline HbA1c.
Conflict of Interest
H.W.R. has served on advisory panels for Amylin, AstraZeneca, Biodel Inc., Bayer Health Care, LLC, Merck, Novo Nordisk, Roche Pharmaceuticals and Sanofi, as a consultant for Biodel Inc., Merck Sharp & Dohme, Roche Pharmaceuticals and Takeda, Merck, Sanofi, has received research support from AstraZeneca, Biodel Inc., Boehringer Ingelheim, Hamni, Janssen, Eli Lilly, Merck Sharp & Dohme, Novartis, Novo Nordisk, Roche Pharmaceuticals and Sanofi and has served as a speaker for AstraZeneca, BMS, Boehringer Ingelheim, Janssen, Eli Lilly, Merck Sharp & Dohme, Novo Nordisk, Sanofi and Takeda. J. B. B. has served as consultant for and is a shareholder with PhaseBio Pharmaceuticals Inc. and has served as a consultant or investigator for Andromeda, AstraZeneca, Boehringer Ingelheim, BMS, Elcelyx Therapeutics Inc., Eli Lilly, GI Dynamics, GlaxoSmithKline; Halozyme Therapeutics, F. Hoffmann‐La Roche Ltd., Intarcia Therapeutics, Johnson & Johnson, Lexicon, LipoScience, Medtronic, Merck Sharp & Dohme, Metabolon Inc., Metavention, Novo Nordisk, Orexigen Therapeutics Inc., Osiris Therapeutics Inc., Pfizer Inc., PhaseBio Pharmaceuticals Inc., Quest Diagnostics, Rhythm Pharmaceuticals, Sanofi, Spherix Inc., Takeda, ToleRx and TransTech Pharma. V. W. has served on advisory boards and speaker bureaus for Novo Nordisk, Eli Lilly, Merck Sharp & Dohme, Boehringer Ingelheim, BMS, Sanofi, AstraZeneca, Johnson & Johnson, Roche and Abbott. T. V. has served as a consultant and participated in speaker's bureaus for AstraZeneca, Boehringer Ingelheim, BMS, Eli Lilly, Merck Sharp & Dohme, Novo Nordisk, Novartis, Sanofi, Takeda and Zealand Pharma and has served on advisory panels for AstraZeneca, Boehringer Ingelheim, BMS, Eli Lilly, GI Dynamics Inc., Merck Sharp & Dohme, Novo Nordisk, Sanofi and Takeda. I. H. L. and K. V. are employees of Novo Nordisk. S. C. L. G. has received honoraria for lectures and advisory boards from AstraZeneca, Lilly, Novo Nordisk, Sanofi, GSK, MSD, Boehringer Ingelheim and Pfizer, and research grants from Eli Lilly, Novo Nordisk and Sanofi.
All authors confirm that they meet the International Committee of Medical Journal Editors uniform requirements for authorship and that they have contributed to: critical analysis and interpretation of the data, drafting/critically revising the article and sharing in the final responsibility for the content of the manuscript and the decision to submit it for publication. I. H. L. and K. V. were responsible for statistical analysis.
Supporting information
Figure S1. Glycated haemoglobin (HbA1c) reduction across baseline body mass index categories in DUAL I (A) and DUAL II (B).
Table S1. The DUAL I and DUAL II trials. (A) Methods. (B) Baseline characteristics in DUAL I 12, 13. (C) Baseline characteristics in DUAL II 11.
Acknowledgements
The authors thank Adele Norman and Daria Renshaw at Watermeadow Medical for excellent medical writing and editorial support. Novo Nordisk provided funding to Watermeadow Medical for medical writing and editorial support. Novo Nordisk conducted the statistical analyses and reviewed the manuscript for medical accuracy. The corresponding author had full access to all the data in the analyses and all authors had final responsibility for the decision to submit for publication.
References
- 1. Dale J, Martin S, Gadsby R. Insulin initiation in primary care for patients with type 2 diabetes: 3‐year follow‐up study. Prim Care Diabetes 2010; 4: 85–89. [DOI] [PubMed] [Google Scholar]
- 2. Khunti K, Wolden ML, Thorsted BL, Andersen M, Davies MJ. Clinical inertia in people with type 2 diabetes: a retrospective cohort study of more than 80,000 people. Diabetes Care 2013; 36: 3411–3417. [DOI] [PMC free article] [PubMed] [Google Scholar]
- 3. Wu N, Aagren M, Boulanger L, Friedman M, Wilkey K. Assessing achievement and maintenance of glycemic control by patients initiating basal insulin. Curr Med Res Opin 2012; 28: 1647–1656. [DOI] [PubMed] [Google Scholar]
- 4. Khunti K, Damci T, Meneghini L, Pan CY, Yale JF, SOLVE Study Group . Study of Once Daily Levemir (SOLVETM): insights into the timing of insulin initiation in people with poorly controlled type 2 diabetes in routine clinical practice. Diabetes Obes Metab 2012; 14: 654–661. [DOI] [PubMed] [Google Scholar]
- 5. Peyrot M, Rubin RR, Lauritzen T et al. Resistance to insulin therapy among patients and providers: results of the cross‐national Diabetes Attitudes, Wishes, and Needs (DAWN) study. Diabetes Care 2005; 28: 2673–2679. [DOI] [PubMed] [Google Scholar]
- 6. Peyrot M, Barnett AH, Meneghini LF, Schumm‐Draeger PM. Insulin adherence behaviours and barriers in the multinational global attitudes of patients and physicians in insulin therapy study. Diabet Med 2012; 29: 682–689. [DOI] [PMC free article] [PubMed] [Google Scholar]
- 7. Novo Nordisk . Xultophy summary of product characteristics. Last updated 2014. Available from URL: https://www.medicines.org.uk/emc/medicine/29493 Accessed 10 July 2015.
- 8. Bode B. An overview of the pharmacokinetics, efficacy and safety of liraglutide. Diabetes Res Clin Pract 2012; 97: 27–42. [DOI] [PubMed] [Google Scholar]
- 9. Keating GM. Insulin degludec and insulin degludec/insulin aspart: a review of their use in the management of diabetes mellitus. Drugs 2013; 73: 575–593. [DOI] [PubMed] [Google Scholar]
- 10. Vora J, Christensen T, Rana A, Bain SC. Insulin degludec versus insulin glargine in type 1 and type 2 diabetes mellitus: a meta‐analysis of endpoints in phase 3a trials. Diabetes Ther 2014; 5: 435–446. [DOI] [PMC free article] [PubMed] [Google Scholar]
- 11. Buse JB, Vilsboll T, Thurman J et al. Contribution of liraglutide in the fixed‐ratio combination of insulin degludec and liraglutide (IDegLira). Diabetes Care 2014; 37: 2926–2933. [DOI] [PubMed] [Google Scholar]
- 12. Gough SC, Bode B, Woo V et al. Efficacy and safety of a fixed‐ratio combination of insulin degludec and liraglutide (IDegLira) compared with its components given alone: results of a phase 3, open‐label, randomised, 26‐week, treat‐to‐target trial in insulin‐naive patients with type 2 diabetes. Lancet Diabetes Endocrinol 2014; 2: 885–893. [DOI] [PubMed] [Google Scholar]
- 13. Gough SC, Bode BW, Woo VC et al. One‐year efficacy and safety of a fixed combination of insulin degludec and liraglutide in patients with type 2 diabetes: results of a 26‐week extension to a 26‐week main trial. Diabetes Obes Metab 2015; 17: 965–973. [DOI] [PMC free article] [PubMed] [Google Scholar]
- 14. International Conference of Harmonisation . ICH harmonised tripartite guideline. Good clinical practice. 01 May 1996.
- 15. World Medical Association . Declaration of Helsinki: ethical principles for medical research involving human subjects. Last amended by the 59th WMA Assembly, Seoul, Republic of Korea, October 2008.
- 16. IFCC standardization of HbA1c . NGSP 2010. Available from URL: http://www.ngsp.org/docs/IFCCstd.pdf. Accessed 10 July 2015.
Associated Data
This section collects any data citations, data availability statements, or supplementary materials included in this article.
Supplementary Materials
Figure S1. Glycated haemoglobin (HbA1c) reduction across baseline body mass index categories in DUAL I (A) and DUAL II (B).
Table S1. The DUAL I and DUAL II trials. (A) Methods. (B) Baseline characteristics in DUAL I 12, 13. (C) Baseline characteristics in DUAL II 11.