

Summary
Objective
The objective of this study was to examine how sensitivity to short‐term reward and long‐term goal perseverance are related to body mass index (BMI; kg m2) in a large sample of men and women with and without obesity.
Methods
A total of 450 participants (56.2% male; 73.1% non‐Hispanic White) with mean ± standard deviation age of 30.7 ± 10.4 years and BMI of 29.3 ± 8.2 completed online versions of the Delayed Reward Discounting task to measure sensitivity to short‐term reward and the Grit Scale to measure long‐term goal perseverance.
Results
In regression analysis, higher sensitivity to short‐term reward (i.e. a preference for receiving smaller rewards after a shorter delay; b = 0.49, p = 0.016) and lower long‐term goal perseverance (b = −1.26, p = 0.042) were independently associated with higher BMIs. Individuals with a favourable score on one measure were not ‘protected’ from the risk associated with an unfavourable score on the other measure.
Conclusions
An overvaluation of short‐term reward (e.g. the taste of palatable food and the comfort of engaging in sedentary activities) and undervaluation of long‐term health goals (e.g. achieving a healthy weight and avoiding obesity‐related comorbidities) may contribute to excess weight. Additional research incorporating prospective experimental designs is needed to determine whether decision‐making strategies can be targeted to improve weight management.
Keywords: Decision‐making, delayed reward discounting, goal perseverance
Introduction
Obesity is thought to be driven partly by an overvaluation of short‐term reward (e.g. the taste of palatable food and the comfort of engaging in sedentary activities) and undervaluation of long‐term health goals (e.g. achieving a healthy weight and avoiding obesity‐related comorbidities) 1, 2. One potential explanation for this phenomenon, which is informed by principles of behavioural economics, suggests that food may become such a powerful source of reward that some individuals have trouble identifying equally rewarding substitutes or delaying consumption of good‐tasting food, despite awareness of negative health consequences 3. A second, complementary, explanation involves dysfunction in brain circuits related to lack of inhibitory control and oversensitivity to food cues, which could lead to patterns of impulsive behaviour similar to what is observed among individuals with addiction 4. This theory is supported by evidence of increased cognitive impairment in individuals with obesity 5. Given the potential for patterns in decision‐making to influence weight‐related behaviours, there is an interest in determining whether sensitivity to short‐term reward and/or goal persistence varies by weight status and whether the latter may mitigate any negative effects of the former. Such findings may suggest targets for behavioural obesity intervention.
The Delayed Reward Discounting (DRD) task is a method of quantifying the degree to which immediate, smaller rewards are valued over greater, delayed rewards 6. Measurement of DRD typically involves presenting a participant with hypothetical choices between receiving immediate smaller sums of money and larger sums that are delayed. Higher DRD is associated with suboptimal behavioural patterns and health outcomes such as addictive disorders including drug and alcohol dependence 6, smoking 7 and pathological gambling 8.
A modicum of prior research has examined DRD in relation to weight status. For example, one small (n = 95) study conducted with undergraduate students showed that DRD was higher in women with obesity versus those without obesity, but there was no difference in DRD among men with and without obesity 4. Another study showed that, among women participating in a healthy food shopping intervention (n = 199), DRD was higher in participants with versus without obesity 3. A third study with a larger online sample (n = 1,163) also found higher DRD in individuals with versus without obesity, but used a questionnaire version of the DRD task that is less sensitive than the computerized procedure now typically employed 9. Notably, the important contributions of prior studies evaluating DRD in relation to weight status are limited by small samples, inclusion of women only and/or less sensitive measures of DRD. Furthermore, none have examined DRD in relation to long‐term goal perseverance.
‘Grit’ has been defined as ‘perseverance and passion for long‐term goals’, even when confronted with obstacles 10. The Grit Scale, which is unrelated to intelligence, has been used to predict measures of success, such as educational attainment and performance in an academic competition 10. For many if not most individuals, maintenance of a healthy weight likely requires a long‐term commitment to healthy eating and physical activity behaviours. Thus, grit might be expected to be higher in persons without obesity compared with those with obesity, although this has not been tested. Furthermore, grit may be expected to mitigate the deleterious effects of a tendency to overvalue short‐term rewards, as measured by DRD.
The purpose of the current study was to evaluate DRD, grit and their association with body mass index (BMI; kg m2) in a large sample of free‐living adults with and without obesity, as well as determine whether the strength of the association between BMI and DRD was attenuated when grit levels were high. A secondary aim involved testing whether the strength of the aforementioned associations differed by gender.
Materials and methods
Participants and procedures
Amazon Mechanical Turk (AMT; 11) was used to recruit 450 men and women who completed informed consent, a demographic questionnaire, the DRD task and the Grit Scale, in that order, via the Web. AMT is a crowdsourcing marketplace for individuals seeking to complete small tasks online for pay 11. It is often used by researchers seeking participants to complete computerized tests and/or questionnaires, given the diversity of the participant pool and the evidence that studies using AMT have replicated findings from studies using other sources of recruitment 11. A potential participant may browse a list of research opportunities, which include brief descriptions of the studies available and the compensation offered. Those interested in participating may then complete a study's procedures online and receive immediate compensation credited to their account electronically. Most participants completed the study procedures via AMT within 20 min, and all were compensated $5.
Measures
A demographic questionnaire was used to collect participant's gender, age, body weight, height, race, ethnicity and approximate yearly income. BMI was calculated as kg m2.
The DRD task followed the computerized protocol used in recent studies 12, 13 in which participants repeatedly chose between receiving a larger sum ($100 or $1,000 depending on the task) delayed for a fixed period (e.g. 1 month) and a smaller immediate sum, which varied in value across trials. An adjusting algorithm determined the amount of immediately available money rated as equivalent to the larger delayed sum. In this study, discounting was assessed at 1 d, 1 week, 1 month, 6 months, 1 year, 5 years, and 25 years, presented in a random order. At each delay, a choice was first presented between the delayed larger sum (e.g. $1,000) and half the larger sum (e.g. $500) available immediately. Depending on the choice made by the participant, the immediate amount then adjusted up (delayed choice) or down (immediate choice) by half (e.g. $250), and a new choice was presented. This continued for five choice trials per delay, with the immediate amount adjusting by an amount half that of the previous adjustment. This resulted in 32 potential indifference points evenly spaced between $0 and the larger sum. Mazur's hyperbolic discounting model was used to calculate k (a participant's degree of preference for the smaller immediate reward) using the indifference points 14.
The Grit Scale 10 consisted of 12 items such as ‘Setbacks don't discourage me’ that were rated on a 5‐point Likert scale ranging from 1 = not at all like me to 5 = very much like me. A total score representing perseverance of effort and consistency of interests was obtained by taking the average of the item responses. Reliability of the measure is high (α = 0.85) and is associated with achievement‐related outcomes 10.
Statistical analyses
Descriptive statistics including means, standard deviations, counts and percentages were used to summarize the sample and scores on the DRD task and Grit Scale. Demographics, DRD and Grit Scale scores of obese (BMI ≥ 30) and non‐obese (BMI < 30) participants were compared using independent samples t‐test and χ 2 as appropriate. DRD and Grit Scale score associations were tested with correlations. Linear regression analysis was used to predict BMI from DRD and Grit Scale score simultaneously. In a second step, the Grit Scale score × DRD interaction was tested. In a third and final step, DRD × gender and Grit Scale score × gender interactions were tested. Regressions controlled for age, gender, level of education, income and non‐White race. As is standard, DRD values were natural log transformed prior to analysis to bring the data closer to a normal distribution and are reported as ln(k). Analyses were conducted with two‐tailed tests and α = 0.05. Given the limited number of a priori hypotheses tested in this study, no correction was made for type I error.
Results
Participant characteristics
Characteristics of the 450 participants are presented in Table 1. Both genders were nearly equally represented, and over a quarter of the sample was comprised of individuals with a racial and/or ethnic minority background (n = 329, 73.1% non‐Hispanic White). The mean ± standard deviation age was 30.7 ± 10.4 years. Almost half of the sample (46.4%) had a BMI >30 and were considered obese (n = 209); obese and non‐obese individuals weighed on average 105.4 ± 21.3 vs 70.2 ± 12.5 kg (p < 0.001) and had a BMI of 36.2 ± 6.7 vs 23.4 ± 3.0 kg m2 (p < 0.001). Obese and non‐obese individuals did not differ on income, but obese individuals were older (33.2 ± 11.2 vs 28.6 ± 9.1 years old; p < 0.001), more likely to be women (54.1% vs 34.9%; p < 0.001), non‐Hispanic White (78.0% vs 68.9%; p = 0.033) and less likely to have at least some post‐high school education (79.0% vs 88.4%; p = 0.007). There were no other statistically significant differences between individuals with and without obesity.
Table 1.
Participant characteristics
| Full sample | With obesity | Without obesity | |
|---|---|---|---|
| (N = 450) | (N = 209) | (N = 241) | |
| Gender, no. (%)* | |||
| Men | 253 (56.2) | 96 (45.9) | 157 (65.1) |
| Women | 197 (43.8) | 113 (54.1) | 84 (34.9) |
| Age, mean (SD), years* | 30.7 (10.4) | 28.6 (9.1) | 33.2 (11.2) |
| Race, no. (%)* | |||
| American Indian | 2 (0.4) | 1 (0.5) | 1 (0.4) |
| Asian | 45 (10.0) | 9 (4.3) | 36 (14.9) |
| Black | 28 (6.2) | 12 (5.7) | 16 (6.6) |
| White | 356 (79.1) | 177 (84.7) | 179 (74.3) |
| Other | 18 (4.0) | 9 (4.3) | 9 (3.7) |
| Not reported | 1 (0.2) | 1 (0.5) | 0 (0) |
| Ethnicity, no. (%) | |||
| Hispanic or Latino | 35 (7.8) | 19 (9.1) | 16 (6.6) |
| Not Hispanic or Latino | 415 (92.2) | 190 (90.9) | 225 (93.4) |
| Annual income, no. (%) | |||
| Under $25,000 | 87 (19.3) | 46 (23.4) | 38 (15.8) |
| $25,000–$49,999 | 142 (31.6) | 71 (34.0) | 71 (29.5) |
| $50,000–$74,999 | 102 (22.7) | 37 (17.7) | 65 (27.0) |
| $75,000–$99,999 | 44 (9.8) | 19 (9.1) | 25 (10.4) |
| $100,000–$124,999 | 36 (8.0) | 15 (7.2) | 21 (8.7) |
| Not reported | 39 (8.6) | 18 (8.6) | 21 (8.7) |
| Education, no. (%)* | |||
| High school or less | 72 (16) | 44 (21.1) | 28 (11.6) |
| Some college | 185 (41.1) | 79 (37.8) | 106 (44.0) |
| College or University Degree | 164 (36.4) | 69 (33.0) | 95 (39.4) |
| Graduate Degree | 29 (6.4) | 17 (8.1) | 12 (4.5) |
| Weight, mean (SD), kg* | 86.6 (24.5) | 105.4 (21.3) | 70.2 (12.5) |
| Body mass index, mean (SD), kg m2 * | 29.3 (8.2) | 36.2 (6.7) | 23.4 (3.0) |
Statistically significant difference between individuals with and without obesity.
(p < 0.05).
SD, standard deviation.
Association of DRD and grit with weight status
Mean ± standard deviation DRD (ln(k)) was higher among obese versus non‐obese individuals in both the $100 (−5.09 ± 2.05 vs −5.47 ± 1.88, p = 0.048) and $1,000 task (−6.00 ± 1.98 vs −6.55 ± 1.70, p = 0.002) indicating a preference for smaller immediate rewards (i.e, greater reward discounting) among individuals with obesity. Grit Scale scores did not differ between individuals with and without obesity (3.19 ± 0.67 vs 3.26 ± 0.62, p = 0.266). Grit Scale score was not correlated with DRD ln(k) in the $100 (r = −0.012, p = 0.806) or $1,000 (r = −0.003, p = 0.952) task.
When evaluated simultaneously in a single linear regression model, both higher DRD and lower Grit Scale score independently predicted higher BMI, controlling for age, gender, level of education, income and non‐White race (Table 2). As seen in Figure 1, BMI was highest in those with a preference for smaller immediate rewards (i.e. higher DRD) and low perseverance for long‐term goals (e.g. low grit). In a second step of the analysis, Grit Scale score was allowed to interact with DRD to predict BMI. The interaction term was not statistically significant (p's > 0.266) in models with DRD values from the $100 and $1,000 tasks, suggesting that the association between DRD and BMI did not depend on level of grit. In the final models tested, the DRD × gender and Grit Scale score × gender interaction terms were also non‐significant (p's > 0.231), indicating that the associations between DRD and BMI, and Grit Scale score and BMI, did not differ for the two genders.
Table 2.
Delay Reward Discounting and Grit Scale score as predictors of BMI in linear regression analysis
| Variable | B | SE (B) | β | t | Sig. (p) |
|---|---|---|---|---|---|
| DRD $100 Task, R 2 = 0.352 | |||||
| Intercept | 31.45 | 2.48 | — | 12.70 | <0.001 |
| DRD, ln(k) | 0.49 | 0.20 | 0.12 | 2.42 | 0.016 |
| Grit Scale score | −1.26 | 0.62 | −0.10 | 2.04 | 0.042 |
| Age, years | 0.16 | 0.04 | 0.21 | 4.12 | <0.001 |
| Gender | 2.44 | 0.81 | 0.15 | 3.03 | 0.003 |
| Education | −1.42 | 0.84 | −0.09 | 1.69 | 0.091 |
| Income | −1.95 | 0.81 | 0.12 | 2.42 | 0.016 |
| Race/ethnicity | 0.10 | 0.89 | 0.01 | 2.04 | 0.911 |
| DRD $1,000 Task, R 2 = 0.357 | |||||
| Intercept | 32.20 | 2.59 | — | 12.44 | <0.001 |
| DRD, ln(k) | 0.55 | 0.21 | 0.13 | 2.59 | 0.010 |
| Grit Scale score | −1.27 | 0.62 | −0.10 | 2.06 | 0.040 |
| Age, years | 0.16 | 0.04 | 0.21 | 4.19 | <0.001 |
| Gender | 2.42 | 0.80 | 0.15 | 3.03 | 0.003 |
| Education | −1.02 | 0.82 | −0.06 | 1.24 | 0.215 |
| Income | −1.93 | 0.79 | 0.12 | 2.44 | 0.015 |
| Race/ethnicity | −0.11 | 0.88 | 0.01 | 0.13 | 0.901 |
BMI, body mass index; DRD, Delay Reward Discounting; SE, standard error.
Figure 1.
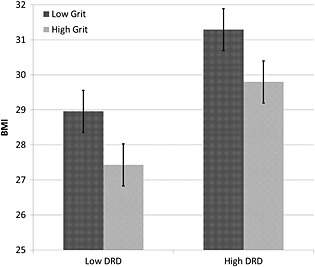
Model estimates of body mass index (BMI; kg m2) at low (one standard deviation below the mean) and high (one standard deviation above the mean) levels of Grit and Delayed Reward Discounting (DRD) with standard error bars. Linear regression models were used to predict BMI from DRD and Grit Scale score simultaneously controlling for age, gender, level of education, income and non‐White race.
Discussion
This is the first study to show that higher sensitivity to short‐term reward and lower long‐term goal perseverance are both independently associated with higher BMI in a large sample of free‐living men and women and that the pattern of association does not differ for women versus men. These findings are consistent with previous studies showing a greater preference for smaller immediate rewards in women with elevated BMIs 4 and women participating in a weight‐related intervention 3 but differed from previous research in that a similar effect was detected for men. While higher grit is known to be associated with markers of achievement 10, this is the first study showing an association with lower BMI. Notably, higher Grit Scale scores did not lessen the tendency for greater sensitivity to short‐term reward to be associated with higher BMI.
These findings suggest that behavioural weight management interventions may benefit from directly targeting decision‐making styles. Furthermore, targeting both short‐term reward sensitivity and long‐term goal perseverance separately may be important as each was independently associated with BMI in this study, and individuals with a favourable score on one measure were not ‘protected’ from the risk associated with an unfavourable score on the other measure.
Some evidence suggests that DRD can be improved via behavioural training focused on working memory or reinforcement expectations, for example 15, 16. However, it is unclear whether training to improve DRD leads to improved health behaviours. Thus, a more advantageous approach may be to provide training in decision‐making strategies that are directly relevant to weight‐related behaviours, such as eating and physical activity. Two early studies suggest that training participants to focus on the long‐term consequences of obesity (e.g. increased risk of illness and decreased quality of life) may lead to reduced food cravings and increased inhibitory control‐related brain activity when compared with attempts at distraction, suppression or acceptance‐based strategies 17, 18.
This study has notable strengths including the large sample of both men and women, inclusion of individuals with and without obesity and racial/ethnic minority representation >25%. Limitations include the cross‐sectional design and use of self‐report measures, including height and weight. These limitations constrain the conclusions that can be drawn from this study, including potential implications for treatment development. Additional research incorporating prospective experimental designs is clearly needed to determine whether training in decision‐making strategies can improve weight management.
Conflict of Interest Statement
No conflict of interest was declared.
Graham Thomas, J. , Seiden, A. , Koffarnus, M. N. , Bickel, W. K. , and Wing, R. R. (2015) Delayed reward discounting and grit in men and women with and without obesity. Obesity Science & Practice, 1: 131–135. doi: 10.1002/osp4.12.
References
- 1. Davis C, Levitan RD, Muglia P, Bewell C, Kennedy JL. Decision‐making deficits and overeating: a risk model for obesity. Obes Res 2004; 12: 929–35. [DOI] [PubMed] [Google Scholar]
- 2. Lowe MR, Butryn ML. Hedonic hunger: a new dimension of appetite? Physiol Behav 2007; 91: 432–439. [DOI] [PubMed] [Google Scholar]
- 3. Epstein LH, Jankowiak N, Fletcher KD, Carr KA, Nederkoorn C, Raynor HA, et al. Women who are motivated to eat and discount the future are more obese. Obesity 2014; 22: 1394–1399. [DOI] [PMC free article] [PubMed] [Google Scholar]
- 4. Weller RE, Cook EW, Avsar KB, Cox JE. Obese women show greater delay discounting than healthy‐weight women. Appetite 2008; 51: 563–569. [DOI] [PubMed] [Google Scholar]
- 5. Smith E, Hay P, Campbell L, Trollor JN. A review of the association between obesity and cognitive function across the lifespan: implications for novel approaches to prevention and treatment. Obes Rev 2011; 12: 740–755. [DOI] [PubMed] [Google Scholar]
- 6. MacKillop J, Amlung MT, Few LR, Ray LA, Sweet LH, Munafo MR. Delayed reward discounting and addictive behavior: a meta‐analysis. Psychopharmacology (Berl) 2011; 216: 305–321. [DOI] [PMC free article] [PubMed] [Google Scholar]
- 7. Bickel WK, Odum AL, Madden GJ. Impulsivity and cigarette smoking: delay discounting in current, never, and ex‐smokers. Psychopharmacology (Berl) 1999; 146: 447–454. [DOI] [PubMed] [Google Scholar]
- 8. Alessi SM, Petry NM. Pathological gambling severity is associated with impulsivity in a delay discounting procedure. Behav Processes 2003; 64: 345–354. [DOI] [PubMed] [Google Scholar]
- 9. Bickel WK, George WA, Franck CT, Terry ME, Jarmolowicz DP, Koffarnus MN, et al. Using crowdsourcing to compare temporal, social temporal, and probability discounting among obese and non‐obese individuals. Appetite 2014; 75: 82–89. [DOI] [PMC free article] [PubMed] [Google Scholar]
- 10. Duckworth AL, Peterson C, Matthews MD, Kelly DR. Grit: perseverance and passion for long‐term goals. J Pers Soc Psychol 2007; 92: 1087–1101. [DOI] [PubMed] [Google Scholar]
- 11. Buhrmester M, Kwang T, Gosling SD. Amazon's Mechanical Turk: a new source of inexpensive, yet high‐quality, data? Perspect Psychol Sci 2011; 6: 3–5. [DOI] [PubMed] [Google Scholar]
- 12. Epstein LH, Jankowiak N, Lin H, Paluch R, Koffarnus MN, Bickel WK. No food for thought: moderating effects of delay discounting and future time perspective on the relation between income and food insecurity. Am J Clin Nutr 2014; 100: 884–890. [DOI] [PMC free article] [PubMed] [Google Scholar]
- 13. Koffarnus MN, Bickel WK. A 5‐trial adjusting delay discounting task: accurate discount rates in less than one minute. Exp Clin Psychopharmacol 2014; 22: 222–228. [DOI] [PMC free article] [PubMed] [Google Scholar]
- 14. Mazur JE. An adjusting procedure for studying delayed reinforcement. Quant Anal of Behav 1987; 5: 55–73. [Google Scholar]
- 15. Bickel WK, Yi R, Landes RD, Hill PF, Baxter C. Remember the future: working memory training decreases delay discounting among stimulant addicts. Biol Psychiatry 2011; 69: 260–265. [DOI] [PMC free article] [PubMed] [Google Scholar]
- 16. Dixon MR, Holton B. Altering the magnitude of delay discounting by pathological gamblers. J Appl Behav Anal. 2009; 42: 269–275. [DOI] [PMC free article] [PubMed] [Google Scholar]
- 17. Yokum S, Stice E. Cognitive regulation of food craving: effects of three cognitive reappraisal strategies on neural response to palatable foods. Int J Obes 2013; 37: 1565–1570. [DOI] [PMC free article] [PubMed] [Google Scholar]
- 18. Demos KE, Lillis J, Kent K, Goldring A, McCaffery JM, Wing RR. (2014). The effects of cognitive strategies on neural food cue‐reactivity Paper presented at the 32nd Annual Scientific Meeting of the Obesity Society, Boston, MA. [Google Scholar]