

Summary
Background
The aim of this 1HMRS study was to identify any potential regional differences in the metabolic spectrum in the brains of healthy children.
Material/Methods
Forty-nine healthy children aged 6–15 years (mean 11.6 years) were examined, including 21 girls and 28 boys. A 1.5T MR system (xi Signa HD 1.5T General Electric) was used in patient examinations. The VOI (Volume of Interest) was defined in 7 locations: the frontal lobe in the right and left hemispheres, the basal ganglia in the right and left hemispheres, hippocampus in the right and left hemispheres and cerebellum. SAGE 7.0 software was used for the analysis of data obtained from the 1HMRS study. Differences in the concentrations of metabolites in various regions of the brain in children were verified using the t-test for independent samples.
Results
There were significant differences in concentration levels between various brain regions for all the examined metabolites. NAA was the metabolite characterized by the greatest regional variation with significant differences being observed between all locations. Only in the case of Lip/Cr and the ratio of the Lip concentration to the sum of the concentrations of all the metabolites no significant differences could be observed.
Concluisons
The results of the study show that a child’s brain is inhomogeneous. The results underline the need of the regional differences in the concentrations of metabolites being taken into account when comparing the results of 1HMRS studies in children.
MeSH Keywords: Brain, Child, Magnetic Resonance Spectroscopy
Background
Proton magnetic resonance spectroscopy (1HMRS) provides information on the concentrations of metabolites at different locations [1–7]. Individual regions of the brain differ between one another in structure and function, and thus in the levels of metabolites being present in each of these regions [8–12]. Relatively few studies are available to confirm this suggestion; in addition, they pertain only to adult patients.
As metabolic changes are highly likely to occur in the brain with age [9,13–16], no direct comparisons of spectroscopic data from adults and children should be made in clinical practice. Therefore, the objective of this study is to attempt the determination of differences in metabolite concentrations between four regions of the brain (frontal lobe, basal ganglia, hippocampus, and cerebellum) in a group of children aged 6–15 years on the basis of proton magnetic resonance spectroscopy (1HMRS).
Material and Methods
Study group
A total of 49 healthy children aged 6–15 years (mean age: 11.6 years), including 21 girls and 28 boys, were included in the study. The study group was selected according to the criteria of absence of craniocerebral injuries or nervous system disorders. The study had received a positive opinion from the Bioethics Committee of the Jagiellonian University Medical College.
Study protocol
A 1.5T MR system (Signa HD xt 1,5 T General Electric) was used in the study. T2-weighted images (structural imaging), were acquired and used for the planning of regions in which the 1HMRS signals were further collected. Volumes of interest (VOIs) were identified within 7 locations including right frontal lobe, left frontal lobe, right basal ganglia, left basal ganglia, right hippocampus, left hippocampus, and cerebellum. The selected locations were located symmetrically in the left and the right hemisphere with the exception of centrally-located cerebellum. The spectra were acquired using the point-resolved spectroscopy sequence (PRESS) at TE=35 ms, TR=1500 ms, no. of acquisitions=128, slice thickness=20 mm, FOV=2×2 cm.
Preprocessing and analysis of data
The data obtained in 1HMRS scans were analyzed using SAGE 7.0 software (Spectroscopy Analysis, GE). Areas under individual peaks of the spectrum were used to determine absolute concentrations of the following metabolites: N-acetylaspartate (NAA), creatine (Cr), choline (Cho), myoinositol (ml), lipids (Lip), and lactates (Lac). Next, relative concentrations of these metabolites were calculated as ratios of concentrations of individual metabolites to the sum of the concentrations of all metabolites as well as to the concentration of creatine. For the symmetrically distributed locations (frontal lobes, basal ganglia, hippocampi), mean levels were calculated by adding up the left and the right hemisphere levels and subsequently dividing the result by 2. Statistical analysis was performed for all the determined concentrations (means and standard deviations were calculated). The differences between the levels of metabolites in different brain regions were verified using the t-test for independent samples. The statistical significance level for the results was accepted as p<0.05.
Results
The results obtained in the study were analyzed and presented in graphs and a table. Figure 1 compares the absolute concentrations of individual metabolites at the study locations. Figure 2 presents a similar comparison of relative concentrations calculated against the concentration of Cr, while Figure 3 presents the comparison of relative concentrations calculated against the sum of concentrations of all metabolites. Table 1 lists the concentrations of metabolites for which statistically significant differences were observed between individual locations.
Figure 1.
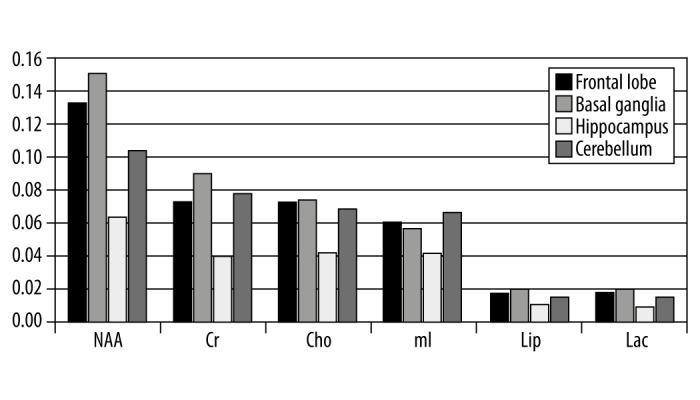
Absolute concentrations of metabolites in 4 brain regions in healthy children.
Figure 2.
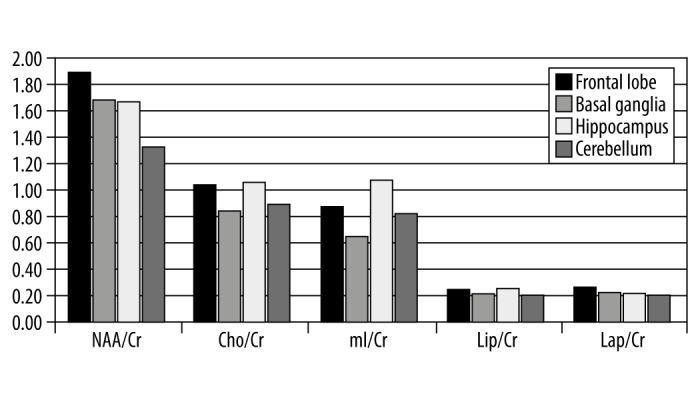
Relative concentrations of metabolites calculated against Cr concentration in 4 brain regions in healthy children.
Figure 3.
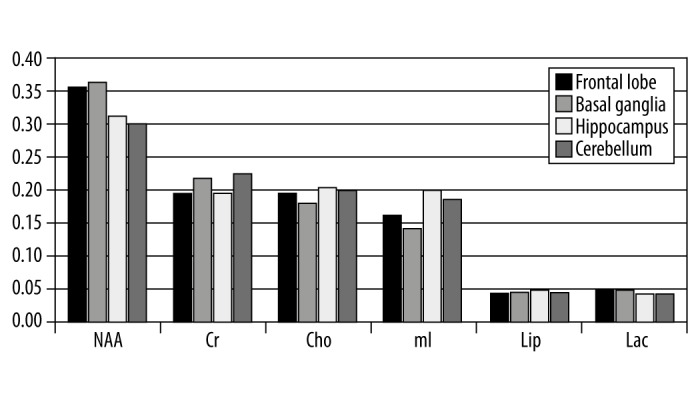
Relative concentrations of metabolites calculated against the total concentration of all metabolites in 4 brain regions in healthy children.
Table 1.
The list of metabolite concentrations with statistically significant differences between the brain regions (* p<0.05).
| Frontal lobe | Basal ganglia | Cerebellum | |
|---|---|---|---|
| Basal ganglia | NAA, Cr, NAA/Cr, Cho/Cr, mI/Cr, Lac/Cr, Cr/Sum, Cho/Sum, mI/Sum | – | – |
| Cerebellum | NAA, NAA/Cr. Cho/Cr, Lac/Cr, NAA/Sum, Cr/Sum, mI/Sum | NAA, Cr, Lac, NAA/Cr, mI/Cr, NAA/Sum, Cho/Sum, mI/Sum | – |
| Hippocampus | NAA, Cr, Cho, mI, Lip, Lac, NAA/Cr, mI/Cr, Lac/Cr, NAA/Sum, mI/Sum, Lac/Sum | NAA, Cr, Cho, mI, Lip, Lac, Cho/Cr, mI/Cr, NAA/Sum, Cr/Sum, Cho/Sum, mI/Sum, Lac/Sum | NAA, Cr, Cho, mI, Lip, Lac, NAA/Cr, Cho/Cr, mI/Cr, Cr/Sum, mI/Sum |
Significant differences between different regions of brain were observed for all the metabolites. Only in the case of Lip/Cr ratio and the ratio between Lip levels and the sum of concentrations of all metabolites no such differences could be observed. Lac/Cr ratios differed significantly between the frontal lobe and the remaining locations while the concentration of Cho relative to the sum of concentrations of all metabolites differed significantly between basal ganglia and the remaining locations. NAA was characterized by the largest regional diversity as significant differences in its levels were observed for all pairs of locations. The highest NAA levels were observed within the basal ganglia while the lowest levels were observed within the hippocampus. Also in the case of Cr, the highest levels were observed within the basal ganglia and the lowest levels were observed within the hippocampus. Similar levels of CR were observed in the pair of regions consisting of the frontal lobe and cerebellum. The relative concentration of mI calculated against the sum of concentrations of all metabolites differed significantly between all brain regions while no significant differences were observed for the mI/Cr ratio other than between the frontal lobe and cerebellum. Relative concentrations of Cho/Cr and Cr calculated against the sum of all metabolites were similar only between the frontal lobe and hippocampus and between the basal ganglia and cerebellum. The relative concentrations of all metabolites calculated against the Cr concentration were lower within the cerebellum as compared to the other brain regions with the exception of Cho/Cr and mI/Cr for which the cerebellar levels were lower than those in the frontal lobes and basal ganglia yet higher than in the hippocampus.
Particularly large differences in metabolite concentrations were observed between the hippocampus and the remaining brain regions. This was true for all metabolites and all locations. Significant differences between the hippocampal and frontal lobe levels were observed in relative concentrations of NAA/Cr, mI/Cr, Lac/Cr as well as the relative concentrations of NAA, mI and Lac calculated against the sum of concentrations of all metabolites. In the comparisons between hippocampal and cerebellar levels, significant differences were observed in relative concentrations of NAA/Cr, Cho/Cr, mI/Cr, as well as the relative concentrations of Cr and mI calculated against the sum of concentrations of all metabolites whereas in the comparisons between hippocampal and basal ganglia levels, significant differences were observed in relative concentrations of Cho/Cr, mI/Cr as well as the relative concentrations of all metabolites besides Lip calculated against the sum of concentrations of all metabolites. Significant differences between cerebellar and frontal lobe levels were observed for NAA, NAA/Cr, Cho/Cr, Lac/Cr as well as the relative concentrations of NAA, Cr, and mI calculated against the sum of concentrations of all metabolites. When comparing the cerebellum and basal ganglia, significant differences were observed for NAA, Cr, Lac, NAA/Cr, mI/Cr, as well as relative concentrations of NAA, Cho, and mI calculated against the sum of concentrations of all metabolites. Significant differences between basal ganglia and the frontal lobe were observed for NAA and Cr (absolute concentrations), relative concentrations of Cr, Cho, and mI calculated against the sum of concentrations of all metabolites as well as relative concentrations of all metabolites calculated against the Cr concentration with the exception of Lip/Cr.
Discussion
All researchers involved in 1HMRS studies of brain admit that human brain is inhomogeneous in terms of the distribution of metabolites [9,10,17]. Differences in NAA, Cr, Cho, and mI concentrations between individual brain locations were the subject of numerous studies taken up by different research teams, with the obtained results differing between studies [18]. In this study, significant differences in metabolite concentrations were observed between individual brain locations for all the metabolites examined in the study, which was in line with current literature reports [10].
Hippocampus
The hippocampus plays an important role in emotional and memory processes [19]. Hippocampal levels of all the metabolites were lower than in the remaining brain regions, the differences being statistically significant. The obtained results are in line with those obtained by the team led by Angelie [16]. The observation was the consequence of the reduced neuronal density within the hippocampus. As also demonstrated by Angelie’s group, concentration of NAA as calculated against the sum of concentrations of all the metabolites is significantly lower within the hippocampus as compared to the other brain regions, which is partially in line with the results of our study. Komoroski [20] observed a significant difference between the NAA/Cr concentration ration between the left and the right hippocampus and the remaining parts of the brain. Otsuka [19] was one of the few researchers to conduct spectroscopic studies in pediatric patients. His reports were also not fully compliant with the results obtained in our study, as he showed that hippocampal concentration of Cho in healthy children was higher than that in the cerebellum while the opposite was true for Cr levels. In our study, both these metabolites were characterized by hippocampal levels being lower than the cerebellar ones.
Cerebellum
The main function of cerebellum consists in motor coordination and muscle tone control. Minati [10] verified the concentrations of mI, NAA, Cr and Cho in several locations within the brain. Cerebellar concentrations of these metabolites were found to be higher than those in the frontal lobe or hippocampus. In our study, we also observed the cerebellar levels of these metabolites to be higher than those within the hippocampus; however, only absolute Cr and mI levels as well as relative concentrations of Cr, Cho, and mI as calculated against the sum of concentrations of all the metabolites were higher in the cerebellum than in the frontal lobes.
Frontal lobes
Frontal lobes are largely responsible for reasoning and memory processes. In this study, NAA/Cr and mI/Cr ratios were differed significantly between the frontal lobe and the hippocampus which was in line with the results obtained by Santos [11] in a group of young patients (age <30 years). Santos demonstrated significant differences in NAA/Cr, Cho/Cr, and mI/Cr ratios. Concentration of Cr, as well as the concentrations of all metabolites relative to that of Cr (except for Lip/Cr) were significantly different between the frontal lobe and basal ganglia. Sailasuta [18] also observed a significant difference in Cr levels between both these locations. A statistically significant difference in metabolite concentrations was also observed between this locations in the case of Cho; however, this could not be confirmed by the findings of our study. Lac/Cr was differed significantly between the frontal lobe and the remaining locations. Grachev [17] demonstrated the differences between metabolite concentrations at individual brain regions: the levels of NAA, mI, and Lac are higher within the frontal lobe than in the thalamus while the opposite is true in case of Cho. In this study, the thalamic spectrum was not analyzed; however, the metabolites were also demonstrated to be present at high concentrations within the frontal lobe.
Basal ganglia
The basal ganglia play a multitude of roles associated with the motor control as well as with cognitive processes. Based on the results of the 1HMRS study, basal ganglia were characterized by the highest concentrations of NAA, Cr, Cho, Lip, and Lac among all the studied locations. Komoroski [20] demonstrated that NAA/Cr ratio differed significantly between the left basal ganglion and the remaining parts of brain. Cho/Cr and mI/Cr ratios also differed significantly between the basal ganglia and other cerebral regions as also confirmed by our study team.
Most studies differed in the examination parameters. Different MR devices and different MRS techniques are used by the researchers [1,20]. Therefore, it is difficult to accurately and fully reliably compare the results obtained by individual researchers [20]. Oftentimes, it is also difficult to compare specific metabolite levels as the research teams present their study results in different forms. Currently, the results are most often presented as relative concentrations, although absolute values are sometimes used as well [8,21]. Therefore, we decided to present our study results as both absolute concentrations and relative concentrations (calculated against the concentration of Cr as well as against the sum of the concentrations of all metabolites).
Based on the obtained results, it was concluded that cerebral location had an effect on the levels of individual metabolites. Local chemical properties (different concentrations of metabolites) are due to different energetic demands [9] and different tissue structures [12] in various brain regions. Individual traits may also be responsible for the differences [1], with differences between the concentrations of different metabolites at a particular location in different subjects being lower than the differences between the concentrations of these metabolites in different regions of the brain of the same subject [9]. This should be kept in mind when conducting diagnostic measurements in children [13,19].
Conclusions
The obtained results may be used as reference values in future 1HMRS studies in children. The study shows that a child’s brain is inhomogeneous and that statistically significant differences in concentrations are observed for all metabolites across the brain regions. No significant differences between individual brain regions could be observed only in the case of Lip/Cr ratio and the ratio between Lip levels and the sum of concentrations of all metabolites.
The obtained results are in line with the earlier studies conducted in adult patients and emphasize the need for regional differences in metabolite concentrations being taken into account also when comparing 1HMRS examinations results in children.
References
- 1.Bracken BK, Jensen JE, Prescot AP, et al. Brain metabolite concentrations across cortical regions in healthy adults. Brain Res. 2001;1369:89–94. doi: 10.1016/j.brainres.2010.11.036. [DOI] [PMC free article] [PubMed] [Google Scholar]
- 2.Ortiz AE, Ortiz AG, Falcon C, et al. 1H-MRS of the anterior cingulate cortex in childhood and adolescent obsessive-compulsive disorder: A case-control study. Eur Neuropsychopharmacol. 2015;25(1):60–68. doi: 10.1016/j.euroneuro.2014.11.007. [DOI] [PubMed] [Google Scholar]
- 3.Gaetz W, Bloy L, Wang DJ, et al. GABA estimation in the brains of children on the autism spectrum: measurement precision and regional cortical variation. Neuroimage. 2014;86:1–9. doi: 10.1016/j.neuroimage.2013.05.068. [DOI] [PMC free article] [PubMed] [Google Scholar]
- 4.Harris JL, Yeh HW, Swerdlow RH, et al. High-field proton magnetic resonance spectroscopy reveals metabolic effects of normal brain aging. Neurobiol Aging. 2014;35(7):1686–94. doi: 10.1016/j.neurobiolaging.2014.01.018. [DOI] [PMC free article] [PubMed] [Google Scholar]
- 5.Weber AM, Soreni N, Stanley JA, et al. Proton magnetic resonance spectroscopy of prefrontal white matter in psychotropic naïve children and adolescents with obsessive-compulsive disorder. Psychiatry Res. 2014;222(1–2):67–74. doi: 10.1016/j.pscychresns.2014.02.004. [DOI] [PubMed] [Google Scholar]
- 6.ElBeheiry AA, Abougabala Am, Omar TI, et al. Role of brain magnetic resonance spectroscopy in the evaluation of suspected mitochondrial diseases in children: Experience in 30 pediatric cases. The Egyptian Journal of Radiology and Nuclear Medicine. 2014;45(2):523–33. [Google Scholar]
- 7.Donia MM, Abougabala AM, Zakariaa YM, Farhoudb AH. Role of proton magnetic resonance spectroscopy in diagnosis of pilocytic astrocytoma in children. Alexandria Journal of Medicine. 2012;48(2):131–37. [Google Scholar]
- 8.Haga KK, Khor YP, Farrall A, Wardlaw JM. A systematic review of brain metabolite changes, measured with 1H magnetic resonance spectroscopy, in healthy aging. Neurobiol Aging. 2009;30(3):353–63. doi: 10.1016/j.neurobiolaging.2007.07.005. [DOI] [PubMed] [Google Scholar]
- 9.Grachev ID, Apkarian AV. Chemical network of the living human brain: Evidence of reorganization with aging. Brain Res Cogn Brain Res. 2001;11(2):185–97. doi: 10.1016/s0926-6410(00)00068-9. [DOI] [PubMed] [Google Scholar]
- 10.Minati L, Aquino D, Bruzzone MG, Erbetta A. Quantitation of normal metabolite concentrations in six brain regions by in-vivo 1H-MR spectroscopy. J Med Phys. 2010;35(3):154–63. doi: 10.4103/0971-6203.62128. [DOI] [PMC free article] [PubMed] [Google Scholar]
- 11.Santos JMG, et al. [Regional effects of age and sex in magnetic resonance spectroscopy]. Radiologia. 2010;52(4):342–50. doi: 10.1016/j.rx.2010.04.005. [in Spanish] [DOI] [PubMed] [Google Scholar]
- 12.Zhang Y, Shen J. Regional and tissue-specific differences in brain glutamate concentration measured by in vivo single voxel MRS. J Neurosci Methods. 2015;239:94–99. doi: 10.1016/j.jneumeth.2014.09.021. [DOI] [PMC free article] [PubMed] [Google Scholar]
- 13.Frahm J, Hanefeld F. Magnetic resonance spectroscopy and imaging in neurochemistry. Springer; US: 1997. Localized proton magnetic resonance spectroscopy of brain disorders in childhood; pp. 329–402. [Google Scholar]
- 14.Harada M, Miyoshi H, Otsuka H, et al. Multivariate analysis of regional metabolic differences in normal ageing on localised quantitative proton MR spectroscopy. Neuroradiology. 2001;43(6):448–52. doi: 10.1007/s002340000513. [DOI] [PubMed] [Google Scholar]
- 15.Pouwels PJ, Brockmann K, Kruse B, et al. Regional age dependence of human brain metabolites from infancy to adulthood as detected by quantitative localized proton MRS. Pediatr Res. 1999;46(4):474–85. doi: 10.1203/00006450-199910000-00019. [DOI] [PubMed] [Google Scholar]
- 16.Angelie E, Bonmartin A, Boudraa A, et al. Regional differences and metabolic changes in normal aging of the human brain: proton MR spectroscopic imaging study. Am J Neuroradiol. 2001;22(1):119–27. [PMC free article] [PubMed] [Google Scholar]
- 17.Grachev ID, Apkarian AV. Chemical heterogeneity of the living human brain: A proton MR spectroscopy study on the effects of sex, age, and brain region. Neuroimage. 2000;11(5):554–63. doi: 10.1006/nimg.2000.0557. [DOI] [PubMed] [Google Scholar]
- 18.Sailasuta N, Ernst T, Chang L. Regional variations and the effects of age and gender on glutamate concentrations in the human brain. Magn Reson Imaging. 2008;26(5):667–75. doi: 10.1016/j.mri.2007.06.007. [DOI] [PMC free article] [PubMed] [Google Scholar]
- 19.Otsuka H, Harada M, Mori K, et al. Brain metabolites in the hippocampus-amygdala region and cerebellum in autism: an 1H-MR spectroscopy study. Neuroradiology. 1999;41(7):517–19. doi: 10.1007/s002340050795. [DOI] [PubMed] [Google Scholar]
- 20.Komoroski RA, Heimberg C, Cardwell D, Karson CN. Effects of gender and region on proton MRS of normal human brain. Magn Reson Imaging. 1999;17(3):427–33. doi: 10.1016/s0730-725x(98)00186-6. [DOI] [PubMed] [Google Scholar]
- 21.Jansen JF, Backes WH, Nicolay K, Kooi ME. 1H MR spectroscopy of the brain: Absolute quantification of metabolites. Radiology. 2006;240(2):318–32. doi: 10.1148/radiol.2402050314. [DOI] [PubMed] [Google Scholar]