

Abstract
Cancer stem cell (CSC) markers have been identified for CSC isolation and proposed as therapeutic targets in various types of cancers. CD90, one of the characterized markers in liver and gastric cancer, is shown to promote cancer formation. However, the underexpression level of CD90 in ovarian cancer cells and the evidence supporting the cellular mechanism have not been investigated. In the present study, we found that the DNA copy number of CD90 is correlated with mRNA expression in ovarian cancer tissue and the ovarian cancer patients with higher CD90 have good prognosis compared to the patients with lower CD90. Although the expression of CD90 in human ovarian cancer SKOV3 cells enhances the cell proliferation by MTT and anchorage-dependent growth assay, CD90 inhibits the anchorage-independent growth ability in vitro and tumor formation in vivo. CD90 overexpression suppresses the sphere-forming ability and ALDH activity and enhances the cell apoptosis, indicating that CD90 may reduce the cell growth by the properties of CSC and anoikis. Furthermore, CD90 reduces the expression of other CSC markers, including CD133 and CD24. The inhibition of CD133 is attenuated by the mutant CD90, which is replaced with RLE domain into RLD domain. Importantly, the CD90-regulated inhibition of CD133 expression, anchorage-independent growth and signal transduction of mTOR and AMPK are restored by the β3 integrin shRNA. Our results provide evidence that CD90 mediates the antitumor formation by interacting with β3 integrin, which provides new insight that can potentially be applied in the development of therapeutic strategies in ovarian cancer.
Keywords: cancer stem cell marker, integrin, CD133, AMPK, mTOR
Introduction
Ovarian cancer is one of the common gynecologic cancers. Several studies demonstrate that accumulation of genetic alteration causes aberrant gene expression and is associated with cancer progression (1). Genetic alteration contributes to the ovarian cancer progression and is associated with the ovarian cancer incidence (2,3). The alteration of tumor suppressor gene or oncogene, such as BRCA1 and NDN, was observed in ovarian cancer cells (4,5).
CD90, also called as Thy-1, is a glycoprotein and mediates the T cell activation and neurite growth (6,7). CD90 is enriched in activated endothelial cells and is attracted to melanoma cells by the integrin and syndecan (8–10). CD90 has been defined as a marker for cancer stem cell (CSC) in gastric, lung, esophageal and liver cancer. CD90+ gastric cancer stem cells possess the highest tumor initiation ability and inhibition of ERBB2 signaling by trastuzumab reducing tumorigenicity in vivo (11). Identification of lung cancer stem cell characterized by CD90 phenotype that contributes to the higher cell proliferation and stem cell marker Sox2 and Oct4 expression was demonstrated in A549 and H446 lung cancer cell lines (12). CD90-positive tumor-initiating cell population has aggressive tumor progression in esophageal cancer (13). The CD90+ cells isolated from liver cancer cell lines and clinical tumor samples are responsible for tumor formation (14). Compared to the CD90−CXCR4+ liver cancer cells, the CD90+CXCR4+ cells have higher stemness properties of sphere-forming ability and promote cancer metastasis (15). Additionally, the expression of stem cell markers, including CD133, CD90 and EpCAM, are increased in the hepatocellular carcinoma tissues with bile duct tumor thrombi compared to the tissues without bile duct tumor thrombi (16). In our previous study, CD90 was shown to play an oncogenic role in liver cancer progression via the signal axis of CD90-integrin-AMPK-CD133 and targeting CD90 and its downstream molecules may be employed as therapeutic targets (17). Notably, CD90 was decreased in nasopharyngeal carcinoma cell lines and metastatic tumor tissues. CD90 has been demonstrated to suppress myofibroblastic differentiation and the idiopathic pulmonary fibrosis tissue harbors the highly epigenetic changes of CD90 in fibroblastic foci (18). Furthermore, the expression of CD90 is not detected in ovarian cancer cells with tumorigenic ability and the introduction of CD90 into the tumorigenic clone reduces the tumor formation (19,20). However, the mechanism by which CD90 inhibits ovarian cancer cell growth is still largely unclear.
A previous study demonstrated that CD90 inhibits the growth of astrocytes, which provides nutrition and structural support to nerve cells. In contrast, CD90 does not affect the growth of Schwann cells, which is the component of myelin sheath (21). These data indicate that bidirectional signal transduction attributes to the interaction between neuron and microglia. Integrin family plays important roles in functions and signals of CD90 in various cells. CD90 interacts with β3 or αvβ3 integrin, thereby regulating the signaling transduction in astrocyte and neuronal cells. The trans interaction between CD90 on neuronal cells and integrin on astrocyte contributes to cell adhesion (22). The CAD neuron-like cell co-incubated with integrin αvβ3-Fc fusion protein has reduced neurite extension and the αvβ3 integrin-derived growth inhibition is triggered by the interaction between CD90 and Src (23). The cis interaction between CD90 and αvβ5 integrin are reported to prevent the activation of TGF-β1 and myofibro-blast differentiation (24), which in turn, is a promoter of cancer formation. Our previous study indicates that there is a cis interaction between CD90 and β3 integrin in liver cancer and the cis interaction between these two molecules is required for the CD90-induced CD133 upregulation. Although CD90 has been demonstrated to play a potential tumor suppressor role in ovarian cancer, the mechanism by which CD90 inhibits ovarian cancer cell growth is unclear. The present study aimed to determine the relationship between integrin and CD90 in ovarian cancer cells and determine whether CD90 plays a tumor suppressor role in ovarian cancer cells via β3 integrin.
Our analyses from online database reveal that CD90 is downregulated in ovarian cancer tissues and the gene copy number of CD90 is correlated with the mRNA expression. Overexpression of CD90 decreases the anchorage-independent growth in vitro and tumor formation in vivo. The expression of CD90 promotes anoikis and inhibits stemness properties. Furthermore, CD90 reduces the CD133 expression, and the reduction of CD133 and anchorage-independent growth ability are rescued by the β3 integrin shRNA.
Materials and methods
Cell culture
The SKOV3 cells and stable transfectants expressing wild-type or mutant CD90 were maintained in Dulbecco's minimum essential medium (DMEM; HyClone Laboratories, Logan, UT, USA) consisting of 10% fetal bovine serum (FBS), 100 units/ml penicillin and 100 μg/ml streptomycin (Invitrogen, Carlsbad, CA, USA) at 37°C in 5% CO2.
Oncomine database analysis
The mRNA expression of CD90 in ovarian cancer was identified from Oncomine database as the criteria of P-value <1E-4, fold change >3, and gene ranking in the top 10% (https://www.oncomine.org/resource/login.html) (25,26). The CD90 mRNA expression was identified from Yoshihara ovarian dataset.
Kaplan-Meier plotter database analysis
The correlation between CD90 expression and post-progression survival in ovarian cancer was analyzed by Kaplan-Meier plotter database (http://kmplot.com/analysis/) (27). The hazard ratio with 95% confidence intervals and log-rank P-value was also computed.
cBioPortal database analysis
The correlation between DNA copy number and mRNA expression of CD90 in ovarian cancer is identified by cBioPortal database (http://www.cbio-portal.org/) (28,29).
Establishment of CD90 transfectants
SKOV3 cells were transfected with CD90 expression vector using TurboFect (Thermo Fisher Scientific, Waltham, MA, USA) according to the manufacturer's instruction and the resistant transfected cells were selected with G418 at the concentration of 1 mg/ml. The expression of CD90 in SKOV3 stable transfectants was determined by RT-PCR and flow cytometry.
Flow cytometry
The trypsinized transfectants were incubated with anti-CD90-PE antibody (eBioscience, Inc., San Diego, CA, USA) on ice for 20 min and are resuspended in phosphate-buffered saline containing 1% BSA and 200 nM EDTA. The cells were analyzed using a FACSCalibur (BD Biosciences, San Jose, CA, USA).
MTT assay
The cell proliferation of the transfectants was analyzed by MTT assay. The cells were seeded into the 24-well plates at the density of 2×10⁴/well. The MTT reagent was incubated for 4 h and the cell viability was determined at the absorption wavelength of 590 nm.
Colony formation assay
Colony formation was performed by seeding cells at concentrations of 5×10²/well in 6-well plates. The colonies were stained with 2% methylene blue and counted after incubation for 10 days.
Soft agar assay
The anchorage-independent growth ability of the transfectants was analyzed by soft agar colony assay. Five thousand cells were prepared in 1 ml of 0.3% agar in DMEM supplemented with 10% FBS and layered onto 1.5 ml 0.6% agar in DMEM containing 10% FBS. The colonies were incubated for 3 weeks and stained with 0.2% crystal violet.
Tumorigenicity in NOD/SCID mice
The NOD/SCID mice were obtained from the Animal Center of the National Cheng Kung University (Tainan, Taiwan) and the experiments were approved by the Institutional Animal Care and Use Committee of NCKU. The stable transfectants were injected subcutaneously into NOD/SCID mice at the density of 1×10⁷.
Anoikis assay
Anoikis was analyzed by plating the cells at the density of 5×10⁵ into the polyhema-coated dish for 24 h. The cells were harvested and the apoptosis was confirmed by Annexin V and PI staining according to the manufacturer's instruction.
Western blot analysis
Antibodies against CD133 (Abcam, Cambridge, UK), CD44 (Abcam), EpCAM (Santa Cruz Biotechnology, Santa Cruz, CA, USA), mTOR (Epitomics, Burlingame, CA, USA), CD24 (Epitomics), CD13 (Epitomics), PARP (Cell Signaling Technology, Beverly, MA, USA), phosphor-AMPK (Cell Signaling Technology), AMPK (Cell Signaling Technology) and β-actin (Chemicon, Inc., Pittsburgh, PA, USA) were used in western blotting. Cell extracts were harvested in RIPA lysis buffer and the protein concentration was determined with Micro BCA™ protein assay kit (Millipore, Billerica, MA, USA). Protein extracts (35 μg) were fractionated by SDS-PAGE and transferred to polyvinylidene fluoride membranes (Amersham Biosciences, Piscataway, NJ, USA) using a transfer apparatus according to the manufacturer's instruction (Hoefer Pharmacia Biotech, San Francisco, CA, USA). After incubation with 5% non-fat milk, the membranes were incubated with specific primary antibody and horseradish peroxidase-conjugated secondary antibody. The membranes were then probed with ECL western blotting detection system (Millipore) and visualized with the BioSpectrum AC imaging system.
Sphere formation assay
The 5×10³ transfectants were plated in the ultra-low attachment plates (Corning Incorporated, Corning, NY, USA) in DMEM consisting 50 ng/ml HGF, 50 ng/ml EGF, 1% bovine serum albumin and 1% FBS. The cells were incubated for 14 days and then were counted under light microscope.
ALDH assay
ALDH activity was performed with the Aldefluor® kit (StemCell Technologies, Durham, NC, USA) according to the manufacturer's instructions. The cells were suspended in the Aldefluor assay buffer containing ALDH substrate, with or without the ALDH inhibitor (diethylami-nobenzaldehyde, DEAB), and were followed by incubation at 37°C for 30 min. The ALDH activity was detected with the FACSCalibur.
Quantitative real-time reverse transcription-PCR
Total RNA was extracted with TRIzol (MDBio, Taipei, Taiwan) and the cDNA was synthesized using M-MLV transcriptase (Promega, Madison, MI, USA) according to the manufacturer's instruction. The real-time PCR was performed using KAPA™ Probe Fast qPCR kit (Kapa Biosystems, Wilmington, MA, USA) on an Applied Biosystems StepOnePlus™ Real-Time PCR systems. The CD133 primers were 5′-aaggcatatgaatccaa aattga-3′ (sense) and 5′-ccaccagaggcatcagaataa-3′ (antisense); the CD24 primers were 5′-atgggcagagcaatggtg-3′ (sense) and 5′-tggaataaatctgcgtgggta-3′ (antisense); the EpCAM primers were 5′-agttggtgcacaaaatactgtcat-3′ (sense) and 5′-ctcccaagtt ttgagccatt-3′ (antisense); the CD13 primers were 5′-catccatcag a gatggcagac-3′ (sense) and 5′-tgctgaagagatcgttctgg-3′ (anti-sense); the HPRT primers were 5′-tgatagatccattcctatgactgt aga-3′ (sense) and 5′-caagacattctttccagttaaagttg-3′ (antisense). The reactions were incubated at 95°C for 10 min, followed by 40 cycles of denaturation at 95°C for 15 sec and annealing and extension at 60°C for 1 min.
β3 integrin-specific inhibition by shRNA
The shRNA was obtained from the National RNAi Core Facility (Academia Sinica, Taipei, Taiwan). The β3 integrin shRNA targeting sequences is GATGCAGTGAATTGTACCTAT. The production of lentiviral particles containing β3 integrin shRNA was conducted according to the protocol provided from the National RNAi Core Facility.
Tissue array staining
Formalin-fixed, paraffin-embedded ovarian tumor tissue array was purchased from Super BioChips (Seoul, Korea). The tissue array was deparaffinized with xylene and rehydrated in grade ethanol, and the antigen retrieval was performed by autoclaving in target retrieval buffer (Dako, Carpinteria, CA, USA). Immunohistochemical staining was performed using a monoclonal rabbit anti-CD90 antibody (clone EPR3133; Abcam) and a monoclonal mouse anti-integrin β3 antibody (Clone SAP; Millipore). The color was developed with 3-amino-9-ethylcarbazole (Dako). The sections were subsequently counterstained with the Mayer's hematoxylin. The lesions were assessed by a medical doctor (H.P.H.).
Statistical analysis
The statistical analyses were performed using GraphPad Prism version 4 (GraphPad Software, Inc., La Jolla, CA, USA). The analysis was performed using unpaired t-test, one-way ANOVA analysis and two-way ANOVA analysis, respectively and the data are reported as mean ± standard deviation.
Results
CD90 is underexpressed in ovarian cancer tissues
In order to elucidate the CD90 expression in physiological situation, the CD90 expression in ovarian tumor tissues was analyzed using Oncomine database. Oncomine database analysis of ovarican cancer tissue vs. normal tissue showed that CD90 was significantly decreased in tumor tissues (Fig. 1A). The prognostic value of CD90 in ovarian cancer was analyzed using Kaplan-Meier plotter and revealed that low level of CD90 was correlated with poor survival rate (Fig. 1B). The gene copy number is important for several biological processes in normal cells and the alterations of gene copy number are associated with cancer initiation (30). We therefore studied whether the variations of gene copy number are involved in altered mRNA expression levels in ovarian cancer. The analysis from cBio-Portal database showed that the increase of DNA copy number from deletion, diploid, to amplification causes the increase in mRNA expression, indicating that DNA copy number is correlated with the mRNA expression (Fig. 1C).
Figure 1.
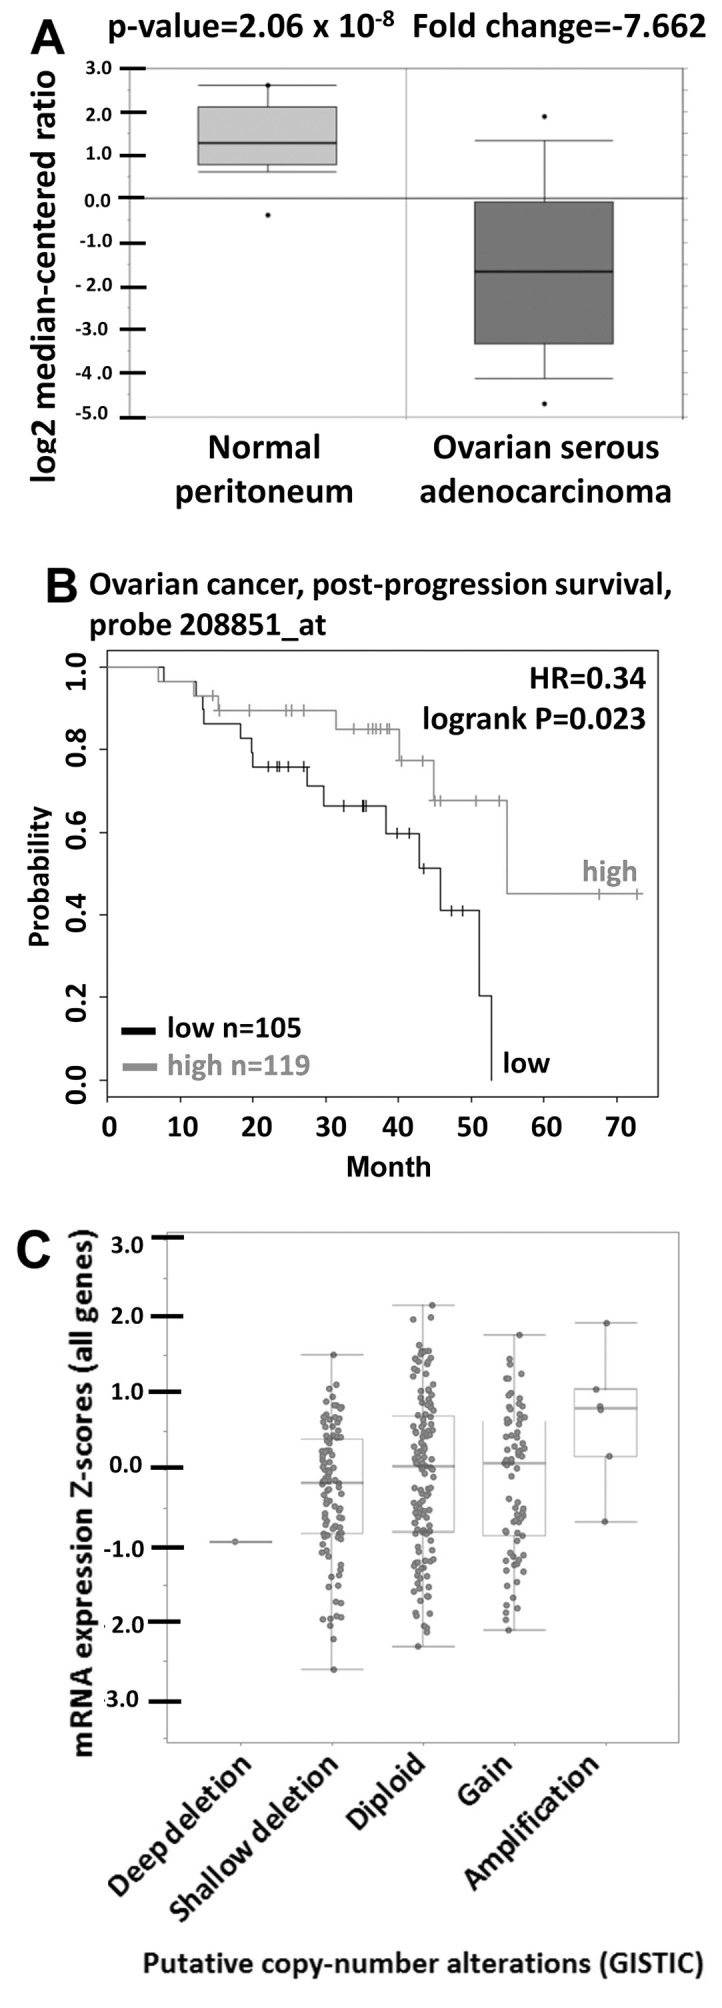
CD90 is underexpressed in ovarian cancer. (A) CD90 mRNA expression in ovarian cancer tissue was obtained from the Oncomine database. The box plot represents the CD90 expression in ovarian cancer and normal tissues. (B) The survival rate was identified from 224 patients with the optimal cut-off of 119 as high expression and 105 as low expression groups from Kaplan-Meier plotter database. (C) The correlation between gene copy number and mRNA expression of CD90 in ovarian cancer was identified from cBioPortal database.
CD90 inhibits tumorigenicity in SKOV3 cells
To study whether the CD90 affected ovarian cancer cell growth, SKOV3 cells were transfected with a plasmid encoding CD90. Ectopic expression of CD90 mRNA was analyzed by RT-PCR analysis, and the surface expression of CD90 was detected by flow cytometry (Fig. 2A and B). Ectopic expression of CD90 promoted the cell proliferation by MTT and colony formation assay (Fig. 2C and D), but decreased anchorage-independent growth in vitro and tumor formation in vivo (Fig. 2E and F).
Figure 2.

CD90 inhibits tumor formation in ovarian cancer cells. The expression of CD90 in the SKOV3 transfectants was determined by (A) RT-PCR and (B) flow cytometric analyses. (C) The cell proliferation was measured by MTT in the indicated time. P-value was calculated using two-way ANOVA analysis (*P<0.05). (D) The anchorage-dependent growth was assessed by colony formation assay after inoculation for 10 days. P-value was calculated using one-way ANOVA analysis (*P<0.05). (E) The anchorage-independent growth was determined by soft agar assay and the colonies were quantified using Image-Pro Plus software after 3 weeks of incubation. P-value was calculated using one-way ANOVA analysis (*P<0.05). (F) The stable SKOV3 transfectants were transplanted subcutaneously into NOD/SCID mice, and the tumor growth curves were monitored for 7 weeks. P-value was calculated using two-way ANOVA analysis (*P<0.0001).
CD90 promotes anoikis and reduces sphere-forming ability
Since the effect of CD90 on anchorage-dependent growth in vitro was not correlated with the tumor growth in vivo, we investigated whether CD90 affected anoikis, which is closely related with the anchorage-independent growth. Expression of exogenous CD90 promoted cell apoptosis when SKOV3 cells were cultured on poly-HEMA-coated dish (Fig. 3A). CD90 transfectants displayed higher level of cleaved poly(ADP-ribose) polymerase (cleaved PARP), which indicates caspase-dependent activation (Fig. 3B). In addition, expression of CD90 decreased the sphere formation in ultra-low attachment culture dishes and aldehyde dehydrogenase activity, which characterize the subpopulation of cells with CSC properties (Fig. 4A and B). These data indicate that the inhibition of tumor growth is correlated with the alteration of characteristics of CSC.
Figure 3.

CD90 enhances anoikis in ovarian cancer. The transfectants were seeded on the poly-HEMA-coated dishes for 24 h. (A) The early apoptotic cells were identified as Annexin V-positive and PI-negative population by flow cytometry. (B) The cell lysate was harvested and subjected to SDS-PAGE. The apoptotic markers, PARP and cleaved-PARP, were recognized with the specific antibodies by western blotting assay. P-value was calculated using one-way ANOVA analysis (*P<0.05).
Figure 4.

CD90 inhibits the properties of cancer stem cells and the expression of cancer stem cell markers. (A) The transfectants were plated on ultra-low attachment plates at a density of 1×10³. The mammospheres >50 μm in size were counted at 14 days. (B) The transfectants were incubated with fluorescent ALDH substrate Aldefluor and assessed by flow cytometry. The data are expressed as mean fluorescence intensity of Aldefluor in the absence of ALDH inhibitor (DEAB) minus that in the presence of ALDH inhibitor. P-value was calculated using unpaired t-test (*P<0.01). (C) The mRNA expression of CD133, CD44, CD24, EpCAM and CD13 in the transfectants was measured by quantitative RT-PCR and normalized to HPRT. P-value was calculated using one-way ANOVA analysis (*P<0.05). (D) The protein lysate was harvested and the expression of CD133, CD44, EpCAM, CD24 and CD13 was probed with the specific antibodies by western blotting assay. (E) The protein lysate was harvested and the expression of mTOR and AMPK was probed with the specific antibodies by western blotting assay.
CD90 decreases the expression of stem cell markers CD133 and CD24
Since CSC markers were used to identify CSCs, we then investigated whether ectopic expression of CD90 influences the expression of other CSC markers. The expression of CD133 and CD24 was decreased in the SKOV3 CD90 transfectant (Fig. 4C). There was no statistically significant difference in CD44, EpCAM and CD13 expression between SKOV3 CD90 transfectant and the parental cell line SKOV3 (Fig. 4C). The inhibition of CD133 expression was further confirmed by western blotting (Fig. 4D). Our previous study reported that CD90 promoted CD133 expression through the elevated mTOR phosphorylation and decreased AMPK phosphorylation in liver cancer (17). Next we studied whether the mTOR and AMPK were involved in the inhibition of CD133 by ectopic expression of CD90 in ovarian cancer. SKOV3 CD90 transfectants had lower levels of mTOR phosphorylation and higher levels of AMPK phosphorylation (Fig. 4E).
The CD90 RLD domain affects anchorage-independent growth and CD133 expression
Given that CD90 has been shown to promote liver cancer progression through interaction with β3 integrin with its RLD sequence, we sought to determine whether the RLD domain of CD90 mediated the signal transduction in regulating CD133 expression in ovarian cancer. The RLD residue of CD90 was replaced with RLE, and the mutant CD90 was delivered into SKOV3 cells. The mutant CD90 did not inhibit anchorage-independent growth (Fig. 5A). The inhibition of CD133 mRNA by CD90 was rescued by the mutant CD90 (Fig. 5B). Besides, the alteration of AMPK and mTOR phosphorylation was attenuated in SKOV3 transfectant expressing mutant CD90 (Fig. 5C).
Figure 5.

The RLD domain of CD90 is required for the inhibition of CD133 expression and anchorage-independent growth. (A) The anchorage-independent growth of the transfectants expressing wild-type CD90 (RLD) and mutant CD90 (RLE) was determined by soft agar assay and the colonies were quantified using Image-Pro Plus software after 3 weeks of incubation. (B) The mRNA expression of CD133 in the transfectants expressing wild-type CD90 (RLD) and mutant CD90 (RLE) was measured by quantitative RT-PCR and normalized to HPRT. (C) The protein lysate was harvested and the phosphorylation of mTOR and AMPK in the transfectants expressing wild-type CD90 (RLD) and mutant CD90 (RLE) was probed with the specific antibodies by western blotting assay. P-values were calculated using one-way ANOVA analysis (*P<0.05).
Silencing of β3 integrin increases anchorage-independent growth and CD133 expression
Given the effect of the RLD domain of CD90 in mediating CD133 inhibition, we next determined whether CD90 regulated its effects through β3 integrin in SKOV3 cells. The β3 integrin shRNA was delivered to SKOV3 CD90 transfectants and the knockdown efficacy was determined by quantitative RT-PCR (Fig. 6A). The anchorage-independent growth ability and CD133 mRNA expression was increased by β3 integrin shRNA (Fig. 6B and C). CD90-induced phosphorylation of mTOR and AMPK were attenuated after silencing β3 integrin expression (Fig. 6D). In addition, β3 integrin shRNA did not alter the CD90 expression in either SKOV3 stable CD90 transfectants or SKOV3 cells transiently transfected with CD90 by flow cytometric analysis (Fig. 6E). To further verify the physiological role of CD90 and β3 integrin on tumor cells, we exploited the tissue array to analyze the CD90 and β3 integrin expression by immunohistochemistry and found that both expression of CD90 and β3 integrin were observed in tumor tissues (Fig. 6F), indicating the physiological interaction between CD90 and β3 integrin on tumor cells.
Figure 6.

A decrease of β3 integrin attenuates the inhibition of CD133 expression and anchorage-independent growth by CD90. The SKOV3 transfectants expressing exogenous CD90 were infected with lentiviral particles containing β3 integrin or luciferase shRNA. (A) The mRNA expression of β3 integrin in the transfectants was measured by quantitative RT-PCR and normalized to HPRT. (B) The anchorage-independent growth of the transfectants was determined by soft agar assay and the colonies were quantified using Image-Pro Plus software after 3 weeks of incubation. (C) The mRNA expression of CD133 in the transfectants was measured by quantitative RT-PCR and normalized to HPRT. (D) The protein lysate was harvested and the phosphorylation of mTOR and AMPK in the transfectants was probed with the specific antibodies by western blotting assay. (E) CD90 expression was determined by flow cytometry in the stable SKOV3 transfectants expressing exogenous CD90 (right panel) and transiently transfected CD90 SKOV3 cells (left panel) with β3 integrin or luciferase shRNA infection. (F) CD90 and β3 integrin immunostaining in ovarian cancer tissue were shown at ×20 original magnification. P-values were calculated using unpaired t-test (*P<0.01).
Discussion
In the present study, we demonstrated that CD90 is decreased in ovarian cancer tissue and the lower expression level of CD90 predicts poor prognosis. CD90 functions as a tumor suppressor gene in ovarian cancer and growth inhibition is associated with the characteristic of anoikis and stemness properties, including sphere-forming ability and ALDH activity. We found decreased expression of CD133 in the CD90 transfectants compared to the parental SKOV3 cells. Signaling analyses reveal that AMPK and mTOR are correlated with the inhibition of CD133. Furthermore, the mutant CD90 attenuates the signaling transduction of AMPK/mTOR, CD133 expression and the anchorage-independent growth ability. The inhibition of CD133 expression and anchorage-independent growth by CD90 is restored by β3 integrin shRNA.
In the present study, we examined the effect of β3 integrin shRNA on anchorage-independent growth, CD133 expression and mTOR/AMPK signal molecules in the transfectant expressing ectopic CD90 (Fig. 6B–D), and found that β3 integrin shRNA attenuated CD90-induced phenomena, indicating that β3 integrin is associated with CD90-mediated phenotype alteration. Previous study showed that β3 integrin downregulates SKOV3 cell growth (31), indicating that β3 integrin may restore the anchorage-independent growth in ovarian cancer cells in a CD90-independent manner. Nevertheless, mutation of the β3 integrin binding domain in CD90 significantly attenuated its ability on CD133 expression and anchorage-independent growth (Fig. 5). Furthermore, β3 integrin shRNA did not alter CD90 expression in either SKOV3 stable CD90 transfectants or SKOV3 cells transiently transfected with CD90 (Fig. 6E). Altogether, the inhibitory effect of CD90 on CD133 expression and anchorage-independent growth may be regulated directly through the activation of β3 integrin.
In this study, we clarified the role of CD90 in SKOV3 cell line, which is an adenocarcinoma ovarian cancer cell. Serous adenocarcinoma is the common type of ovarian cancer and the high-grade serous adenocarcinoma arises from elsewhere in the peritoneal cavity. In addition, we identified CD90 expression from microarray datasets in Oncomine database as the criteria of P-value <1E-4, fold change >3, and gene ranking in the top 10% in Gene Summary View and only one dataset from Yoshihara was identified. Therefore, we identified the CD90 expression from this dataset comparing the normal peritoneum and ovarian serous adenocarcinoma in Fig. 1A. We further checked the other six datasets under the criteria of P<0.05 and found that CD90 was increased in different types of cancer tissues, including carcinoma, papillary carcinoma, cystadenocarcinoma, clear cell adenocarcinoma and serous adenocarcinoma (Table I), indicating that CD90 expression has tissue-specific expression pattern. It is interesting to note that the expression of CD90 in serous adenocarcinoma was decreased in Yoshihara's dataset, but increased in Adib's and Hendrix's datasets. The clinical cancer tissues from Adib's dataset were identified from College Hospitals NHS Trust located in UK. The samples from Hendrix's dataset were derived from the University of Michigan Health System and the Johns Hopkins Hospital located in USA. By contrast, Yoshihara obtained the clinical tissues from the Department of Obstetrics and Gynecology of Niigata University located in Japan. A previous study showed that Asian ovarian cancer patient has good disease-specific survival compared to Caucasian ovarian cancer patient, and the disease-specific survival of Asian immigrants was higher than U.S born Asians (32), indicating the important effect of genetic and environmental factors on tumor development.
Table I.
CD90 expression in ovarian cancer from Oncomine database.
| Dataset | Cancer subtype | Fold change | P-value | Gene rank (Top %) |
|---|---|---|---|---|
| Yoshihara | Peritoneum vs. ovarian serous adenocarcinoma | −7.662 | 2.06E-08 | 7 |
| Hendrix | Ovary vs. ovarian serous adenocarcinoma | 1.265 | 0.015 | 29 |
| Adib | Ovary vs. ovarian serous adenocarcinoma | 1.539 | 0.014 | 10 |
| Bonome | Ovarian surface epithelium vs. ovarian carcinoma | 2.608 | 4.78E-09 | 7 |
| Welsh | Ovary vs. ovarian serous surface papillary carcinoma | 2.026 | 0.016 | 32 |
| TCGA | Ovary vs. ovarian serous cystadenocarcinoma | 2.615 | 0.005 | 31 |
| Lu | Ovarian surface epithelium vs. ovarian clear cell adenocarcinoma | 1.546 | 0.033 | 18 |
Oncomine database indicated that CD90 expression is increased in liver cancer, but decreased in ovarian cancer tissue as the criteria of P-value <1E-4, fold change >3, and gene ranking in the top 10% in Gene Summary View. The differential CD90 expression between liver and ovarian cancer tissues is in accordance with the finding that oncogenic role of CD90 in liver cancer in our previous study and the tumor suppressor role of CD90 in ovarian cancer in the present study. In addition, the results of this study describing the effects of CD90 on CD133 expression and mTOR and AMPK phosphorylation in ovarian cancer are opposite to the results of our previous study in liver cancer (17). These data indicate that CD90 play different roles in different cancers.
Integrin functions as heterodimer and is generated from at least 18 α and 8 β subunits to form 24 distinct receptors. The distinct integrin heterodimer binds to different extra-cellular matrix components to regulate diverse biological responses (33). Integrin mediates the signal transduction during carcinogenesis and it has multiple functions to regulate cancer progression within different tumors. The expression of αvβ3 and αvβ5 integrin is highly expressed in breast cancer and is associated with the increased tumor size and bone metastasis (34,35). In contrast, the α2β1 integrin is decreased in the breast cancer tissue and the restoration of α2β1 integrin inhibits the tumorigenic ability (36). The overexpression of β3 integrin decreases the tumor weight and metastasis in ovarian cancer cells (31), and the expression of β3 integrin is associated with the good prognosis in ovarian cancer (37). Integrin has been demonstrated to correlate with the cancer stem cell growth and the α6 integrin is co-expressed with conventional CSC markers in glioblastoma stem cells (38,39). The α1 and β5 integrin promote CD133+ prostate cancer stem cell (PCSC) differentiation (40). These studies suggest that CD90 may play a tumor suppressor role in ovarian cancer at least in part mediated via β3 integrin.
Tumor suppressor gene is functional for growth inhibition. It is interesting to note that CD90 inhibited the tumorigenic ability in vitro and in vivo, but increased the cell proliferation in SKOV3 cells. We further found that CD90 decreased the stemness properties of ALDH activity and sphere formation ability, indicating that CD90 is critical for the characteristics of stem cells. Previous studies show that the balance between proliferation and quiescence regulation is important for stem cells, and mesenchymal stem cell decreases the proliferation for the long-term self-renewal preservation (41,42). Horsley et al (43) found that NFATc1 contributes to the balance between quiescence and proliferation of skin stem cells and regulates the quiescence stage by repressing CDK4 expression. In addition, the cancer stem-like cells are thought to have the slow-cycling phenotype (44). Consequently, we propose that CD90-mediated proliferation may occur through the alteration of CSC property. Previous studies have demonstrated that mTOR signal pathway is involved in cancer stem cell growth and targeting mTOR by inhibitor can be used as cancer therapy (45,46). AMPK, which is a downstream signal molecule of mTOR, has been demonstrated to regulate drug resistance and cancer stem cell growth (47). In our previous study, CD90 promoted CD133 expression through the signal axis of mTOR and AMPK, thereby inducing liver tumor formation (17). Therefore, we suggest that CD90 triggered the same signal axis, but activated the opposite phosphorylation of mTOR and AMPK for liver and ovarian cancer development.
In conclusion, CD90 is underexpressed in ovarian cancer and CD90 overexpression decreases tumor growth via β3 integrin. The β3 integrin suppression by shRNA is able to restore the CD90-regulated tumor inhibition. The present study provides new insight into the contribution of CD90 in ovarian cancer, implying the application of therapy in the future.
References
- 1.Sadikovic B, Al-Romaih K, Squire JA, Zielenska M. Cause and consequences of genetic and epigenetic alterations in human cancer. Curr Genomics. 2008;9:394–408. doi: 10.2174/138920208785699580. [DOI] [PMC free article] [PubMed] [Google Scholar]
- 2.Claus EB, Risch N, Thompson WD. Genetic analysis of breast cancer in the cancer and steroid hormone study. Am J Hum Genet. 1991;48:232–242. [PMC free article] [PubMed] [Google Scholar]
- 3.Easton DF, Bishop DT, Ford D, Crockford GP The Breast Cancer Linkage Consortium. Genetic linkage analysis in familial breast and ovarian cancer: Results from 214 families. Am J Hum Genet. 1993;52:678–701. [PMC free article] [PubMed] [Google Scholar]
- 4.Welcsh PL, King MC. BRCA1 and BRCA2 and the genetics of breast and ovarian cancer. Hum Mol Genet. 2001;10:705–713. doi: 10.1093/hmg/10.7.705. [DOI] [PubMed] [Google Scholar]
- 5.Yang H, Das P, Yu Y, Mao W, Wang Y, Baggerly K, Wang Y, Marquez RT, Bedi A, Liu J, et al. NDN is an imprinted tumor suppressor gene that is downregulated in ovarian cancers through genetic and epigenetic mechanisms. Oncotarget. 2016;7:3018–3032. doi: 10.18632/oncotarget.6576. [DOI] [PMC free article] [PubMed] [Google Scholar]
- 6.Bellio M, Leal LM, Scharfstein J, Dos Reis GA. Interactions between CD3 and Thy1 T cell activation pathways: Blockade of CD3-mediated T lymphocyte activation induced by immobilized anti-Thy1 antibodies. Cell Immunol. 1991;135:534–540. doi: 10.1016/0008-8749(91)90296-N. [DOI] [PubMed] [Google Scholar]
- 7.Avalos AM, Valdivia AD, Muñoz N, Herrera-Molina R, Tapia JC, Lavandero S, Chiong M, Burridge K, Schneider P, Quest AF, et al. Neuronal Thy-1 induces astrocyte adhesion by engaging syndecan-4 in a cooperative interaction with alphav-beta3 integrin that activates PKCalpha and RhoA. J Cell Sci. 2009;122:3462–3471. doi: 10.1242/jcs.034827. [DOI] [PMC free article] [PubMed] [Google Scholar]
- 8.Schubert K, Gutknecht D, Köberle M, Anderegg U, Saalbach A. Melanoma cells use Thy-1 (CD90) on endothelial cells for metastasis formation. Am J Pathol. 2013;182:266–276. doi: 10.1016/j.ajpath.2012.10.003. [DOI] [PubMed] [Google Scholar]
- 9.Fiore VF, Ju L, Chen Y, Zhu C, Barker TH. Dynamic catch of a Thy-1-α5β1+syndecan-4 trimolecular complex. Nat Commun. 2014;5:4886. doi: 10.1038/ncomms5886. [DOI] [PubMed] [Google Scholar]
- 10.Kong M, Muñoz N, Valdivia A, Alvarez A, Herrera-Molina R, Cárdenas A, Schneider P, Burridge K, Quest AF, Leyton L. Thy-1-mediated cell-cell contact induces astrocyte migration through the engagement of αVβ3 integrin and syndecan-4. Biochim Biophys Acta. 2013;1833:1409–1420. doi: 10.1016/j.bbamcr.2013.02.013. [DOI] [PMC free article] [PubMed] [Google Scholar]
- 11.Jiang J, Zhang Y, Chuai S, Wang Z, Zheng D, Xu F, Zhang Y, Li C, Liang Y, Chen Z. Trastuzumab (herceptin) targets gastric cancer stem cells characterized by CD90 phenotype. Oncogene. 2012;31:671–682. doi: 10.1038/onc.2011.282. [DOI] [PubMed] [Google Scholar]
- 12.Yan X, Luo H, Zhou X, Zhu B, Wang Y, Bian X. Identification of CD90 as a marker for lung cancer stem cells in A549 and H446 cell lines. Oncol Rep. 2013;30:2733–2740. doi: 10.3892/or.2013.2784. [DOI] [PubMed] [Google Scholar]
- 13.Tang KH, Dai YD, Tong M, Chan YP, Kwan PS, Fu L, Qin YR, Tsao SW, Lung HL, Lung ML, et al. A CD90+ tumor-initiating cell population with an aggressive signature and metastatic capacity in esophageal cancer. Cancer Res. 2013;73:2322–2332. doi: 10.1158/0008-5472.CAN-12-2991. [DOI] [PubMed] [Google Scholar]
- 14.Yang ZF, Ho DW, Ng MN, Lau CK, Yu WC, Ngai P, Chu PW, Lam CT, Poon RT, Fan ST. Significance of CD90+ cancer stem cells in human liver cancer. Cancer Cell. 2008;13:153–166. doi: 10.1016/j.ccr.2008.01.013. [DOI] [PubMed] [Google Scholar]
- 15.Zhu L, Zhang W, Wang J, Liu R. Evidence of CD90+CXCR4+ cells as circulating tumor stem cells in hepatocellular carcinoma. Tumour Biol. 2015;36:5353–5360. doi: 10.1007/s13277-015-3196-6. [DOI] [PubMed] [Google Scholar]
- 16.Pang YB, Zhong JH, Luo XL, Ou C, Guo Z, Xiang BD, Peng NF, Li LQ. Clinicopathological characteristics and liver stem cell marker expression in hepatocellular carcinoma involving bile duct tumor thrombi. Tumour Biol. 2015;37:5879–5884. doi: 10.1007/s13277-015-4446-3. [DOI] [PubMed] [Google Scholar]
- 17.Chen WC, Chang YS, Hsu HP, Yen MC, Huang HL, Cho CY, Wang CY, Weng TY, Lai PT, Chen CS, et al. Therapeutics targeting CD90-integrin-AMPK-CD133 signal axis in liver cancer. Oncotarget. 2015;6:42923–42937. doi: 10.18632/oncotarget.5976. [DOI] [PMC free article] [PubMed] [Google Scholar]
- 18.Lung HL, Bangarusamy DK, Xie D, Cheung AK, Cheng Y, Kumaran MK, Miller L, Liu ET, Guan XY, Sham JS, et al. THY1 is a candidate tumour suppressor gene with decreased expression in metastatic nasopharyngeal carcinoma. Oncogene. 2005;24:6525–6532. doi: 10.1038/sj.onc.1208812. [DOI] [PubMed] [Google Scholar]
- 19.Abeysinghe HR, Pollock SJ, Guckert NL, Veyberman Y, Keng P, Halterman M, Federoff HJ, Rosenblatt JP, Wang N. The role of the THY1 gene in human ovarian cancer suppression based on transfection studies. Cancer Genet Cytogenet. 2004;149:1–10. doi: 10.1016/S0165-4608(03)00234-6. [DOI] [PubMed] [Google Scholar]
- 20.Abeysinghe HR, Cao Q, Xu J, Pollock S, Veyberman Y, Guckert NL, Keng P, Wang N. THY1 expression is associated with tumor suppression of human ovarian cancer. Cancer Genet Cytogenet. 2003;143:125–132. doi: 10.1016/S0165-4608(02)00855-5. [DOI] [PubMed] [Google Scholar]
- 21.Tiveron MC, Barboni E, Pliego Rivero FB, Gormley AM, Seeley PJ, Grosveld F, Morris R. Selective inhibition of neurite outgrowth on mature astrocytes by Thy-1 glycoprotein. Nature. 1992;355:745–748. doi: 10.1038/355745a0. [DOI] [PubMed] [Google Scholar]
- 22.Hermosilla T, Muñoz D, Herrera-Molina R, Valdivia A, Muñoz N, Nham SU, Schneider P, Burridge K, Quest AF, Leyton L. Direct Thy-1/alphaVbeta3 integrin interaction mediates neuron to astrocyte communication. Biochim Biophys Acta. 2008;1783:1111–1120. doi: 10.1016/j.bbamcr.2008.01.034. [DOI] [PMC free article] [PubMed] [Google Scholar]
- 23.Herrera-Molina R, Frischknecht R, Maldonado H, Seidenbecher CI, Gundelfinger ED, Hetz C, Aylwin ML, Schneider P, Quest AF, Leyton L. Astrocytic αVβ3 integrin inhibits neurite outgrowth and promotes retraction of neuronal processes by clustering Thy-1. PLoS One. 2012;7:e34295. doi: 10.1371/journal.pone.0034295. [DOI] [PMC free article] [PubMed] [Google Scholar]
- 24.Zhou Y, Hagood JS, Lu B, Merryman WD, Murphy-Ullrich JE. Thy-1-integrin alphav beta5 interactions inhibit lung fibroblast contraction-induced latent transforming growth factor-beta1 activation and myofibroblast differentiation. J Biol Chem. 2010;285:22382–22393. doi: 10.1074/jbc.M110.126227. [DOI] [PMC free article] [PubMed] [Google Scholar]
- 25.Rhodes DR, Yu J, Shanker K, Deshpande N, Varambally R, Ghosh D, Barrette T, Pandey A, Chinnaiyan AM. ONCOMINE: A cancer microarray database and integrated data-mining platform. Neoplasia. 2004;6:1–6. doi: 10.1016/S1476-5586(04)80047-2. [DOI] [PMC free article] [PubMed] [Google Scholar]
- 26.Rhodes DR, Kalyana-Sundaram S, Mahavisno V, Varambally R, Yu J, Briggs BB, Barrette TR, Anstet MJ, Kincead-Beal C, Kulkarni P, et al. Oncomine 3.0: Genes, pathways, and networks in a collection of 18,000 cancer gene expression profiles. Neoplasia. 2007;9:166–180. doi: 10.1593/neo.07112. [DOI] [PMC free article] [PubMed] [Google Scholar]
- 27.Győrffy B, Surowiak P, Budczies J, Lánczky A. Online survival analysis software to assess the prognostic value of biomarkers using transcriptomic data in non-small-cell lung cancer. PLoS One. 2013;8:e82241. doi: 10.1371/journal.pone.0082241. [DOI] [PMC free article] [PubMed] [Google Scholar]
- 28.Gao J, Aksoy BA, Dogrusoz U, Dresdner G, Gross B, Sumer SO, Sun Y, Jacobsen A, Sinha R, Larsson E, et al. Integrative analysis of complex cancer genomics and clinical profiles using the cBio-Portal. Sci Signal. 2013;6:pl1. doi: 10.1126/scisignal.2004088. [DOI] [PMC free article] [PubMed] [Google Scholar]
- 29.Cerami E, Gao J, Dogrusoz U, Gross BE, Sumer SO, Aksoy BA, Jacobsen A, Byrne CJ, Heuer ML, Larsson E, et al. The cBio cancer genomics portal: An open platform for exploring multidimensional cancer genomics data. Cancer Discov. 2012;2:401–404. doi: 10.1158/2159-8290.CD-12-0095. [DOI] [PMC free article] [PubMed] [Google Scholar]
- 30.Rothenberg SM, Settleman J. Discovering tumor suppressor genes through genome-wide copy number analysis. Curr Genomics. 2010;11:297–310. doi: 10.2174/138920210791616734. [DOI] [PMC free article] [PubMed] [Google Scholar]
- 31.Chen J, Zhang J, Zhao Y, Li J, Fu M. Integrin beta3 down-regulates invasive features of ovarian cancer cells in SKOV3 cell subclones. J Cancer Res Clin Oncol. 2009;135:909–917. doi: 10.1007/s00432-008-0526-8. [DOI] [PubMed] [Google Scholar]
- 32.Fuh KC, Shin JY, Kapp DS, Brooks RA, Ueda S, Urban RR, Chen LM, Chan JK. Survival differences of Asian and Caucasian epithelial ovarian cancer patients in the United States. Gynecol Oncol. 2015;136:491–497. doi: 10.1016/j.ygyno.2014.10.009. [DOI] [PubMed] [Google Scholar]
- 33.Bouvard D, Pouwels J, De Franceschi N, Ivaska J. Integrin inactivators: Balancing cellular functions in vitro and in vivo. Nat Rev Mol Cell Biol. 2013;14:430–442. doi: 10.1038/nrm3599. [DOI] [PubMed] [Google Scholar]
- 34.Takayama S, Ishii S, Ikeda T, Masamura S, Doi M, Kitajima M. The relationship between bone metastasis from human breast cancer and integrin αvβ3 expression. Anticancer Res. 2005;25(1A):79–83. [PubMed] [Google Scholar]
- 35.Sloan EK, Pouliot N, Stanley KL, Chia J, Moseley JM, Hards DK, Anderson RL. Tumor-specific expression of alphavbeta3 integrin promotes spontaneous metastasis of breast cancer to bone. Breast Cancer Res. 2006;8:R20. doi: 10.1186/bcr1398. [DOI] [PMC free article] [PubMed] [Google Scholar]
- 36.Zutter MM, Santoro SA, Staatz WD, Tsung YL. Re-expression of the alpha 2 beta 1 integrin abrogates the malignant phenotype of breast carcinoma cells. Proc Natl Acad Sci USA. 1995;92:7411–7415. doi: 10.1073/pnas.92.16.7411. [DOI] [PMC free article] [PubMed] [Google Scholar]
- 37.Kaur S, Kenny HA, Jagadeeswaran S, Zillhardt MR, Montag AG, Kistner E, Yamada SD, Mitra AK, Lengyel E. β3-integrin expression on tumor cells inhibits tumor progression, reduces metastasis, and is associated with a favorable prognosis in patients with ovarian cancer. Am J Pathol. 2009;175:2184–2196. doi: 10.2353/ajpath.2009.090028. [DOI] [PMC free article] [PubMed] [Google Scholar]
- 38.Hongo K, Tanaka J, Tsuno NH, Kawai K, Nishikawa T, Shuno Y, Sasaki K, Kaneko M, Hiyoshi M, Sunami E, et al. CD133(−) cells, derived from a single human colon cancer cell line, are more resistant to 5-fluorouracil (FU) than CD133(+) cells, dependent on the β1-integrin signaling. J Surg Res. 2012;175:278–288. doi: 10.1016/j.jss.2011.03.076. [DOI] [PubMed] [Google Scholar]
- 39.Lathia JD, Gallagher J, Heddleston JM, Wang J, Eyler CE, Macswords J, Wu Q, Vasanji A, McLendon RE, Hjelmeland AB, et al. Integrin alpha 6 regulates glioblastoma stem cells. Cell Stem Cell. 2010;6:421–432. doi: 10.1016/j.stem.2010.02.018. [DOI] [PMC free article] [PubMed] [Google Scholar]
- 40.Rentala S, Yalavarthy PD, Mangamoori LN. Alpha1 and beta1 integrins enhance the homing and differentiation of cultured prostate cancer stem cells. Asian J Androl. 2010;12:548–555. doi: 10.1038/aja.2010.20. [DOI] [PMC free article] [PubMed] [Google Scholar]
- 41.Pattappa G, Thorpe SD, Jegard NC, Heywood HK, de Bruijn JD, Lee DA. Continuous and uninterrupted oxygen tension influences the colony formation and oxidative metabolism of human mesenchymal stem cells. Tissue Eng Part C Methods. 2013;19:68–79. doi: 10.1089/ten.tec.2011.0734. [DOI] [PubMed] [Google Scholar]
- 42.Ito K, Suda T. Metabolic requirements for the maintenance of self-renewing stem cells. Nat Rev Mol Cell Biol. 2014;15:243–256. doi: 10.1038/nrm3772. [DOI] [PMC free article] [PubMed] [Google Scholar]
- 43.Horsley V, Aliprantis AO, Polak L, Glimcher LH, Fuchs E. NFATc1 balances quiescence and proliferation of skin stem cells. Cell. 2008;132:299–310. doi: 10.1016/j.cell.2007.11.047. [DOI] [PMC free article] [PubMed] [Google Scholar]
- 44.Moore N, Lyle S. Quiescent, slow-cycling stem cell populations in cancer: A review of the evidence and discussion of significance. J Oncol. 2011;2011:396076. doi: 10.1155/2011/396076. [DOI] [PMC free article] [PubMed] [Google Scholar]
- 45.Kolev VN, Wright QG, Vidal CM, Ring JE, Shapiro IM, Ricono J, Weaver DT, Padval MV, Pachter JA, Xu Q. PI3K/ mTOR dual inhibitor VS-5584 preferentially targets cancer stem cells. Cancer Res. 2015;75:446–455. doi: 10.1158/0008-5472.CAN-14-1223. [DOI] [PubMed] [Google Scholar]
- 46.Cao Y, Liu X, Lu W, Chen Y, Wu X, Li M, Wang XA, Zhang F, Jiang L, Zhang Y, et al. Fibronectin promotes cell proliferation and invasion through mTOR signaling pathway activation in gallbladder cancer. Cancer Lett. 2015;360:141–150. doi: 10.1016/j.canlet.2015.01.041. [DOI] [PubMed] [Google Scholar]
- 47.Wang Z, Liu P, Chen Q, Deng S, Liu X, Situ H, Zhong S, Hann S, Lin Y. Targeting AMPK signaling pathway to overcome drug resistance for cancer therapy. Curr Drug Targets. 2016;17:853–864. doi: 10.2174/1389450116666150316223655. [DOI] [PubMed] [Google Scholar]