Abstract
Recent studies suggest the hypothesis that a shared neural ensemble may link distinct memories encoded close in time1–13. According to the memory allocation hypothesis1,2, learning triggers a temporary increase in neuronal excitability14–16 that biases the representation of a subsequent memory to the neuronal ensemble encoding the first memory, such that recall of one memory increases the likelihood of recalling the other memory. Accordingly, we report that the overlap between the hippocampal CA1 ensembles activated by two distinct contexts acquired within a day is higher than when they are separated by a week. Multiple convergent findings indicate that this overlap of neuronal ensembles links two contextual memories. First, fear paired with one context is transferred to a neutral context when the two are acquired within a day but not across a week. Second, the first memory strengthens the second memory within a day but not across a week. Older mice, known to have lower CA1 excitability16,17, do not show the overlap between ensembles, the transfer of fear between contexts, or the strengthening of the second memory. Finally, in aged animals, increasing cellular excitability and activating a common ensemble of CA1 neurons during two distinct context exposures rescued the deficit in linking memories. Taken together, these findings demonstrate that contextual memories encoded close in time are linked by directing storage into overlapping ensembles. Alteration of these processes by aging could affect the temporal structure of memories, thus impairing efficient recall of related information.
Contextual memories are encoded in discrete and sparse populations of neurons in the hippocampus18–22. Recent findings demonstrated that increasing the relative neuronal excitability of a subset of neurons increases the probability that those neurons will participate in a memory trace6,8–11. While previous studies used viral vectors to manipulate excitability, temporary increases in excitability occur naturally following learning, including in the hippocampus14,15,23. Therefore, two distinct memories could be linked across time because the temporary increase in excitability would bias the storage of a subsequent memory to many of the same neurons that encoded the first memory, such that recall of one of these events would also likely lead to recall of the other, a key prediction of the memory allocation hypothesis1,2.
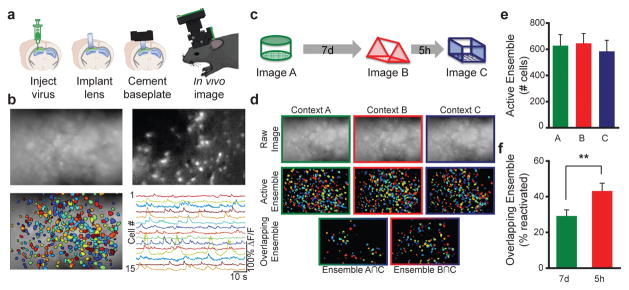
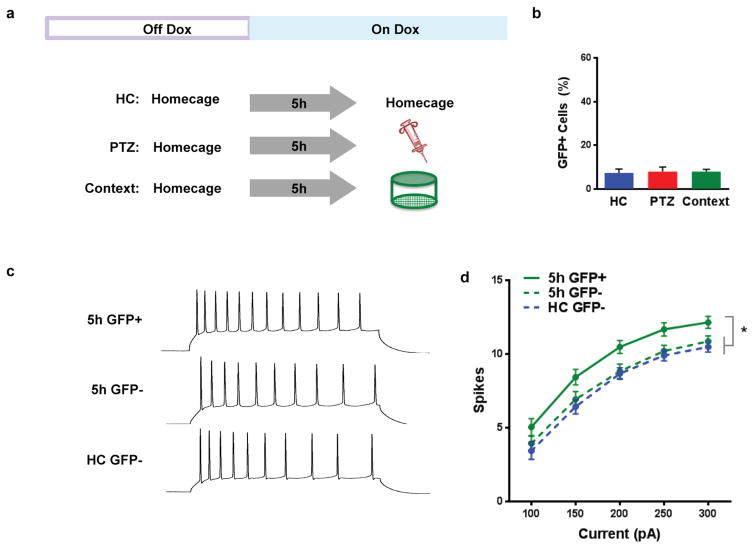
To investigate the neuronal ensembles encoding multiple memories, we constructed an open-source, head-mounted, miniature fluorescent microscope7,24, to image in vivo calcium transients in CA1 neurons using GCaMP6f. With this approach we tracked the activation of the same neurons in mice as they freely explored 3 distinct novel contexts across multiple days (Fig. 1a–c, Extended Data Fig. 1–2). We recorded CA1 neurons activated by 3 different contexts separated by either 5 hours (5h) or 7 days (7d). Previous studies show transient learning-dependent increases in neuronal excitability14,15,25 and we confirmed that 5h after context exposure there was an increase in excitability in CA1 neurons that encoded the context (Extended Data Fig. 3c,d). Therefore, we predicted that the overlap between the neural representations of two contexts separated by 5h would be higher than the overlap of the neural representations of two contexts separated by 7d.
Figure 1. Calcium imaging CA1 with integrated miniature microscopes while exploring different contexts.
a, A microendoscope was implanted directly above CA1 expressing viral GCaMP6f and a baseplate was affixed onto the skull. A miniature fluorescent wide-field microscope was used to image CA1 neurons across repeated imaging sessions. b, Top left: Example image of mean fluorescence during context exploration. Top right: Example image of relative fluorescent change (dF/F). Bottom left: Cells extracted from dF/F. Bottom right: Example traces of dF/F color coded to represent individual neurons. c, Experimental design. Mice were imaged while exploring 3 novel contexts (A, B, C) separated by 7 days (7d) and 5 hours (5h). d, Representative imaging during context exploration. Top row: Images of mean fluorescence from each session. Middle row: Ensemble of cells active in each session. Bottom row: Cells that were active in two sessions. e, There is no difference in the number of cells active across the 3 context explorations (one-way, repeated measures ANOVA, F2,7=2.14, n.s., n=8). f, There is an increase in the overlapping ensemble when contexts are separated by 5h compared to 7d (paired t-test, t7=3.830, p=0.0065, n=8). Significance: **p<0.01. Results show mean +/− sem.
We exposed mice to three distinct, novel contexts. A and C were separated by 7d; B and C were separated by 5h. Using miniature microscopes, we imaged active CA1 neurons during each context exploration (Fig. 1d). We found more overlap between the neural ensembles encoding B & C, spaced 5h apart, than between the neural ensembles encoding A & C, spaced 7d apart (Fig. 1f, Extended Data Fig. 4a,b). Importantly, this difference was not due to differences in the total number of active CA1 cells in the three contexts (Fig. 1e). We confirmed these findings with the TetTag transgenic system, a non-invasive technique that allowed us to tag neurons active during the exploration of two contexts26,27 (Fig. 2a,b, Extended Data Fig. 3a,b). We used this transgenic approach to tag the neural ensemble activated by exploration of an initial novel context (GFP+) and compared this population to the ensemble activated by exploration of a second distinct, novel context (using ZIF immunohistochemistry), either 5h or 7d later (Fig. 2c–e). When the two contexts were separated by 7d, the overlap between the two ensembles was similar to what was expected by chance (Fig. 2f), indicating that independent populations of neurons encoded the two distinct contexts. However, when the two contexts were separated by 5h, overlap between neuronal ensembles was significantly above chance levels and higher than in the 7d group (Fig. 2f). Together, the calcium imaging and TetTag data provide converging evidence that overlapping neural ensembles encode distinct contexts when these contexts are separated by 5h, but not by 7d.
Figure 2. Tagging neural ensembles of contextual memories with the TetTag system.
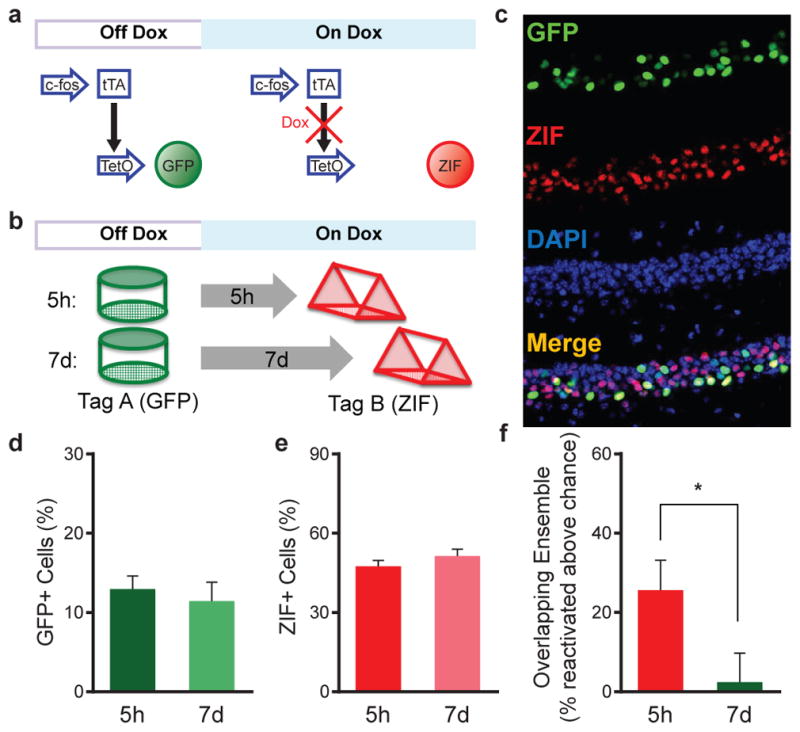
a, Schematic design of the TetTag system. b, Experimental design. Cells active in context A were tagged with GFP and cells active in context B, either 5h or 7d later, were labeled with ZIF immunohistochemistry. c, Representative examples of GFP, ZIF, DAPI and merged images of CA1. d, There was no difference between the percent of cells positive for GFP (unpaired t-test, t24=0.54, n.s., n=15,11). e, There was no difference between the percent of cells positive for ZIF (unpaired t-test, t24=1.11, n.s., n=15,11). f, There was an increase in the overlapping ensemble between contexts when spaced 5h apart compared to 7d apart (unpaired t-test, t24=2.15, p=0.0422, n=15,11). The level of the overlapping ensemble for the 5h group was above chance (one-sample t-test against 0, t14=3.402, p=0.0043) and at chance for the 7d group (one-sample t-test against 0, t10=0.323, n.s.). Significance: *p<0.05. Results show mean +/− sem.
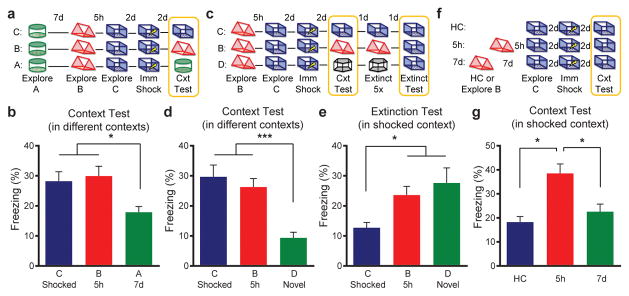
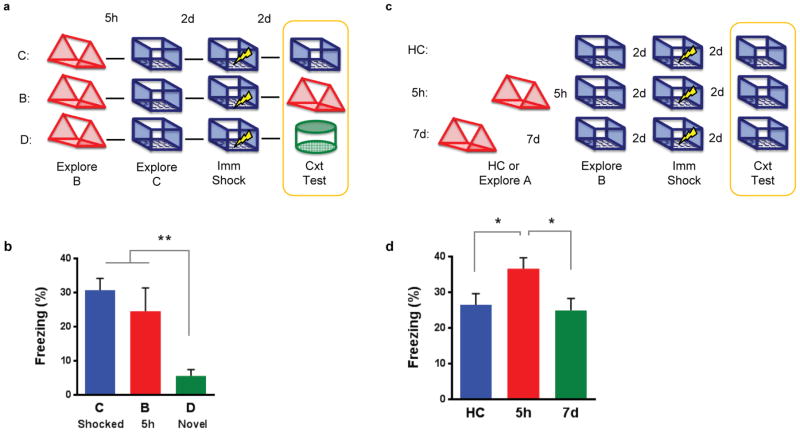
To determine whether the overlap of neuronal representations link contextual memories that occurred close in time, such that the recall of one is more likely to lead to the recall of the other, we again exposed animals to three distinct contexts as described above: A and C were separated by 7d, and B and C were separated by 5h. Two days later, mice were placed in C and given an immediate footshock (Fig. 3a). Since the neural representations of B & C overlap more than A & C (Extended Data Fig. 5), recall of C (shocked context) should lead to recall of B (but not A). Therefore, the fear associated with C should transfer to B (but not to A). Remarkably, we found that mice tested in B, a context in which they had not been shocked, froze as much as mice tested in C (shocked context; Fig. 3b). In contrast, mice tested in A froze significantly less than mice tested in the other two contexts. These results support the hypothesis that the overlap between neuronal representations contextually links memories close in time.
Figure 3. Memories are contextually linked but distinct.
a, Design for transfer of fear experiment. b, There was a significant difference in freezing (one-way ANOVA, F2,47=4.62, p=0.01, n=18,17,15). There was no difference between freezing in contexts C and B (t45=0.42, n.s.). Animals had less freezing in context A than C (t47=2.46, p=0.02) and B (t47=2.83, p=0.007). c, Design for extinction experiment. d, There was a significant difference in freezing during the context test (one-way ANOVA, F2,57=12.99, p<0.0001, n=20,20,20). There was no difference between freezing in contexts C and B (t57=0.80, n.s.). Animals had less freezing in context D than C (t57=4.76, p<0.0001) and B (t57=3.96, p=0.0002). e, There was a significant difference in freezing during the extinction test (one-way ANOVA, F2,57=4.79, p=0.01, n=20,20,20). There were no differences in freezing between groups B and D (t57=0.81, n.s.). Group C had less freezing than groups B (t57=2.18, p=0.03) and D (t57=2.99, p=0.004). f, Design for enhancement experiment. g, There was a significant difference in freezing (one-way ANOVA, F2,51=9.63, p<0.001, n=14,20,20). The 5h group had more freezing than the home cage (HC) (t51=3.98, p=0.0002) and 7d (t51=3.45, p=0.001) groups. There was no difference between HC or 7d groups (t51=0.86, n.s.). Significance: *p<0.05, **p<0.01. Results show mean +/− sem.
Next, we tested whether the memories for B and C remain distinct, rather than forming a unitary memory. If so, extinction of the fear associated with B should not affect recall in C. Again, we exposed animals to B and 5h later to C, and then paired C with a footshock. Two days later, the mice were tested in either C (shocked context), B (5h; not shocked), or D (novel context; Fig. 3c). Consistent with the prior experiment, mice froze similarly in C and B, despite never having been shocked in B. However, they froze less in a novel context (D; Fig. 3d, Extended Data Fig. 6b), demonstrating memory specificity. Next, we carried out repeated exposures in either context C, B, or D daily for 5 days. On the final day, the mice were tested in C (shocked context). As expected, repeated exposures in C (compared to repeated exposures in novel context D) resulted in lower freezing during the extinction test (Fig. 3e). Mice that were repeatedly exposed to B did not show less freezing in C, demonstrating that repeated exposures in B do not cause extinction in C. These results demonstrate that although the memories for B and C show considerable overlap in their ensembles, and recall of B appears to trigger recall of C, memories for these two contexts, acquired 5h apart, remain distinct.
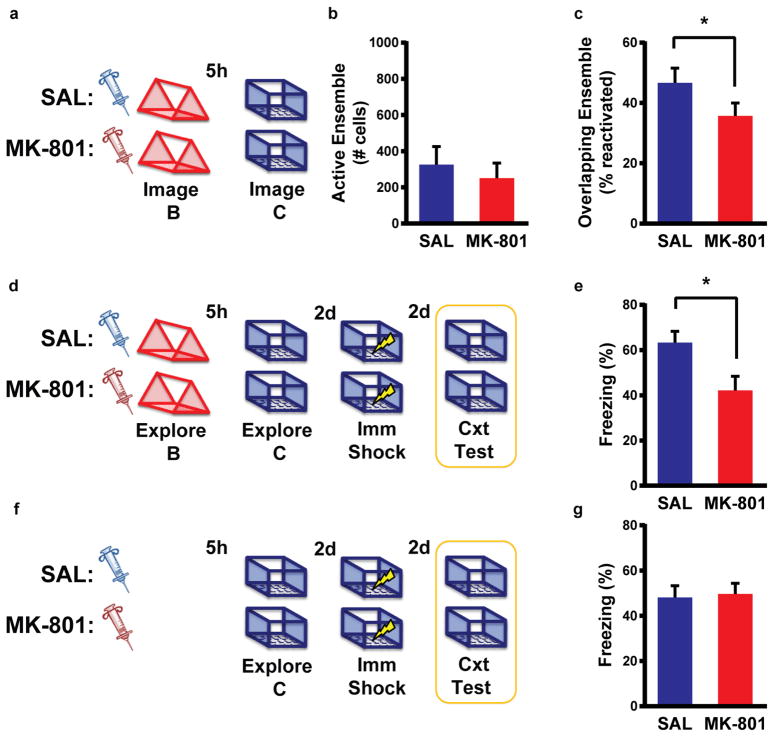
Recent findings demonstrated that manipulations that enhance neuronal excitability can lead to increases in memory strength11. We found that 5h after exposure to a context, there was an increase in excitability in cells that encoded that context (Extended Data Fig. 3c,d). Thus, the sharing of the neural ensemble and the increase in excitability should result in the strengthening of the memory for a second context 5h later. To test for modulation of memory strength, mice were exposed to B and then exposed to C 5h or 7d later. Two days later, animals received an immediate shock in C. Two days after that, they were tested in C. Home cage controls were trained in the same manner, except they were not exposed to B (Fig. 3f). Mice trained with the 5h interval had enhanced memory for C compared to either mice trained with the 7d interval or home cage controls (Fig. 3g; Extended Data Fig. 6c,d,7). Furthermore, this enhancement required NMDA-receptor activity (Extended Data Fig. 8). These data support our previous findings and indicate that for a period of time (5h, but not 7d), the processes triggered by the encoding of one memory can modulate the strength of subsequent memories.
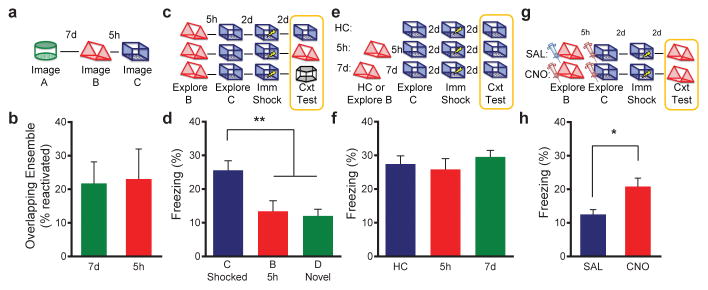
Taken together, the results presented above demonstrate that the overlap between the neuronal ensembles representing two separate contextual memories leads to linking of these memories and suggests that excitability has a key role in this process. Since CA1 neuronal excitability decreases with aging16,17,23,28, we predicted that memory linking processes may be disrupted in older mice. To test this, we started by repeating the calcium imaging (Fig. 4a) as well as the TetTag experiment (Extended Data Fig. 9e,f) in aged mice. Unlike in young adult mice (3–6 month old), in aged mice (14–18 month old) there was no difference between the overlap of neural ensembles encoding contexts spaced 5h or 7d apart (Fig. 4b). This lack of overlap was not due to an inability to reliably reactivate the same neural ensemble during recall of the same context (Extended Data Fig. 9a,b) or to general contextual memory deficits (Extended Data Fig. 9c,d).
Figure 4. Age-related deficits in memory linking are rescued by ensemble activation.
a, Design for calcium imaging with miniature microscope in aged mice. b, There was no difference in the overlapping ensemble between 5h and 7d (paired t-test, t3=0.367, n.s., n=4). c, Design for transfer of fear experiment. d, There was a significant difference in freezing during the context test (one-way ANOVA, F2,47=8.083, p=0.001, n=19,15,16). There was no difference between freezing levels in contexts B and D (t47=0.35, n.s.). Animals had more freezing in context C than B (t4 =3.19, p=0.0025) and D (t47=3.619, p=0.0007). e, Design for behavioral enhancement experiment. f, There was no difference in freezing between groups (one-way ANOVA, F2,39=0.453, n.s., n=15,15,12). g, Design for memory linking rescue by activating cells with DREADD receptors. h, There was higher freezing in the CNO group compared to the SAL group (unpaired t-test, t31=2.36, p=0.02, n=12,21). Significance: *p<0.05, **p<0.01. Results show mean +/− sem.
The results presented above predict that the lack of a shared neural representation in aged mice should disrupt memory linking. To test this hypothesis, we repeated in aged mice the experiment testing the transfer of fear between contexts (Fig. 4c). The results showed that the fear associated with C does not transfer to B in aged mice: the freezing triggered by B (no shock context) was not different than that observed in a novel context, D, and significantly lower than that in C (shocked context; Fig. 4d). Similarly, we found that, unlike in young mice, in aged mice exposure to B (5h before exposure to C) does not enhance memory for C (Fig. 4e,f). Importantly, this was not due to a deficit in learning of a single context, since when trained with a single context the performance of aged mice was indistinguishable from that of young mice (Extended Data Fig. 9c,d). Furthermore, the differences between young and aged mice were also not due to strain differences, as we replicated the transfer and enhancement experiments with young mice from the same genetic background as the aged mice (Extended Data Fig. 6). Altogether, these results strongly support the role of neuronal excitability in linking distinct contextual memories encoded close in time, as aged mice exposed to two contexts close in time did not show the increased overlap between ensembles which presumably led to the lack of both the transfer of fear between contexts and the strengthening of the second memory.
To increase neuronal excitability and rescue the memory-linking deficit in aged mice, we injected a lentivirus to express hM3Dq Designer Receptors Exclusively Activated by Designer Drugs (DREADD) tagged with GFP in a sparse population of dorsal CA1 neurons (Extended Data Fig. 10a,b). Clozapine-N-oxide (CNO) increases excitability and activates cells that express the DREADD receptors11 (Extended Data Fig. 10c,d). To bias the allocation of the two contextual memories so that they shared an overlapping neural ensemble, we injected CNO prior to both learning experiences, spaced 5h apart (Fig. 4g). The control group was given a saline (SAL) injection prior to the first exploration and a CNO injection prior to the second exploration. To test the behavioral consequences of sharing a neural ensemble, mice were brought back two days later for an immediate shock in the second context. Two days later, mice were tested in the first (non-shocked) context to assess their transfer of fear. The CNO group froze more than the SAL group in the non-shocked context (Fig. 4h). This was not due to increased anxiety caused by CNO (Extended Data Fig. 10e,f). Thus, increasing neuronal excitability in aged mice rescued the memory-linking deficit.
Mechanisms that link memories are critically important for organizing the enormous number of related memories stored throughout a lifetime. Our results support the memory allocation hypothesis1,2 and are consistent with human data and computational modeling29, suggesting that memories encoded within close temporal proximity are more likely to be co-recalled than memories encoded across more distant time frames. Our data indicate that overlapping populations of CA1 neurons serve to link and strengthen memories, thus facilitating integrated recall of experiences encoded close in time while separating those encoded further in time. Temporary increases in excitability14–16 likely represent one of a family of mechanisms (synaptic tagging and capture2,30 is another example) that structure the acquisition and storage of information to facilitate future use and recall. Alteration of these processes, such as decreases in neuronal excitability during aging, could affect the organization of memory thus impairing efficient recall of related information.
Methods
Subjects
All experimental protocols were approved by the Chancellor’s Animal Research Committee of the University of California, Los Angeles, in accordance with NIH guidelines. Adult C57Bl/6NTac, C57Bl/6NTac×129S6/SvEvTac and C57Bl/6NIA male mice were singly housed on a 12 hr light/dark cycle. Young adult mice were 3–6 months old, and aged adult mice were 14–18 months old. TetTag mice were generated by crossing transgenic mice that express a histone 2B-GFP fusion protein controlled by the tetO promoter (strain Tg(tetO-HIST1H2BJ/GFP) 47Efu/J; stock number 005104; Jackson Laboratory) with mice that express tetracycline-transactivator (tTA) protein under control of the c-fos promoter. TetTag mice were maintained in a C57BL/6N background. Mice were born and raised on doxycycline (dox) chow (40 mg/kg) to prevent GFP expression prior to experimental manipulations. To open the window for activity-dependent labeling, dox chow was replaced with regular chow for 3 days prior to the start of an experiment. Expression of new GFP was shut off by administration of high dox chow (1g/kg). Memory linking (transfer of fear and enhancement) experiments were conducted with both C57Bl/6NTac × 129S6/SvEvTac and C57Bl/6NIA mice.
Viral construct
AAV1.Syn.GCaMP6f.WPRE.SV40 virus (titer: 4.65 × 10¹³ GC/ml) was purchased from Penn Vector Core. The hM3Dq vector was derived from the CaMK2a.hM4Di.T2A.EGFP/CREB plasmid31. The hM4Di.T2A.EGFP/CREB in that plasmid was replaced by hM3Dq.T2A.EGFP/dTomato. The HA-tagged hM3Dq and dTomato-tagged EGFP are expressed under the CaMK2a promoter and cloned on either side of a T2A self-processing viral peptide. Vesicular-stomatitis-virus-G-protein-pseudotyped lentiviral vectors were produced by calcium-phosphate-mediated transient transfection of human embryonic kidney 293 T (HEK293T) cells, as previously described31. Lentivirus vectors were titered on HEK293T cells based on EGFP expression (titer: 6 ×10⁵ cells/ml).
Surgery
Mice were anesthetized with 1.5 to 2.0% isoflurane for surgical procedures and placed into a stereotactic frame (David Kopf Instruments, Tujunga, CA). Lidocaine (2%; Akorn, Lake Forest, IL) was applied to the sterilized incision site as an analgesic, while subcutaneous saline injections were administered throughout each surgical procedure to prevent dehydration. In addition, carprofen (5mg/kg) and dexamethasone (0.2mg/kg) were administered both during surgery and for 7 days post-surgery with amoxicillin.
For calcium imaging experiments, mice underwent two separate surgical procedures. First, mice were unilaterally microinjected with 500 nanoliters of AAV1.Syn.GCaMP6f.WPRE.SV40 virus at 50nl/min into the dorsal CA1 using the stereotactic coordinates: −2.1 mm posterior to bregma, 2.0 mm lateral to midline and −1.65 mm ventral to skull surface. Two weeks later, the microendoscope (a gradient refractive index lens) was implanted above the previous injection site. For the procedure, a 2.0mm diameter circular craniotomy was centered 0.5mm medial to the virus injection site. Artificial cerebrospinal fluid (ACSF) was repeatedly applied to the exposed tissue to prevent drying. The cortex directly below the craniotomy was aspirated with a 27-gauge blunt syringe needle attached to a vacuum pump. The microendoscope (0.25 pitch, 0.50 NA, 2.0mm in diameter and 4.79 in length, Grintech Gmbh) was slowly lowered with a stereotaxic arm above CA1 to a depth of 1.35mm ventral to the surface of the skull at the most posterior point of the craniotomy. Next, a skull screw was used to anchor the microendoscope to the skull. Both the microendoscope and skull screw were fixed with cyanoacrylate and dental cement. Kwik-Sil (World Precision Instruments) covered the microendoscope. Two weeks later, a small plastic baseplate was cemented onto the animal’s head atop the previously formed dental cement. Debris was removed from the exposed lens with ddH2O, lens paper and forceps. The microscope was placed on top of the baseplate and locked in a position in which the field of focus was in view, so that cells and visible landmarks, such as blood vessels, appeared sharp and in focus. Finally, a plastic cover was fit into the baseplate and secured by magnets.
For aged DREADD experiments, mice were bilaterally microinjected with 700 nanoliters of Lentivirus CaMK2.hM3Dq.T2A.EGFP/dTomato virus at 100nl/min into the dorsal CA1 using the stereotactic coordinates: −1.80 mm posterior to bregma, +/−1.50 mm lateral to midline, −1.60 mm ventral to skull surface; −2.50 mm posterior to bregma, +/−2.00 mm lateral to midline, −1.70 mm ventral to skull surface.
Drug injections
Clozapine-N-oxide (CNO; Enzo Life Sciences) was made in a stock solution of 5mg/10ml in DMSO and then diluted in saline to desired concentration. CNO was injected (i.p.) at a dose of 0.5mg/kg 45 minutes prior to behavioral manipulation. MK-801 (Sigma-Aldrich) was diluted in saline and injected (i.p.) at a dose of 0.1mg/ml 30min prior to behavioral manipulation. Saline was used as the vehicle.
Behavioral procedures
Prior to all experiments, mice were handled for one minute in the vivarium each day for three days. Then, mice were habituated to transportation and external environmental cues by being carted out of the vivarium into the experimental rooms and handled for one minute in the experimental room each day for five days prior to the experiment. For within-subject experiments, mice explored three different contexts, separated by 7d or 5h. Exploration duration of each context was 10 minutes (C57Bl/6NTac and C57Bl/6NIA strains) or five minutes (C57Bl/6NTac×129S6/SvEvTac strain). Contexts were counterbalanced. For between-subject experiments, mice explored two contexts either separated by 7d or 5h. The area of each context was approximately 800 cm2. The shape (circular, triangular, square), scent (simple green, omega, alcohol), visual cues (white plastic walls/opaque textured flooring, black acrylic walls/white acrylic flooring, metal walls/metal grid flooring) were different for each context. For immediate shock32 (imm shock), mice were placed in the chamber with a baseline of 10 seconds (0.7mA- C57Bl/6NTac and C57Bl/6NIA strains) or six seconds (C57Bl/6NTac×129S6/SvEvTac strain) followed by a 2-second shock (0.7mA- C57Bl/6NTac and C57Bl/6NIA strains; 0.5mA- C57Bl/6NTac×129S6/SvEvTac strain). Thirty seconds after the shock, mice were placed back in their home cage. For context tests (cxt text), mice were returned to the designated context. For extinction (extinct) trials, mice were placed in a context for five minutes without shock. Freezing (the cessation of all movement except for respiration), was assessed via an automated scoring system (Med Associates) with 30 frames/s sampling; the mice needed to freeze continuously for at least one second before freezing could be counted33,34. Experimental groups and contexts were counterbalanced across the within-subjects design. For between-subjects design, animals were randomly assigned to groups.
Integrated miniature microscope data acquisition and analyses
Digital imaging data was sent from the CMOS imaging sensor (Aptina, MT9V032) to custom data acquisition (DAQ) electronics and USB Host Controller (Cypress, CYUSB3013) over a lightweight, highly flexible cable. The electronics packaged the data to comply with the USB Video Class (UVC) protocol and then transmit the data over Super Speed USB to a PC running custom DAQ software. The DAQ software was written in C++ and uses Open Computer Vision (OpenCV) libraries for image acquisition. Images are acquired at 30 frames per second and recorded to uncompressed .avi files. The DAQ software simultaneously records animal behavior, time stamping both video streams for offline alignment.
Our analysis suite, written in MATLAB, processes the raw videos and extracts relevant experimental information. Initial processing of calcium imaging data corrected column wise ADC variation, removed small movement artifacts using an amplitude based image registration algorithm, and calculated the mean fluorescence per pixel for conversion to dF/F. A fully automated segmentation algorithm identified and segmented pixels of active cells. The algorithm steps through the recorded calcium imaging video detecting pixel locations of local maxima of fluorescence which met a minimum dF/F criteria. For each of these pixel locations, an iterative process was used to group together neighboring pixels based on that pixel’s fluorescence time trace (+/−5 second window around local maxima of fluorescence event) correlation with the mean time trace of the pixels group in the previous iterative step. Pixels with high correlation (0.95) were added to the group and the process was repeated until the total number of pixels in the group no longer changed. Cells whose centers were within 7μm of each other or whose pixels overlapped by at least 80% were merged together. Once cells were segmented, we extracted dF/F traces and removed crosstalk between neighboring cells. Crosstalk was removed by first detecting calcium transients across all cells and then keeping only the largest event within a 30μm radius of the cell they were associated with7. Calcium events were calculated by first filtering the dF/F (2-pole butterworth low-pass filter: 0.3Hz) to remove noise. Peaks in the filtered dF/F trace above 0.05 dF/F were detected and a window was calculated from the onset of the peak to the return back to baseline. If this window was greater than one second, it was counted as an event. Recordings from multiple sessions of the same animal were aligned using the same amplitude based registration algorithm used for within session registration, except the algorithm was only applied to the mean frame from each session. Once two sessions were registered, cells across two sessions were matched to each other using a distance measure (centers within 5μm of each other).
Code availability
The Matlab analysis suite, as described above, is available for download at www.miniscope.org. This Wiki site is our open-source platform for sharing access to all of our associated software and hardware files for implementing our miniature microscope.
Confocal imaging and histological analysis
Forty-five minutes after exploration of a context, mice were transcardially perfused with 4% PFA, followed by 24 hr post-fixation in the same solution. Free-floating 50μm coronal sections were prepared using a vibratome. Sections were incubated in blocking solution containing 0.2% Triton X, 10% normal goat serum in 0.1 M phosphate buffer for at least 1 hour at room temperature. Then the sections were incubated in the blocking solution with anti-EGR-1 rabbit primary antibody (Cell Signaling; 1:750 dilution for 24 hr at 4°C). After a series of 0.1 M phosphate buffer washes, sections were stained using the same blocking solution as above and Alexafluor 568 goat anti-rabbit secondary antibody (Jackson Immuno Research; 1:500 dilution for 2 hr at room temperature). Finally, sections were stained with DAPI (Invitrogen; 1:1,000 dilution for 15 min) and mounted on slides.
Sections from −1.8mm to −2.2mm posterior to bregma were imaged at 20× magnification using a Nikon C2 or A1 confocal microscope. All imaging was done using standardized laser settings, held constant for samples from the same experimental data set. Cells were manually counted by a blinded rater. Images were quantified from 1–4 sections per animal. The percentage of DAPI-labeled cells containing GFP, ZIF, or both was calculated for each image and then averaged to produce a single measurement for each animal. To normalize for chance, we subtracted chance (GFP/DAPI) × (ZIF/DAPI) × 100 from the observed overlap (GFP and ZIF)/DAPI × 100 and then divided by chance.
Electrophysiology
Mice were anesthetized with a cocktail (3 mL/kg) containing ketamine (25 mg/mL), xylazine (1.3 mg/mL), and acepromazine (0.25 mg/mL) and perfused for 3 minutes with ice-cold, oxygenated, sucrose ACSF containing (in mM) 83 NaCl, 2.5 KCl, 3.3 MgSO4, 0.5 CaCl2, 1NaH2PO4, 26.2 NaHCO3, 22 glucose, and 72 sucrose (~315 mOsml, pH 7.4). The brain was rapidly dissected and 300 μm-thick coronal slices were collected and transferred to an interface chamber containing the same modified sucrose ACSF solution and incubated at 34° C for 30 min. Slices were then held at room temperature (23° C) in the interface chamber for at least 45 min before initiating recordings. Recordings were made in a submersion-type recording chamber and perfused with oxygenated ACSF containing (in mM) 119 NaCl, 2.5 KCl, 1.3 MgCl2, 2.5 CaCl2, 1.3 NaH2PO4, 26.0 NaHCO3, 20 glucose (~295 mOsml) at 23° C at a rate of 1–2 ml/minute.
All recordings were performed within the CA1 region of the hippocampus. Neurons were selected based on emission spectra (GFP+ or GFP-), and were then visualized under infrared differential interference contrast video microscopy (Olympus BX-51 scope and Rolera XR digital camera). Whole-cell recordings were made at room temperature using pulled patch pipettes (5–6 MΩ) filled with internal solution containing (in mM) 150 K-Gluconate, 1.5 MgCl2, 5.0 HEPES, 1 EGTA, 10 phosphocreatine, 2.0 ATP, and 0.3 GTP. Recordings were obtained using Multiclamp 700B patch amplifiers (Molecular Devices) and data analyzed using pClamp 10 software (Molecular Devices). Data were acquired from cells requiring less than −100 pA to hold at a membrane potential of −70mV. Current-spike relationship was determined with a series of depolarizing current steps applied for 500 ms in 10pA increments at 5 sec intervals.
Statistical analysis
GraphPad Prism version 6.00 (GraphPad Software, La Jolla, California USA) was used for statistical analyses. Statistical significance was assessed by two-tailed paired Student’s t-tests, two-tailed unpaired Student’s t-tests, one-way ANOVA, or two-way ANOVA where appropriate. Significant effects or interactions were followed up with post-hoc testing with the use of Fisher’s Least Significant Difference (LSD) where specified in the figure legends. Significance levels were set to P = 0.05. Significance for comparisons: *P < 0.05; **P < 0.01; ***P < 0.001. Sample sizes were chosen on the basis of previous studies. Data met assumptions of statistical tests, and variance was similar between groups for all metrics measured.
Extended Data
Extended Data Figure 1. Stability of fluorescence and overlap.
a, Average normalized mean fluorescence within session. There was no difference between the mean fluorescence across the 3 sessions (one-way repeated measures ANOVA, F2,7 = 0.423, n.s.). b, Average normalized mean fluorescence within session. There was no difference between the mean fluorescence across a 10-minute session (one-way repeated measures ANOVA, F9,22 = 1.108, n.s.). Results show mean +/− s.d. c, Higher ensemble overlap with 5h interval than 7d. Normalized ensemble overlap is calculated as the ensemble overlap between contexts separated by 5h divided by the ensemble overlap between contexts separated by 7d. A normalized overlap value of 1 signifies that there is no difference between the overlap at 5h and 7d. The minimum number of calcium events required from each cell for the cell to be considered “active” (inclusion criteria) was systematically increased and the ratio of the ensemble overlap for the different context was calculated. For all inclusion criteria, there is higher ensemble overlap with a 5h than 7d interval (one-sample t-test against 1,(1) t7 = 3.00, p=0.02, (2) t7 = 2.57, p=0.04, (3) t7 = 2.42, p=0.04, (4) t7 = 2.50, p=0.04, (5) t7 = 2.32, p=0.05. Results show mean +/− sem.
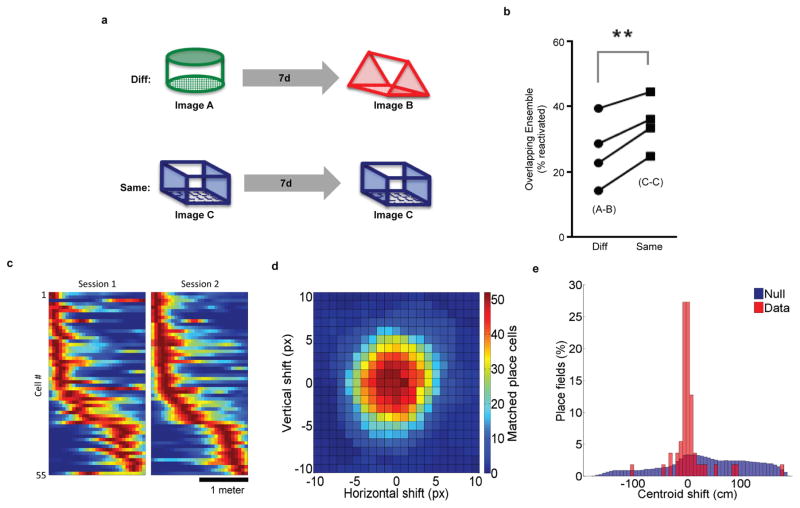
Extended Data Figure 2. Neural ensembles of environments are reliably reactivated at recall of an open field and linear track.
a, Experimental design. Mice were imaged while exploring contexts A and B separated by 7d and imaged while exploring contexts C and C separated by 7d. b, There was a higher percent of cells reactivated when animals explored the same context (C–C) than when animals explored different contexts (A–B) (paired t-test, t3 = 6.305, p=0.0081, n=4). c, Mice were trained to run on a 2-meter linear track with the miniature microscope for water rewards. Mice were trained 3 days a week for 3 weeks with a delay interval of 2–3 days between each session. Place fields were calculated by deconvolving calcium dF/F traces with an exponential to extract approximate spike times. Spikes that remained after crosstalk removal were included for analysis. Animal position was extracted using an automated LED tracking algorithm. A speed threshold (3cm/s) was applied to both the animal position and extracted spike timing and the resulting data was spatially binned (6.5cm bins). Spatial firing rates were calculated by dividing the binned spike counts by the binned occupancy and smoothing with a Gaussian filter (sigma=6.5cm). Cells which showed consistent spatial firing modulation on at least 3 trials, with all other trials showing no bursting activity, were considered as place cells. Normalized spatial firing rates of all matched cells independently meeting the place cell criteria for both days. The data are pooled across 3 mice and include both motion directions. Place fields are ordered by centroid location on session 2. d, A shift of the image registration between sessions results in a decrease in matched place cells. A translational shift both horizontally and vertically was applied to the image registration transformation used in A. Cells were then matched across days and those which met our place cell criteria were kept. The heat map shows the count of matched place cells with a centroid shift of the place field that is less than 33cm. Optimum matching of cells occurred within a 1-pixel translation of the calculated alignment transformation. e, Distribution of centroid shifts of place fields shown in A compared to the null hypothesis that the cell matching between sessions matches random cells.
Extended Data Figure 3. Five hours after exploration of a context, GFP expression is shut off by doxycycline and excitability is increased.
a, Experimental design. Mice were removed from low levels of dox (40mg/kg) and given regular chow for 3 days to open up the GFP tagging window. After receiving administration of high dox (1g/kg) for 5h, mice were injected with 30mg/kg of pentylenetetrazole (PTZ), exposed to a novel context or left in their homecage. An hour later, mice were transcardially perfused and processed for GFP expression. b, There was no difference in GFP expression between the 3 groups (one-way ANOVA, F2,5 = 0.04, n.s., n=3,3,2), demonstrating that 5h was enough time for dox (1g/kg) to suppress expression of new GFP. c, To test excitability learning-related excitability changes, mice explored a novel context and then were administered high dox to shut off new GFP. Five hours later, mice were sacrificed for in vitro slice physiology. d, A two-way repeated measures ANOVA (group × current step) had a significant main effect of group (F2,68 = 4.20, p<0.05, n=21,29,21). 5h GFP+ group had more spikes than the 5h GFP- group (t68 = 2.31, p<0.05) and HC GFP- (t68 = 2.72, p<0.05). There was no difference between 5h GFP- and HC GFP- groups (t68 = 0.61, n.s.). Results show mean +/− sem.
Extended Data Figure 4. Time-course for neuronal overlap and behavioral linking.
a, Design for Ca2+ imaging of neuronal overlap experiment. b, There was a significant difference in overlap across groups (one-way repeated measures ANOVA, F2,12 = 12.43, p=0.002, n=7). There was more overlap at 5h than 2d (t12 = 3.03, p=0.01) and 7d (t12 = 4.72, p=0.0005). c, Design for transfer of fear experiment. d, There was a significant difference in freezing across groups (one-way ANOVA, F2,43 = 3.55, p=0.04, n=20,14,12). There was more freezing at 5h than 2d (t43= 2.13, p=0.04) and 7d (t43 = 2.31, p=0.03). e, Design for enhancement experiment. f, There was a significant difference in freezing across groups (one-way ANOVA, F2,45 = 6.38, p=0.004, n=22,14,12). There was more freezing at 5h than 2d (t45 = 2.45, p=0.02) and 7d (t45 = 3.32, p=0.002). Results show mean +/− sem.
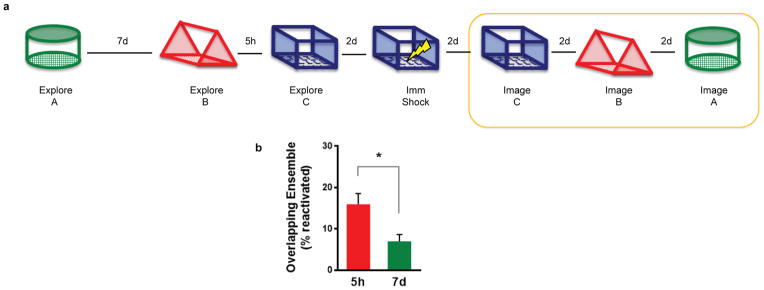
Extended Data Figure 5. Calcium imaging during retrieval.
a, Design for Ca2+ imaging of neuronal overlap at retrieval. Order of contexts during retrieval was counterbalanced. b, There was higher overlap of the neuronal ensemble at 5h than 7d (paired t-test, t7 = 2.55, p=0.04, n=8). Results show mean +/− sem.
Extended Data Figure 6. Replication of memory linking experiments in young (3–6 month old) C57Bl/6NIA mice.
a, Design for transfer of fear experiment. b, There was a significant difference in freezing across the groups (one-way ANOVA, F2,20 = 9.49, p=0.001, n=8,7,8). There was no difference between freezing levels in context C or B (t20= 0.99, n.s.). Animals had less freezing in context D than C (t20 = 4.19, p=0.0004) and B (t20 = 3.06, p=0.006). c, Design for enhancement experiment. d, There was a significant difference in freezing (one-way ANOVA, F2,46 = 4.071, p=0.023, n=16,17,16). The 5h group had more freezing than the HC group (t46 = 2.72, p=0.0278) and 7d group (t46 = 2.612, p=0.012). There was no difference between HC or 7d groups (t46 = 0.335, n.s.). Results show mean +/− sem.
Extended Data Figure 7. Exploring the same context twice enhances memory regardless of time.
a, Experimental design. b, There was a significant difference in freezing (one-way ANOVA, F3,44 = 2.92, p=0.04, n=10,11,13,14). Consistent with the prior experiment, there was more freezing in the AB-5h than AB-7d group (t44 = 2.19, p<0.05). AB-7d group also had more freezing than AA-5h (t44 = 2.35, p<0.05) and AA-7d (t44 = 2.48, p<0.05) however there were no differences between the AA-5h and AA-7d (t44 = 0.06, n.s.) and AA-5h and AB-5h groups (t44 = 0.31, n.s.). Results show mean +/− sem.
Extended Data Figure 8. NMDA receptor activity is required for overlap of neural ensembles and behavioral enhancement.
a, Design for Ca2+ imaging of neuronal overlap with MK-801 or saline. b, There was no difference in the number of cells active during exploration of the first context between SAL and MK-801 groups (unpaired t-test, t6 = 0.58, n.s., n=4,4). c, There was lower overlap of the neuronal ensemble in the MK-801 than SAL group (paired t-test, t3 = 3.45, p=0.04, n=4). d, Design for behavioral enhancement experiment. e, There was lower freezing in the MK-801 than SAL group (unpaired t-test, t22 = 2.65, p=0.015, n=12,12). f, Design for behavioral control experiment. g, There was no difference in freezing between SAL and MK-801 groups (unpaired t-test, t22 = 0.22, n.s., n=12,12). Results show mean +/− sem.
Extended Data Figure 9. Control experiments for aged mice.
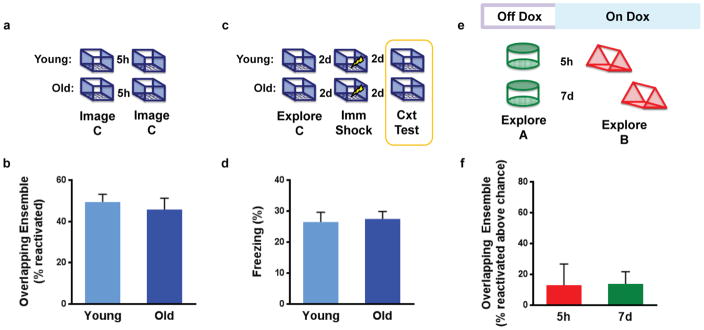
a, Design for experiment of recall for single contextual experience. b, There was no difference in reactivation of cells between young and old mice during recall (unpaired t-test, t6 = 0.59, n.s., n=4,4). c, Design for experiment with single context pre-exposure in young and old mice. d, There was no difference in freezing behavior to exposures of a single context (unpaired t-test, t29 = 0.24, n.s., n=16,15). e, Design for replication of TetTag experiment in old mice. f, There was no difference in the levels of overlapping ensembles between the 5h and 7d groups (unpaired t-test, t6 = 0.06, n.s., n=3,5). Results show mean +/− sem.
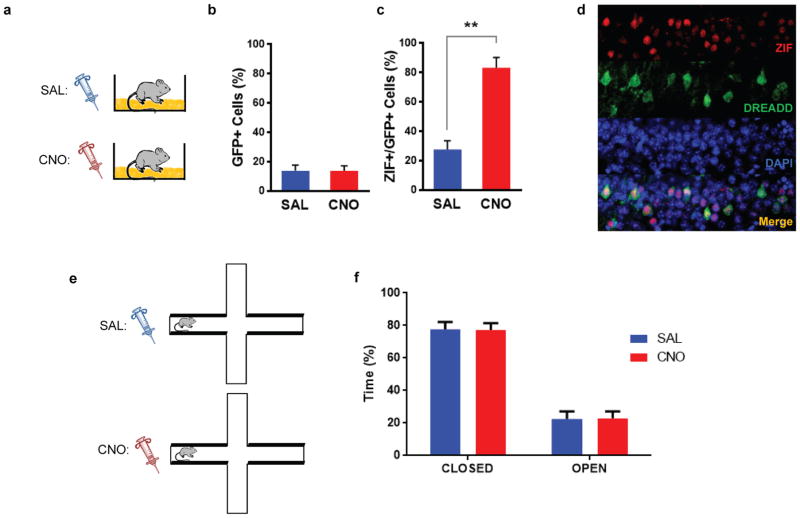
Extended Data Figure 10. CNO activates cells with DREADD receptors and does not increase anxiety in aged mice.
a, Mice infected with DREADD virus in CA1 were injected with saline (SAL) or clozapine-N-oxide (CNO) and then sacrificed 90 minutes post-injection for immunofluorescence staining. b, There was no difference in the percentage of DREADD-positive cells (labeled with GFP) between SAL and CNO groups (unpaired t-test, t7 = 0.01, n.s., n=3,6). c, DREADD-positive cells (labeled with GFP) had more ZIF when injected with CNO than SAL (unpaired t-test, t7 = 5.08, p=002). d, Representative examples of ZIF, DREADD, DAPI as well as merged images of CA1. e, Design for elevated plus maze experiment in aged mice with DREADD virus. f, A two-way ANOVA showed no main effect of injection (F1,9 = 0.75, n.s., n=6,5) and a significant main effect of arms (F1,9 = 71.03, p<0.0001). There was no significant interaction between injection and arms (F1,9 = 0.003, n.s.). Results show mean +/− sem.
Acknowledgments
We thank Baljit Khakh for support in the development of the miniaturized microscopes. We thank Elaine Thai, Davood Tarzi, Ashim Ahuja, Kelly Lew, Elaine Lu, Emelia Stuart, Sonia Zhang, Shayan Ghiaee, Celina Yang, Aria Fariborzi, Kevin Cheng, Naina Rao, Arlene Chang, Chris Grimmick and Michael Einstein for help with experiments; Naina Rao for assistance with graphical design; and all members of the Silva laboratory for their support. This work was supported by National Institute on Aging R37 AG013622 and the Dr. Miriam and Sheldon G. Adelson Medical Research Foundation to A.J.S.; National Institutes of Health RO1 MH101198, 1U54 HD087101 and VA Merit Award BX00152401A1 to P.G.; National Research Service Award F32 MH97413 and Behavioral Neuroscience Training Grant T32 MH15795 to D.J.C.; Neurobehavioral Genetics Training Grant T32 NS048004 to D.A.; Cellular Neurobiology Training Grant T32 NS710133 and Epilepsy Foundation Postdoctoral Research Training Fellowship to T.S.; National Institutes of Health U01 NS094286-01 and David Geffen School of Medicine Dean’s Fund for development of open-source miniaturized microscopes to A.J.S and P.G.
Footnotes
Supplementary Information Full Methods and Extended Data display items and their references are available in the online version of the paper.
The authors declare no competing financial interests.
Readers are welcome to comment on the online version of this article.
Author Contributions D.J.C., J.S., T.S., D.A. and A.J.S. contributed to the study design. D.A., T.S., D.J.C., P.G. and A.J.S. developed the miniature microscope system. D.A. engineered hardware and software associated with the miniature microscope and wrote the MATLAB analysis suite. T.S., D.J.C., W.S., J.S., S.F., J.L. and I.K. performed surgeries. D.J.C., T.S., M.L., W.S. and B.W. conducted calcium imaging and TetTag experiments. M.M. engineered and provided TetTag mice. D.J.C., J.S., T.S., M.L., W.S., B.W., M.V. and M.Z. conducted behavioral experiments. D.J.C., D.A., T.S. and A.L. analyzed the data. J.B., D.J.C. and T.S. conducted in vitro physiology experiment. M.T. supported physiology experiment. Y.S. and M.K. made DREADD virus. D.J.C., I.K., B.W. and K.B. managed mouse colony. D.J.C., T.S., D.A., J.S. and A.J.S. wrote the paper. All authors discussed and commented on the manuscript.
References
- 1.Silva AJ, Zhou Y, Rogerson T, Shobe J, Balaji J. Molecular and cellular approaches to memory allocation in neural circuits. Science. 2009;326:391–395. doi: 10.1126/science.1174519. [DOI] [PMC free article] [PubMed] [Google Scholar]
- 2.Rogerson T, et al. Synaptic tagging during memory allocation. Nature Rev Neurosci. 2014;15:157–169. doi: 10.1038/nrn3667. [DOI] [PMC free article] [PubMed] [Google Scholar]
- 3.Mankin EA, et al. Neuronal code for extended time in the hippocampus. Proc of the Natl Acad Sci USA. 2012;109:19462–19467. doi: 10.1073/pnas.1214107109. [DOI] [PMC free article] [PubMed] [Google Scholar]
- 4.Han JH, et al. Neuronal competition and selection during memory formation. Science. 2007;316:457–460. doi: 10.1126/science.1139438. [DOI] [PubMed] [Google Scholar]
- 5.Han JH, et al. Selective erasure of a fear memory. Science. 2009;323:1492–1496. doi: 10.1126/science.1164139. [DOI] [PubMed] [Google Scholar]
- 6.Zhou Y, et al. CREB regulates excitability and the allocation of memory to subsets of neurons in the amygdala. Nature Neurosci. 2009;12:1438–1443. doi: 10.1038/nn.2405. [DOI] [PMC free article] [PubMed] [Google Scholar]
- 7.Ziv Y, et al. Long-term dynamics of CA1 hippocampal place codes. Nature Neurosci. 2013;16:264–266. doi: 10.1038/nn.3329. [DOI] [PMC free article] [PubMed] [Google Scholar]
- 8.Epsztein J, Brecht M, Lee AK. Intracellular determinants of hippocampal CA1 place and silent cell activity in a novel environment. Neuron. 2011;70:109–120. doi: 10.1016/j.neuron.2011.03.006. [DOI] [PMC free article] [PubMed] [Google Scholar]
- 9.Lee D, Lin BJ, Lee AK. Hippocampal place fields emerge upon single-cell manipulation of excitability during behavior. Science. 2012;337:849–853. doi: 10.1126/science.1221489. [DOI] [PubMed] [Google Scholar]
- 10.Dragoi G, Tonegawa S. Preplay of future place cell sequences by hippocampal cellular assemblies. Nature. 2011;469:397–401. doi: 10.1038/nature09633. [DOI] [PMC free article] [PubMed] [Google Scholar]
- 11.Yiu AP, et al. Neurons are recruited to a memory trace based on relative neuronal excitability immediately before training. Neuron. 2014;83:722–735. doi: 10.1016/j.neuron.2014.07.017. [DOI] [PubMed] [Google Scholar]
- 12.Ezzyat Y, Davachi L. What constitutes an episode in episodic memory? Psychol Sci. 2011;22:243–252. doi: 10.1177/0956797610393742. [DOI] [PMC free article] [PubMed] [Google Scholar]
- 13.Kastellakis G, Silva AJ, Poirazi P. Linking memories across time via synapse clustering in nonlinear dendrites. Neuron. submitted. [Google Scholar]
- 14.Moyer JR, Jr, Thompson LT, Disterhoft JF. Trace eyeblink conditioning increases CA1 excitability in a transient learning-specific manner. The Journal of neuroscience: the official journal of the Society for Neuroscience. 1996;16:5536–5546. doi: 10.1523/JNEUROSCI.16-17-05536.1996. [DOI] [PMC free article] [PubMed] [Google Scholar]
- 15.McKay BM, Matthews EA, Oliveira FA, Disterhoft JF. Intrinsic neuronal excitability is reversibly altered by a single experience in fear conditioning. J Neurophys. 2009;102:2763–2770. doi: 10.1152/jn.00347.2009. [DOI] [PMC free article] [PubMed] [Google Scholar]
- 16.Oh MM, Oliveira FA, Disterhoft JF. Learning and aging related changes in intrinsic neuronal excitability. Front Aging Neurosci. 2010;2:2. doi: 10.3389/neuro.24.002.2010. [DOI] [PMC free article] [PubMed] [Google Scholar]
- 17.Kaczorowski CC, Disterhoft JF. Memory deficits are associated with impaired ability to modulate neuronal excitability in middle-aged mice. Learn Mem. 2009;16:362–366. doi: 10.1101/lm.1365609. [DOI] [PMC free article] [PubMed] [Google Scholar]
- 18.Garner AR, et al. Generation of a synthetic memory trace. Science. 2012;335:1513–1516. doi: 10.1126/science.1214985. [DOI] [PMC free article] [PubMed] [Google Scholar]
- 19.Guzowski JF, McNaughton BL, Barnes CA, Worley PF. Environment-specific expression of the immediate-early gene Arc in hippocampal neuronal ensembles. Nature Neurosci. 1999;2:1120–1124. doi: 10.1038/16046. [DOI] [PubMed] [Google Scholar]
- 20.Liu X, et al. Optogenetic stimulation of a hippocampal engram activates fear memory recall. Nature. 2012;484:381–385. doi: 10.1038/nature11028. [DOI] [PMC free article] [PubMed] [Google Scholar]
- 21.McKenzie S, et al. Hippocampal representation of related and opposing memories develop within distinct, hierarchically organized neural schemas. Neuron. 2014;83:202–215. doi: 10.1016/j.neuron.2014.05.019. [DOI] [PMC free article] [PubMed] [Google Scholar]
- 22.Deng W, Mayford M, Gage FH. Selection of distinct populations of dentate granule cells in response to inputs as a mechanism for pattern separation in mice. eLife. 2013;2 doi: 10.7554/eLife.00312. [DOI] [PMC free article] [PubMed] [Google Scholar]
- 23.Disterhoft JF, Oh MM. Alterations in intrinsic neuronal excitability during normal aging. Aging Cell. 2007;6:327–336. doi: 10.1111/j.1474-9726.2007.00297.x. [DOI] [PubMed] [Google Scholar]
- 24.Ghosh KK, et al. Miniaturized integration of a fluorescence microscope. Nature Methods. 2011;8:871–878. doi: 10.1038/nmeth.1694. [DOI] [PMC free article] [PubMed] [Google Scholar]
- 25.Disterhoft JF, Oh MM. Learning, aging and intrinsic neuronal plasticity. Trends Neurosci. 2006;29:587–599. doi: 10.1016/j.tins.2006.08.005. [DOI] [PubMed] [Google Scholar]
- 26.Reijmers LG, Perkins BL, Matsuo N, Mayford M. Localization of a stable neural correlate of associative memory. Science. 2007;317:1230–1233. doi: 10.1126/science.1143839. [DOI] [PubMed] [Google Scholar]
- 27.Tayler KK, Tanaka KZ, Reijmers LG, Wiltgen BJ. Reactivation of neural ensembles during the retrieval of recent and remote memory. Curr Biol. 2013;23:99–106. doi: 10.1016/j.cub.2012.11.019. [DOI] [PubMed] [Google Scholar]
- 28.Murphy GG, Shah V, Hell JW, Silva AJ. Investigation of age-related cognitive decline using mice as a model system: neurophysiological correlates. American J Geriatric Psychiatry. 2006;14:1012–1021. doi: 10.1097/01.JGP.0000209404.54310.b3. [DOI] [PubMed] [Google Scholar]
- 29.Sederberg PB, Howard MW, Kahana MJ. A context-based theory of recency and contiguity in free recall. Psychol Rev. 2008;115:893–912. doi: 10.1037/a0013396. [DOI] [PMC free article] [PubMed] [Google Scholar]
- 30.Redondo RL, Morris RG. Making memories last: the synaptic tagging and capture hypothesis. Nature Rev Neurosci. 2011;12:17–30. doi: 10.1038/nrn2963. [DOI] [PubMed] [Google Scholar]
- 31.Sano Y, et al. CREB regulates memory allocation in the insular cortex. Curr Biol. 2014;24:2833–2837. doi: 10.1016/j.cub.2014.10.018. [DOI] [PMC free article] [PubMed] [Google Scholar]
- 32.Frankland PW, et al. Consolidation of CS and US representations in associative fear conditioning. Hippocampus. 2004;14:557–569. doi: 10.1002/hipo.10208. [DOI] [PubMed] [Google Scholar]
- 33.Anagnostaras SG, et al. Automated assessment of pavlovian conditioned freezing and shock reactivity in mice using the video freeze system. Front Behav Neurosci. 2010;4:158. doi: 10.3389/fnbeh.2010.00158. [DOI] [PMC free article] [PubMed] [Google Scholar]
- 34.Cai DJ, Shuman T, Gorman MR, Sage JR, Anagnostaras SG. Sleep selectively enhances hippocampus-dependent memory in mice. Behav Neurosci. 2009;123:713–719. doi: 10.1037/a0016415. [DOI] [PubMed] [Google Scholar]


