

A multidisciplinary approach reveals key insights into the principles of collective cell migration, which is involved in fundamental biological processes. The conformational plasticity of a single molecule, JRAB/MICAL-L2, provides “law and order” in collective cell migration.
Abstract
In fundamental biological processes, cells often move in groups, a process termed collective cell migration. Collectively migrating cells are much better organized than a random assemblage of individual cells. Many molecules have been identified as factors involved in collective cell migration, and no one molecule is adequate to explain the whole picture. Here we show that JRAB/MICAL-L2, an effector protein of Rab13 GTPase, provides the “law and order” allowing myriad cells to behave as a single unit just by changing its conformation. First, we generated a structural model of JRAB/MICAL-L2 by a combination of bioinformatic and biochemical analyses and showed how JRAB/MICAL-L2 interacts with Rab13 and how its conformational change occurs. We combined cell biology, live imaging, computational biology, and biomechanics to show that impairment of conformational plasticity in JRAB/MICAL-L2 causes excessive rigidity and loss of directionality, leading to imbalance in cell group behavior. This multidisciplinary approach supports the concept that the conformational plasticity of a single molecule provides “law and order” in collective cell migration.
INTRODUCTION
In biological processes such as embryonic morphogenesis, wound repair, and vascularization, cells often move in groups, a process termed collective cell migration (Friedl and Gilmour, 2009; Gray et al., 2010; Mayor and Carmona-Fontaine, 2010; Rorth, 2012; Theveneau and Mayor, 2012). This phenomenon is also a common mechanism of cancer invasion (Sahai, 2005; Friedl et al., 2012). Collectively migrating cells are much better organized than a random assemblage of individual cells. Therefore some factor or factors must impose a certain “law and order” that allows myriad cells to behave as a single unit. Many molecules, including components of diverse signaling pathways, have been identified as factors in collective cell migration. However, we are far from understanding the whole picture.
Here we focus on the conformational plasticity of a single molecule, junctional Rab13-binding protein (JRAB)/molecules interacting with CasL-like 2 (MICAL-L2), to explain the complexity in collectively migrating cells. JRAB/MICAL-L2 is an effector protein of Rab13, a member of the Rab family of small GTPases (Rabs), which serve as molecular switches in the regulation of membrane trafficking (Takai et al., 2001; Zerial and McBride, 2001; Hutagalung and Novick, 2011). Rab13–JRAB/MICAL-L2 is involved in transport of cell adhesion molecules and regulation of cell−cell adhesion in epithelia (Zahraoui et al., 1994; Marzesco et al., 2002; Morimoto et al., 2005; Terai et al., 2006; Yamamura et al., 2008; Sakane and Sasaki, 2015). In addition, JRAB/MICAL-L2 spatiotemporally regulates actin dynamics (Sakane et al., 2012).
In this study, we use a multidisciplinary approach combining cell biology, live imaging, computational biology, and biomechanics to show that conformational plasticity of JRAB/MICAL-L2 is critical for the “law and order” underlying integrated collective cell migration. We also provide a structural model for JRAB/MICAL-L2 and elucidate the basis of its conformational change via a combination of bioinformatic and biochemical analyses.
RESULTS
Structural modeling of JRAB/MICAL-L2 via a combination of bioinformatic and biochemical analyses
Previously we used biochemical analyses to propose a model in which JRAB/MICAL-L2 adopts the closed form via intramolecular interaction and the conformation can be changed into the open form by interaction with activated Rab13 (Sakane et al., 2010). To further support our hypothesis (and since crystallization of recombinant JRAB/MICAL-L2 has been challenging), we sought to build a structural model of JRAB/MICAL-L2 in complex with Rab13 by a combination of bioinformatic and biochemical analyses.
Secondary structure prediction (PSIPRED; Jones, 1999) and disorder prediction (POODLE-S; Shimizu et al., 2007) of the C-terminal portion of JRAB-C (amino acids [aa] 806–1009) suggested that both ends of JRAB-C are intrinsically disordered and the intervening sequence contains three helical regions (Supplemental Figure S1, A and B). For convenience, we divided the last two helical regions, which are long (∼50 residues), into two parts based on the secondary structure prediction, separating JRAB-C into five putative helices (helix 1, aa 843–872; 2, aa 880–900; 3, aa 901–928; 4, aa 937–960; and 5, aa 961–984) and four loop regions (loop 1, aa 806–842; 2, aa 873–879; 3, aa 929–936; and 4, aa 985–1009; Supplemental Figure S1, A and B).
Generally, five Rab family (RabF) regions distinguish Rab proteins from other proteins of the Ras superfamily, and four Rab subfamily–specific (RabSF) regions are highly conserved within each of the Rab subfamilies, that is, clusters of related Rab proteins (Pereira-Leal and Seabra, 2000). We found that the C-terminal RabSF4 region of Rab13 is involved in binding to JRAB/MICAL-L2, its effector (Supplemental Figure S1, C and D; Materials and Methods). We then hypothesized that the structure of other Rab–effector complexes, in which the SF4 region of Rab interacts with the effector, may be similar to that of Rab13-JRAB/MICAL-L2. We searched the Protein Data Bank (PDB) for structures of Rab–effector complexes associated via the SF4 region and identified three: Rab3A–Rabphilin3A (PDBID: 1zbd), Rab27B–Slac2-1/melanophilin (2zet), and Rab27A–Slp2-a/Exophilin4 (3bc1). The Rab-binding sites of all three effector proteins consist of several helices. A structural alignment of the three effector proteins was generated using Mustang (Konagurthu et al., 2006) to extract common structural features. We next generated a sequence alignment of JRAB/MICAL-L2 from seven species (UniProt ID: Q8IY33 [Homo sapiens], G5BUG1 [Heterocephalus glaber], Q3TN34 [Mus musculus], G3GVG4 [Cricetulus griseus], D3ZEN0 [Rattus norvegicus], L5KC08 [Pteropus alecto], and L8Y7J9 [Tupaia chinensis]) using ClustalW (Thompson et al., 1994). Alignment of the effectors with the JRAB C-terminal fragments (corresponding to aa 880–1009 in mouse) was generated using Fugue (Shi et al., 2001), based on the structural alignment of the three effector proteins and their amino acid sequence information and on the sequence alignment of JRAB/MICAL-L2 from the seven species. In this alignment, the helical regions of the three effectors are aligned well with those of JRAB/MICAL-L2 predicted earlier, although the sequence similarities between JRAB/MICAL-L2 and the other effector proteins are low, suggesting that helices 2, 3, and 5 and loop 4 have the potential to bind to Rab13 (Supplemental Figure S1E).
To corroborate the prediction from the bioinformatic analysis, we performed biochemical experiments. First, we prepared several deletion mutants of JRAB-C containing the putative helical regions in various combinations according to the secondary structure prediction described earlier. Pull-down assays using JRAB-C mutants revealed that helices 2–5 and part of loop 4 (following helix 5) are required for binding of JRAB-C to activated Rab13 (Rab13DA∆C3 was used as a dominant-active mutant; Materials and Methods; Supplemental Figure S1D and Figure 1A), consistent with the predicted result, and that JRAB-N (calponin homology [CH] + LIM) interacts with JRAB-C via helices 1 and 2 and the first half of helix 3 (Figure 1B). Finally, we built a rough model of how the structures of JRAB-C, JRAB-N (LIM), and Rab13 could be arranged in three-dimensional (3D) space (Figure 1C) in a manner consistent with all the data from the biochemical experiments and additional prediction results (Materials and Methods). Our final model shows that the hydrophobic or negatively charged regions of JRAB-C (enclosed by solid and dotted lines, respectively, in Figure 1C) are involved in the interactions with JRAB-N (LIM) and Rab13, respectively.
FIGURE 1:

Computational structural model of the JRAB-C-JRAB-N and JRAB-C-Rab13 complex based on biochemical and bioinformatic analyses. (A, B) HEK293 cell lysates containing indicated GFP-tagged JRAB C-terminal deletion mutants were subjected to pull-down assays using GST-Rab13DA∆C3 (A) or GST-JRAB-CH + LIM (B). The pulled-down proteins were detected by Western blotting (WB) using an anti-GFP antibody. The schema indicates each mutant, the position of each helix structure (h), and its affinity for Rab13DA∆C3 (A) or JRAB-CH + LIM (B). **GFP-JRAB-C; *GFP-JRAB-CC. The amount of purified recombinant protein, GST-Rab13DA∆C3 (A) or GST-JRAB-CH + LIM (B), attached to glutathione-Sepharose beads was analyzed by SDS–PAGE, followed by Coomassie brilliant blue (CBB) staining. Arrowhead indicates GST-JRAB-CH + LIM. (C) Computational structural models of JRAB-C–Rab13 and JRAB-C–JRAB-N (LIM) based on biochemical data and the structure of three Rab–effector complexes registered in the PDB (Rab3A–Rabphilin-3A [PDBID:1zbd], Rab27B–Slac2-1/melanophilin [2zet], and Rab27A–Slp2-a/Exophilin4 [3bc1]). The electrostatic positive and negative regions on molecular surfaces are blue and red, respectively, whereas hydrophobic residues are yellow. The square indicated by the solid line is the LIM-binding site, and the square indicated by the dashed line is the Rab13-binding site. Note that LIM is the minimum domain of the JRAB/MICAL-L2 N-terminal region responsible for the interaction with the JRAB/MICAL-L2 C-terminal region. (D, E) Activated Rab13 releases the intramolecular interaction of JRAB/MICAL-L2. (D) HEK293 cell lysates containing GFP-tagged JRAB-C or -CC with HA-Rab13DA (dominant-active mutant) or HA were subjected to pull-down assays using GST-JRAB-CH + LIM. GFP-JRAB-CC, which lacks a part of the Rab13-binding region, was used as a negative control. The amount of GST-JRAB-CH + LIM attached to glutathione-Sepharose beads was analyzed by SDS–PAGE, followed by CBB staining. Double asterisks and arrowhead indicate GFP-JRAB-C and GST-JRAB-CH + LIM, respectively. (E) HEK293 cell lysates containing GFP-JRAB-C were mixed with His-Rab13DA∆C3 or His-Rab13DN∆C3 (dominant-negative mutant) and subjected to pull-down assays using GST-JRAB-CH + LIM. Pulled-down proteins were detected by WB using an anti-GFP antibody. Amount of GST-JRAB-CH + LIM attached to glutathione-Sepharose beads was analyzed by SDS–PAGE followed by CBB staining. Arrowhead, GST-JRAB-CH + LIM.
Our present structural model of JRAB-C indicates that JRAB-N (CH + LIM) and Rab13 competitively bind to helices 2 and 3 of JRAB-C, although our previous data showed that JRAB-N interacts with the region indicated as coiled coil (CC; aa 806–912) in JRAB-C, whereas Rab13 associates with JRAB-C via the C-terminal (CT; aa 913–1009), the region just after CC (Sakane et al., 2010). To verify our new prediction, we performed pull-down assays. The presence of either hemagglutinin (HA)-Rab13DA or hexahistidine (His)-tagged Rab13DA∆C3 recombinant protein inhibited the interaction between green fluorescent protein (GFP)–JRAB-C and glutathione S-transferase (GST)–JRAB-N (CH + LIM; Figure 1, D and E), indicating that activated Rab13 displaces JRAB-N (CH + LIM). In other words, the intramolecular interaction between JRAB-N and JRAB-C is disrupted competitively by the binding of Rab13 to JRAB-C.
JRAB/MICAL-L2 conformational mutants, JRAB∆CT and JRAB∆CC, adopt a closed and an open form, respectively
We previously developed two deletion mutants of JRAB/MICAL-L2: JRAB∆CT, which lacks the CT domain (aa 913–1009), and JRAB∆CC, which lacks the CC domain (aa 806–912; Sakane et al., 2010). In this study, we found that CT does not cover the full region associated with Rab13, that is, JRAB∆CT maintains a part of Rab13-binding region (aa 877–912). Therefore we sought to examine whether JRAB∆CT and JRAB∆CC exhibit closed and open forms, respectively, as we expected.
First, we performed pull-down assays using GST-JRAB-C, as reported in our previous study (Sakane et al., 2010; Figure 2A). As expected, GFP-JRAB∆CC was pulled down by GST-JRAB-C, whereas GFP-JRAB∆CT was not. GFP-JRABwt (wild type) was also pulled down by GST-JRAB-C but less efficiently than GFP-JRAB∆CC. Next we purified the recombinant His-tagged JRABwt and mutants from HEK293 cells and applied them to a gel filtration column that separates proteins according to their molecular size—larger proteins elute in earlier fractions. Although the molecular weights of JRAB∆CC and JRAB∆CT are almost the same and both are smaller than JRABwt, as clearly shown by SDS–PAGE, JRAB∆CC eluted in an earlier fraction than JRABwt and JRAB∆CT (Figure 2B). JRAB∆CC may pass through the column faster because it is in an open conformation, resulting in a larger apparent molecular size than the other proteins.
FIGURE 2:

JRAB/MICAL-L2 conformational mutants, JRAB∆CT and JRAB∆CC, adopt a closed and an open form, respectively. (A) HEK293 cell lysates containing GFP-tagged JRAB variants (WT, ∆CC, ∆CT) were subjected to pull-down assays using GST-JRAB-C. The pulled-down protein, open-form JRAB/MICAL-L2, was detected by WB using an anti-GFP antibody. The amount of GST-JRAB-C attached to glutathione-Sepharose beads was analyzed by SDS–PAGE, followed by CBB staining. Schematic indicates the putative conformation of JRAB variants. (B) Gel filtration column chromatography. Top, His-tagged recombinant JRAB variants were subjected to SDS–PAGE, followed by CBB staining. Bottom, His-JRAB variants (20 μg) were subjected to Superdex200 PC3.2/8 gel filtration column chromatography. The starting material (or) and fractionated proteins (#3–12) were subjected to SDS–PAGE, followed by CBB staining. The results shown are representative of at least three independent experiments. (C) Top, representative fluorescence emission spectra of ANS bound to His-JRAB variants. Fluorescence spectrum of free ANS in buffer is shown for comparison. Bottom, relative ANS fluorescence intensities of JRAB variants. Values are compared with those of His-JRABwt. For multiple group comparisons, one-way ANOVA followed by the Tukey’s post hoc test was used. Note that His-JRAB∆CC exhibits more enhanced ANS fluorescence than His-JRAB∆CT and -JRABwt, indicating that His-JRAB∆CC adopts a conformation with more hydrophobic surfaces exposed to the solvent.
Last, we analyzed the purified proteins by 8-anilino-1-naphthalenesulfonic acid (ANS) fluorescence. The fluorescence emission of ANS increases when it is bound to an accessible hydrophobic surface or cavity of a protein (Stryer, 1965). JRAB∆CC induced a slight enhancement in ANS fluorescence relative to JRABwt and JRAB∆CT (Figure 2C), indicating that it has more hydrophobic surface accessible to ANS than the other two proteins. Together these results demonstrate that JRAB∆CT and JRAB∆CC adopt closed and open forms, respectively.
Inhibition of JRAB/MICAL-L2 conformational plasticity alters the “dancing style” of cell groups during wound healing
To examine the involvement of JRAB/MICAL-L2 conformational plasticity in collective cell migration, we confirmed that there is no great difference in expression level between MTD-1A cells stably expressing GFP-tagged JRABwt, JRAB∆CC, and JRAB∆CT previously prepared (Sakane et al., 2012; Supplemental Figure S2) and then subjected them to a wound-healing assay, visualized by time-lapse confocal microscopy (Figure 3A and Supplemental Videos S1–S3). Groups of cells expressing GFP-JRAB∆CT migrated strongly in a fixed direction. By contrast, in groups expressing JRAB∆CC, cells formed ruffles one by one and moved in random directions. Clusters of cells expressing GFP-JRABwt exhibited an intermediate phenotype. Note that significant dissociation of cell–cell contact based on E-cadherin was not observed in three cell populations (Supplemental Figure S3), although cell–cell contact at the moving front seems to dissociate easily in the cell cluster expressing JRAB∆CC rather than the others (Supplemental Videos S1–S3). We supposed that prominent ruffles without thick F-actin bundles and a zigzag front line of the cluster caused by JRAB∆CC might result in such an appearance.
FIGURE 3:

Inhibition of JRAB/MICAL-L2 conformational change alters the “dancing style” of cell groups during wound healing. (A) Confluent monolayers of MTD-1A cells expressing GFP-JRABwt, GFP-JRAB∆CT, or GFP-JRAB∆CC were scratched, followed by observation under a time-lapse microscope for >12 h. Each image was captured at the indicated time (minutes). Scale bar, 50 μm. Video images are shown in Supplemental Videos S1–S3. (B) Volume rendering of MTD-1A cells expressing GFP-JRABwt, GFP-JRAB∆CC, or GFP-JRAB∆CT was prepared using VoTracer software and shown as 3D images consisting of two spatial (XY) axes and one time-lapse (T) axis. Cross-sections of XY and XT planes of the top right 3D image are shown together. (a) GFP-JRABwt, (b) GFP-JRAB∆CT, (c) GFP-JRAB ∆CC. Schematic illustrates the “dancing style” of cells expressing GFP-JRAB∆CT (precision dancing) or GFP-JRAB∆CC (awa-odori). Video images are shown in Supplemental Videos S4–S6.
We also performed a wound-healing assay using MTD-1A cells expressing either Venus-tagged Rab13DA or Venus alone. The behavior of the cell population expressing Venus-Rab13DA is similar to that of the cell group expressing GFP-JRAB∆CC rather than the others (Supplemental Figure S4A). In addition, we examined the conformational change of JRAB/MICAL-L2 under the effect of activated Rab13 in the MTD-1A cell cluster. For this purpose, we prepared the GST-tagged JRAB-CC5 (aa 806–960), which is expected to bind to JRAB-CH + LIM but not to Rab13DA according to our model (Figure 1). Pull-down assays using GST-JRAB-CC5 indicated that GST-JRAB-CC5 interacts with GFP-JRAB-CH + LIM but not with GFP-Rab13DA, whereas GST-JRAB-C interacts with both proteins (Supplemental Figure S4B). The same pull-down assays revealed that the expression of Venus-Rab13DA increases the open form of endogenous JRAB/MICAL-L2 in the cluster of MTD-1A cells compared with the cluster of the cells expressing Venus-Rab13DN (Supplemental Figure S4C). These observations validated the involvement of Rab13 in the conformational change of JRAB/MICAL-L2.
We next visualized three sets of time-lapse images of the wound-healing assay (hereafter, JRABwt, JRAB∆CC, and JRAB∆CT) using volume rendering (Figure 3B and Supplemental Videos S4–S6) as 3D images consisting of two spatial (XY) axes and one time-lapse (T) axis. Our visualization revealed notable spatiotemporal dynamics of each group. The rendering results of JRAB∆CC were usually complex, and it was difficult to extract a common denominator from the image set (Figure 3Bc); roughly speaking, they were closer to random than those of JRAB∆CT and JRABwt. The XT-image of JRAB∆CC also revealed the complex dynamics of the population behavior over time (in particular, the boundary between the population and wound regions). The rendering results and the XT-images of JRAB∆CT and JRABwt contain a layered geometry of gentle slopes, which were geometrically close to a straight line (Figure 3B, a and b), suggesting that their speeds of population movement were close to constant. The main difference between the populations of JRAB∆CT and JRABwt was that the slopes of JRABwt contained several holes (Figure 3Ba)—black/dark regions compared with distinctive slope lines in spatiotemporal space, which are generated by the JRAB∆CC-type behavior. In other words, the phenotype of JRAB∆CC sometimes breaks into that of JRAB∆CT (the slope of a straight line), resulting in the disruption of the slope. Collectively two conformational mutants exhibit distinctive “dancing styles”; the behavior of the cell population expressing GFP-JRAB∆CT is akin to precision dancing, whereas that of the cell population expressing GFP-JRAB∆CC resembles awa-odori, Japanese traditional dance (as the song goes, “Dancing fools and watching fools are fools both the same, so why not dance?”; schematics in Figure 3B, b and c). Clusters of cells expressing GFP-JRABwt exhibited an intermediate phenotype (Figure 3Ba).
Roles of the open and closed forms of JRAB/MICAL-L2 in cell clusters during wound healing
To elucidate how the open and closed forms of JRAB/MICAL-L2 exhibit distinctive “dancing styles,” we examined in more detail the differences between cell clusters expressing JRAB∆CT and JRAB∆CC. First, we categorized the thickness of the actin bundle at the free edge into four classes (++, +, ±, −; examples in Figure 4A) and then counted the number of cells belonging to each class. Statistical analyses revealed that expression of GFP-JRAB∆CT increased the proportion of cells in the ++ class, whereas expression of GFP-JRAB∆CC increased the proportion of cells in the − class (Figure 4A, histograms). These results indicate that formation of thick actin bundles at the free edge is enhanced by the closed form of JRAB/MICAL-L2 but inhibited by the open form.
FIGURE 4:

Roles of the open or closed forms of JRAB/MICAL-L2 in cell clusters during wound healing. (A) Left, classification of the quality of F-actin bundles (++, +, ±, –). Right, histogram showing the proportion of cells in each class. A one-way ANOVA followed by Tukey’s post hoc test was used for multiple group comparisons. Differences were assessed using a two-sided test and considered significant when p < 0.05. (B) Superresolution images of F-actin at the edges of the cell clusters. MTD-1A cells expressing either GFP-JRAB∆CC or GFP-JRAB∆CT were stained with rhodamine–phalloidin (red). Note that cells expressing GFP-JRAB∆CT show several F-actins radiating out from the thick F-actin bundles, whereas cells expressing GFP-JRAB∆CC contain a fine meshwork of F-actin. Boxes, 36.41 × 36.41 × 2.10 μm. (C) Confocal microscopic images of focal adhesion in MTD-1A cells expressing GFP-JRABwt, GFP-JRABΔCC, or GFP-JRABΔCT stained with an anti-vinculin antibody (red). Right, enlarged images. Dots and arrowheads indicate premature and mature focal adhesion, respectively. Scale bars, 20 μm. (D) Cell contraction assay visualizes traction forces as wrinkles that appear on the substrate along the borders of colonies. Scale bar, 100 μm. (E) Quantitation of traction force index, defined as the number of wrinkles parallel to colony borders. All differences are statistically significant (means ± SD, the number of analyzed lines drawn perpendicular to different cell colony borders, n = 107, independent experiment number, N = 4–6, p < 0.001; ANOVA followed by Tukey’s post hoc test). (F) Schematic side view of the GFP-JRAB∆CT cell, which induces wrinkles particularly strongly.
We next examined the detailed structure of cells at the free border using superresolution microscopy. Superresolution images revealed the fine meshwork of filamentous actin (F-actin) generated by GFP-JRAB∆CC (Figure 4B, top). In cells expressing GFP-JRAB∆CT, several F-actins radiated from the thick bundle and seemed to project onto the growth surface adjacent to the cell (Figure 4B, bottom).
Therefore we analyzed structures involved in the cell–matrix adhesion, that is, focal adhesions (FAs). Cell clusters expressing JRAB∆CT exhibited prominent staining of long, vinculin-positive structures at the free edge, whereas those expressing JRAB∆CC exhibited punctate staining of shorter structures (Figure 4C). Long and short vinculin-positive structures indicate mature and immature FAs, respectively. These results suggest that closed JRAB/MICAL-L2 may form mature FAs at the tip of F-actins radiating from the thick F-actin bundle. It is conceivable that the traction force is generated in GFP-JRAB∆CT–expressing cell clusters via FAs. To identify the traction force regulated by JRAB/MICAL-L2, we developed silicone elastomer–coated dishes and visualized the traction force as wrinkles (Saito et al., 2014). Prominent wrinkles parallel to the edge were observed around the edges of GFP-JRAB∆CT–expressing cell clusters (Figure 4D). By contrast, wrinkles were seldom observed at the edges of GFP-JRAB∆CC–expressing cell clusters (Figure 4D). According to the traction force index calculated from the number of the wrinkles, the constructs could be ranked in order of decreasing strength as follows: JRAB∆CT, JRABwt, and JRAB∆CC (Figure 4E). These data suggest that the closed form of JRAB/MICAL-L2 may be involved in generation of traction force through F-actins radiating outward from the thick bundle in order to pull the cell group (Figure 4F).
Next we investigated the rear cells of each group. At the junctional level, the sizes of individual cells (i.e., the areas surrounded by F-actin) were larger in groups expressing GFP-JRAB∆CT than in those expressing GFP-JRAB∆CC or controls (Supplemental Figure S5A). At the basal level, the stress fibers were rarely observed in groups expressing GFP-JRAB∆CC; however, expression of GFP-JRAB∆CT enhanced formation of stress fibers (Supplemental Figure S5B). Such actin cytoskeletal regulation mediated by GFP-JRAB∆CT at the basal level may impair the formation of stable cell–cell adhesion, resulting in expanded cell area at the junctional level. To confirm this, we examined spheroid formation by cells expressing each JRAB variant using the hanging-drop culture method (Yonemura, 2014). Cells expressing GFP-JRAB∆CT formed smaller spheroids than those expressing GFP-JRAB∆CC (Supplemental Figure S5C), suggesting that cells expressing the closed form of JRAB/MICAL-L2 have difficulty in maintaining clusters.
Statistical motion analysis of cell populations expressing JRABwt or conformational mutants
To corroborate the significance of conformational plasticity of JRAB/MICAL-L2 in collective cell migration, we quantitatively analyzed the dynamics of JRAB∆CC, JRAB∆CT, and JRABwt populations using an optical flow approach.
For a given time-lapse image set, the optical flow produced a speed vector field at each time point (i.e., a time-varying speed field), such that the vector at each pixel represented the local motion of cell population (speed and direction; Figure 5A and Supplemental Videos S7–S9). Then the following statistical analyses of these fields were applied to characterize the behavior of each population.
FIGURE 5:

Computational analyses of group behavior of cells expressing JRABwt, JRAB∆CC, or JRAB∆CT during wound healing, using an optical flow approach. (A) Speed vector field at each time point. The vector at each pixel represents speed and direction. Video images are shown in Supplemental Videos S7–S9. (B) Directional analysis. The angle is given by the normalized speed vector (blue) and the unit x-axis vector (red). (C) Angle histogram. The horizontal and vertical axes of the angle histogram present angle range (polar angle) and its normalized frequency, respectively. The angle histogram of different data sets within each population type is indicated by different colors. The angle histogram of the average for GFP-JRABwt, GFP-JRAB∆CC, and GFP-JRAB∆CT is indicated by green, blue, and red, respectively. (D) Kurtosis of angle histogram. The kurtosis of angle histogram was calculated as described in Materials and Methods. The minimum (min; red), maximum (max; green), and average (ave; blue) kurtosis values of the angle histogram within each population type were examined. For a graph of a given function, kurtosis measures its peakedness, which represents sharpness (or bluntness) relative to a Gaussian function. A perfect Gaussian distribution gives ku = 0, and positive (negative) ku corresponds to a sharper (blunter) shape. (E) Top, 2D motion histogram. For a given time-varying speed vector field, let the starting points of all vectors be the origin (the center of the 2D histogram). The 2D motion histogram was calculated by counting the vectors whose endpoint was located at each pixel. The 2D motion histograms for all data sets of each population type are shown in Supplemental Figure S6. Bottom, 2D median histogram. The histogram value was converted into a probability distribution by dividing its frequency total in order to normalize the difference in the time length of the data. The median histogram consists of the median values of all motion histograms of each population type and excludes outliers of speed vectors. The spatial space was quantized by intervals of 0.1 (0.1 subpixel). The median histogram is visualized using a pseudocolor image in which color at the pixel Xik is given by a Hue color function whose value is equal to log (1 + fik)1/5. (F) PCA contribution rate Cr. The PCA of the 2D median histogram for each population with respect to each population average was computed as described in Materials and Methods. Consider the PCA principal values λ1, λ2 ∈ R, λ1 ≥ λ2, and their corresponding principal axes e1, e2 ∈ R2, which are defined by the eigensystem of a 2 × 2 covariance matrix. The contribution rate of PCA is defined by Cr = λ1/(λ1 + λ2), where 0.5 ≤ Cr ≤ 1. If Cr is close to 0.5 (or 1), then histogram probabilities are isotropically (or anisotropically) distributed. (G) PCA ellipses of each population. PCA ellipse consists of the eigenvector and singular values  of the PCA. Red, GFP-JRAB∆CC; green, GFP-JRABwt; blue, GFP-JRAB∆CT.
To extract directional characteristics of local motion for each, we examined the angle histogram and its kurtosis (Figure 5, B–D). Most graphs of the histograms were close to a Gaussian distribution, with the exception of a few JRAB∆CC graphs that had another peak located opposite the Gaussian peak (Figure 5C). This pattern indicates that the majority of their local motions were in a particular direction, corresponding to the peak of the graph (distribution mean). The JRAB∆CT and JRABwt graphs possess distinctively higher peak values and lower variances than the JRAB∆CC graphs, which are close to flat (Figure 5C). Because the variance of the distribution represents how their directions deviated from the mean, this pattern implies that the JRAB∆CT and JRABwt populations moved anisotropically, whereas the JRAB∆CC population moved more isotropically/randomly. According to the average graphs (Figure 5C), the order of decreasing anisotropy was JRAB∆CT, JRABwt, and JRAB∆CC. The kurtosis graph corroborates these results (Figure 5D). The average kurtosis of JRABwt was very close to zero, and the direction of JRABwt population movement corresponded approximately to a Gaussian distribution. All kurtosis values within the JRAB∆CC graphs were less than zero; thus the JRAB∆CC population moved more randomly than the JRAB∆CT and JRABwt populations. The average kurtosis of the JRAB∆CT population was greater than that of JRABwt because the maximum kurtosis was the same but the minimum kurtosis was close to zero; thus the movement of the JRAB∆CT population is more anisotropic than that of the JRABwt population.
Although the angle histogram revealed interesting dynamic features of each cell population (JRAB∆CC, JRAB∆CT, and JRABwt), this analysis used only directional information of speed vectors. Therefore we generated a two-dimensional (2D) motion (median) histogram of the time-varying speed field (Figure 5E and Supplemental Figure S6) and performed principal component analysis (PCA) in order to simultaneously characterize the speed and direction for each population type. PCA, a multidimensional generalization of variance, provides a set of linearly uncorrelated directions and their corresponding magnitudes (eigenanalysis). In other words, the PCA provides information about the distribution of the speed vectors in the spatial domain defined by two unit axes and their corresponding magnitudes. We also used the PCA contribution rate Cr, which evaluates the anisotropy of population dynamics in our case. Here Cr is defined by λ1/(λ1 + λ2), where the PCA eigenvalues (λ1, λ2) were calculated based on the 2D median histograms using the equations shown in Materials and Methods. The 2D median histograms can be understood as an ellipse with major and minor axes: the two unit PCA axes (eigenvectors) with their corresponding magnitudes (square root of λ1 and λ2).
Figure 5F shows the PCA contribution rate Cr of the 2D median histograms (Figure 5E, bottom) for each population. If Cr is close to 0.5 (or 1), the population dynamics is isotropic (or anisotropic). Figure 5G illustrates the PCA ellipses for each population. Roughly speaking, the horizontal and vertical axes approximate how the speed and angle of local motions are distributed, respectively. This Cr-based analysis reveals that the JRABwt population was the most efficient (in this study, we consider that a population is efficient if it tends to undergo anisotropic motions), followed by the JRAB∆CT and JRAB∆CC populations. Supplemental Figure S7A shows Cr with respect to the speed vector averaged over all population types and its corresponding PCA ellipses (see Figure 5, F and G, for comparison with the in-population PCA results). Although the difference between the JRAB∆CT and JRABwt populations is smaller than those in Figure 5F, the conclusion is the same.
At first glance, the JRAB∆CT population might be expected to be more efficient than the JRABwt population because the former had the highest kurtosis based on our angle analysis (Figure 5, C and D). On the other hand, the speed vector magnitudes, which were not considered in the angle analysis, cause the JRABwt population to have the highest Cr. Therefore we hypothesized that large movements (high-speed local motions) of the JRABwt population would be more concentrated in one direction (i.e., more ordered) than those of the JRAB∆CT population.
Conformational plasticity of JRAB/MICAL-L2 makes the cell population more efficient in terms of anisotropy in high-speed motions
To test the hypothesis, we first analyzed the speed distributions of each population via a speed histogram (Figure 6A) in which each bin contained the frequency (0–100%) of speed vectors according to magnitude. In Figure 6A, three frequency curves (red, green, and blue, corresponding to JRAB∆CC, JRABwt, and JRAB∆CT, respectively) closely intersect each other, and we estimated that the JRAB∆CC and JRAB∆CT population frequencies interchanged around a speed of  , with the JRABwt frequency located between them.
FIGURE 6:

PCA for local motion of JRABwt, JRAB∆CC, and JRAB∆CT populations. (A) Speed histogram indicating the frequency (0–100%) of speed vectors in each bin according to magnitude. Inset, zoom at  . Red, GFP-JRAB∆CC; blue, GFP-JRAB∆CT; green, GFP-JRABwt. (B) Probability of speed vector within four speed intervals.
  is the speed magnitude. Blue,
  ; red,
  ; green,
  ; yellow,
  . (C) PCA contribution rate Cr for each speed interval. Blue,
  ; red,
  ; green,
  ; yellow,
  . (D) PCA ellipses of each population within four speed intervals. Blue,
  ; red,
  ; green,
  ; yellow,
  . (E) Kurtosis within four intervals:
  . Red, GFP-JRAB∆CC; blue, GFP-JRAB∆CT; green, GFP-JRABwt. (F) Working model of collective cell migration regulated by JRAB/MICAL-L2 conformational plasticity. The cell population expressing JRAB∆CT exhibits excessive rigidity, whereas the one expressing JRAB∆CC loses directionality. For efficient collective cell migration, JRAB/MICAL-L2 must be able to change its conformation freely depending on the situation. The arrows indicate how each cell population is constrained in terms of its movement (note that these are not speed vectors).
According to the speed histogram (Figure 6A), we divided the speed interval into four groups ( ,
,  ,
,  , and
, and  ) of the 2D median histogram, where
  is the magnitude of the speed. Figure 6B shows the ratio of speed distributions within each population; as expected, the JRAB∆CT and JRABwt populations produced much larger movements than did the JRAB∆CC population.
We applied PCA to four speed intervals of the 2D median histogram. Figure 6, C and D, illustrates the PCA contribution rate Cr and the corresponding PCA ellipse for each speed interval. The Cr of large movements ( ) in the JRABwt population were smaller than those of JRAB∆CT (Figure 6C). Note that the major PCA axes of large movements (Figure 6D) are almost orthogonal to those of Figure 5G. Thus smaller Cr (close to 0.5) represents lower variance in movement direction, in contrast to Figure 5G. This observation implies that the large local motions in the JRABwt population were more concentrated in one direction than those of JRAB∆CT (i.e., our hypothesis holds). Supplemental Figure S7B corresponds to Figure 6, C and D, and the interpretation remains the same. In fact, further angle analysis (Figure 6E) for each interval revealed the highest kurtosis value in the interval
  of the JRABwt population. Simultaneous analysis of speed and direction (PCA) showed that large movements, which occupied 35–45% of movements according to our speed analysis (Figure 6B), characterize the JRABwt and JRAB∆CT populations. Consequently the JRABwt population is more efficient than the JRAB∆CT population in terms of anisotropy of high-speed motions (see also Supplemental Figure S7B). Taken together, these data strongly support the idea that conformational plasticity of JRAB/MICAL-L2 is required for efficient collective cell migration, namely the open or closed form of JRAB/MICAL-L2 alone is insufficient (Figure 6F).
Collective cell migration in collagen gels
Finally, to determine the physiological significance of JRAB/MICAL-L2 structural plasticity in collective cell migration, we used a lentiviral expression system to generate Madin–Darby canine kidney (MDCK) cells expressing GFP-JRABwt, GFP-JRAB∆CC, or GFP-JRAB∆CT and performed collagen gel overlay culture (Ishida et al., 2014) with them. Using this method, we observed collective migration from the periphery toward the center of the sheet based on the folding of the sheet of MDCK cells, ultimately resulting in the formation of a lumen structure within the collagen gel. MDCK cells expressing GFP-JRABwt formed a lumen as expected, whereas expression of GFP-JRAB∆CC or GFP-JRAB∆CT resulted in formation of multiple lumens (Figure 7). These results demonstrate that deficiency in JRAB/MICAL-L2 conformational plasticity is disadvantageous for collective cell movement in a 3D environment.
FIGURE 7:

Three-dimensional collective cell migration in collagen gel. Cross-sectional views, XZ- and YZ-plane are shown together. Scale bars, 50 μm. The results shown are representative of at least three independent experiments.
DISCUSSION
In this study, we demonstrated that “law and order” in the moving cell population could be provided simply by the conformational plasticity of single molecule, JRAB/MICAL-L2, contrary to all expectations. Our accumulated data supported a model in which JRAB/MICAL-L2 is induced to undergo a conformational change by Rab13; however, definitive proof was lacking, and the mode of interplay between them remains elusive. Because the recombinant protein of JRAB/MICAL-L2 was extremely hard to crystallize, we verified the model through a combination of bioinformatic and biochemical analyses. Our structural models of complexes (JRAB-C–Rab13 and JRAB-C–JRAB-N) revealed that Rab13 and JRAB-N compete for binding with JRAB-C and that this competition leads to a release of the intramolecular interaction. Consistent with this, wound-healing assays using cells expressing a JRAB/MICAL-L2 fluorescence resonance energy transfer (FRET) probe indicated the conformational plasticity of JRAB/MICAL-L2 in populations of moving cells (Supplemental Figure S8 and Supplemental Video S10). Previously we established two deletion mutants, JRAB∆CC and JRAB∆CT (Sakane et al., 2010). Our present results demonstrated that JRAB∆CT and JRAB∆CC adopt a closed and open form, respectively, based on results from several methods (pull-down assay, ANS analysis, and gel filtration chromatography). Live images of cell sheets revealed that groups of cells expressing GFP-JRAB∆CC or GFP-JRAB∆CT exhibited distinctive movements—awa-odori (Japanese dance–like carnival dance in Rio) or orderly precision dancing, respectively. The results of optical flow followed by kurtosis and PCA analysis demonstrated that in order to achieve well-balanced and efficient migration of cell groups, JRAB/MICAL-L2 must be able to change its conformation without limitation.
Our detailed investigations of cell populations expressing GFP-JRAB∆CC or GFP-JRAB∆CT revealed the roles of the open and closed forms of JRAB/MICAL-L2. The closed form of JRAB/MICAL-L2 generates a traction force at the free edge of the cell population, probably via formation of radial F-actins extending from the thick actin bundle followed by the maturation of FAs (Figure 4F), whereas JRAB∆CC impairs the generation of such force at the edge. The distinctive modes of collective cell migration caused by either JRAB∆CC or JRAB∆CT revealed by volume rendering and kurtosis analysis could be partly explained by such differences. In addition, given the results obtained from the PCA contribution rate Cr, the heterogeneity of the traction force in the cells at the front, which depends on the conformational plasticity of JRAB/MICAL-L2, may be required for efficient collective cell migration (Figure 6F). We do not know the detailed molecular mechanism allowing the closed form of JRAB/MICAL-L2 to promote the maturation of FAs. However, there are several possibilities. First, we found several actin-binding proteins (actinin-1, actinin-4, and filamins) preferentially interacting with the open form of JRAB/MICAL-L2. Such interplay between them may keep FAs from being mature. Conversely, the closed form of JRAB/MICAL-L2, without effects of the association with actinin-1, actinin-4, and filamins, may enhance the formation of FAs. Second, linkage between JRAB/MICAL-L2 and Rho family protein, which is one of the representative regulatory systems of actin cytoskeletal rearrangement, should not be excluded. There may be switching of the activation of Rho family protein, depending on the conformational change of JRAB/MICAL-L2; the closed form of JRAB/MICAL-L2 may generate a thick actin bundle with radial F-actins leading to maturation of FAs via activated RhoA, whereas activated Rac may increase focal contact rather than FAs under the effect of the open form of JRAB/MICAL-L2. These possibilities need to be pursued elsewhere.
Next we examined the follower cells and found that JRAB∆CT increased cell size at the junctional level and enhanced the formation of stress fibers at the basal level. The relationship between these two effects is unclear, but one possible explanation is that it is difficult for cells expressing JRAB∆CT to maintain stable cell–cell adhesions because the actin cytoskeleton undergoes a spatial shift from cell–cell adhesion to cell–matrix adhesion, as previously reported (Maruthamuthu et al., 2011), thereby increasing the area of the cell at the junctional level. On the contrary, the open form of JRAB/MICAL-L2 regulates the actin cytoskeleton to maintain appropriate cell area at the junctional level (i.e., stable cell–cell junctions), and therefore JRAB∆CC generates fewer stress fibers than JRAB∆CT. The results of the hanging-drop culture assay also suggest that JRAB∆CC maintains more stable cell–cell adhesion, resulting in larger spheroids than those formed by control cells or those expressing JRAB∆CT. We previously showed several lines of evidence suggesting that open-form JRAB/MICAL-L2 maintains more stable cell–cell adhesion than closed-form JRAB/MICAL-L2; actinin-4 preferentially interacts with JRAB∆CC, and the interaction between actinin-4 and JRAB∆CC mutually inhibits F-actin bundling activity; and stabilization of F-actin mediated by JRAB-N is impaired by JRAB-C (Sakane et al., 2012). Collectively these findings support our hypothesis.
Finally, we demonstrated the physiological importance of JRAB/MICAL-L2 conformational plasticity. In general, under 3D conditions, cell sheets turn up at the edges, followed by formation of a single lumen. MDCK cell sheets expressing GFP-JRABwt formed flat single lumens, whereas cell sheets expressing GFP-JRAB∆CC or GFP-JRAB∆CT formed multiple lumens. Although the difference between the phenotypes of JRAB∆CC and JRAB∆CT is subtle compared with the that observed in the 2D wound-healing assay, we found that lumens generated by cells expressing GFP-JRAB∆CC seemed to be closer to fusion than those generated by cells expressing GFP-JRAB∆CT. Given that multiple lumens initially form and then fuse with one another in the process of forming a single lumen, both JRAB∆CC cells and JRAB∆CT cells fail in the formation of a single lumen, but their endpoints seem to be different. In any case, we showed the importance of JRAB/MICAL-L2 conformational plasticity in the physiological environment. However, we do not know how a disturbance in the conformational change of JRAB/MICAL-L2 confers a disadvantage on collective migration in the 3D environment. To obtain more definitive conclusions on 3D lumen formation, further investigation will be needed.
MATERIALS AND METHODS
Plasmid construction
Mouse JRAB/MICAL-L2 mutants; CT1 (aa 901–1009), CT2 (aa 895–1009), CT3 (aa 877–984), CT4 (aa 877–1009), CT5 (aa 877–960), CC1 (aa 806–900), CC2 (aa 806–876), CC3 (aa 877–930), CC4 (aa 840–930), and CC5 (aa 806–960) were amplified by PCR using pCIneo-HA-JRAB/MICAL-L2 as a template. To generate enhanced GFP (EGFP) constructs, the JRAB-C (aa 806–1009), CC (aa 806–912), CT (aa 913–1009), CH + LIM (aa 1–260), and JRAB mutants were subcloned into pEGFP-C1. pEGFP-JRABwt, -JRABΔCC, and -JRABΔCT were generated as reported previously (Sakane et al., 2010). For production of the His-tagged recombinant proteins, cDNA encoding JRABwt, JRABΔCC, or JRABΔCT was subcloned into pcDNAHisMax. pGEX-6P-1-JRAB-CH + LIM and -JRAB-C have been previously described (Sakane et al., 2012), and pGEX-6P-1-JRAB-CC5 was generated in the same way. cDNAs encoding the dominant-active and dominant-negative mutants of mouse Rab13 (Rab13DA, Q67L and Rab13DN, T22N) were subcloned into pCIneo-HA, pRSET-A, or pEGFP-C1. Rab13DAΔC1, ΔC2, and ΔC3 (the character of these mutants is described later) were subcloned into pGEX-6P-1. To produce retrovirus-expressing, GFP-tagged proteins, we generated pMX-EGFP-JRABwt, -JRABΔCC, and -JRABΔCT as previously described (Kitamura et al., 2003; Sakane et al., 2012). pMX-Venus was prepared by PCR from pcDNA3-Venus obtained from A. Miyawaki (RIKEN Brain Science Institute), and cDNA encoding Rab13DA or Rab13DN fragment was subcloned into the vector. Each of GFP-JRABwt, GFP-JRABΔCC, and GFP-JRABΔCT fragments was individually inserted into the lentivirus transfer plasmid DNA, CSII-CMV-MCS-IRES-Bsd, described previously (Shikata et al., 2012). FRET-based JRAB indicator was constructed by assembling cDNA fragments encoding Venus, full-length JRAB, and cp173ECFP (Mizutani et al., 2010) into pRSET-B (Invitrogen, Thermo Fisher Scientific, Waltham, MA). To avoid unintentional recombination, humanized and Aequoria victoria–derived cDNA was used for Venus and cp173ECFP, respectively. cDNA of JRAB indicator was subcloned into pcDNA4-HMB (Invitrogen) and pMX (Kitamura et al., 2003) for mammalian expression and retrovirus preparation, respectively. All plasmids constructed in this study were sequenced using an ABI Prism 3100 genetic analyzer (Applied Biosystems, Thermo Fisher Scientific).
Antibodies
Rabbit anti-GFP antibody and rhodamine-phalloidin were from Invitrogen; mouse anti-vinculin antibody was from Sigma-Aldrich, St. Louis, MO; rat anti-E-cadherin antibody was from Takara; mouse anti–glyceraldehyde-3-phosphate dehydrogenase antibody was from Applied Biosystems. Rabbit anti-JRAB antibody was prepared as previously described, except that GST-JRAB-MID1 (aa 261–393) was used as an antigen (Sakane et al., 2010). Cy3-conjugated secondary antibodies and horseradish peroxidase–coupled secondary antibodies were obtained from Invitrogen and Jackson ImmunoResearch, West Grove, PA, respectively.
Cell culture
MTD-1A cells and MDCK cells were kind gifts from S. Tsukita and W. Birchmeier (Max-Delbrück-Center for Molecular Medicine, Berlin, Germany), respectively. Both cells were cultured in DMEM with 10% fetal bovine serum (FBS), 100 U/ml penicillin, and 100 μg/ml streptomycin. HEK293 cells were cultured in DMEM with 5% FBS, 1 mM sodium pyruvate, 100 U/ml penicillin, and 100 μg/ml streptomycin. These cells were maintained at 37°C in a water-saturated atmosphere of 95% air and 5% CO2.
Recombinant retrovirus preparation and infection
The pMX-EGFP vector containing JRAB/MICAL-L2 or its mutant, the pMX-JRAB indicator, the pMX-Venus vector containing Rab13DA or Rab13DN, or the pMX-Venus vector alone were transfected into PLAT-E cells as described previously (Morita et al., 2000). After a 48-h transfection, each culture supernatant was collected and filtrated through a 0.45-μm filter before infection. MTD-1A cells were infected with each recombinant retrovirus separately. After a 48-h culture, cells were subjected to further experiments. For imaging analyses, MTD-1A cells expressing GFP-tagged or Venus-tagged protein or JRAB indicator were selected based on fluorescence intensity and isolated by single-cell sorting on a JSAN desktop cell sorter (Bay Bioscience, Kobe, Japan).
Lentiviral vector–mediated gene expression
A self-inactivating lentiviral expression vector and two packaging-vector plasmids were obtained from the RIKEN BioResource Center (Ibaraki, Japan; Miyoshi et al., 1998). Using the lentiviral expression vector plasmid, lentiviral particles were prepared by standard transfection procedures using packaging-plasmid DNAs (pCAG-HIVgp and pCMV-VSV-G-RSV-Rev; RIKEN BioResource Center), and the resulting viral particles were used to introduce the transgene into MDCK cells. After transduction of the transgenes at a multiplicity of infection of 1–2, pools of the cultured cells resistant to blasticidin (20 μg/ ml) were selected and used for experiments. For imaging analyses, MDCK cells expressing GFP-tagged protein were selected based on fluorescence intensity and isolated by single-cell sorting on a JSAN desktop cell sorter (Bay Bioscience).
Wound-healing assay and live-cell imaging
Cells were seeded at a density of 4 × 10⁵ cells on 35-mm glass-based dishes (Matsunami Glass Ind., Kishiwada, Japan) and grown to confluence over 48 h. Wound edges were generated by scratching with a yellow pipette tip. After scratching, cells were washed three times with phosphate-buffered saline (PBS) and refed with culture medium. Live-cell images were obtained by an A1 confocal laser-scanning microscope using an inverted microscope (Ti; Nikon, Tokyo. Japan) equipped with a 40×/numerical aperture 0.95 Plan Apo objective (Nikon) and a stage-top incubator system (37°C, 5% CO2; Tokai Hit, Fujinomiya, Japan).
Pull-down assays
HEK293 cells were seeded at a density of 5 × 10⁵ cells on 60-mm dishes and transfected the next day with an appropriate amount of each plasmid using PEI-Max transfection reagent (Reed et al., 2006). After a 48-h incubation at 37°C, the cells were washed once and scraped from the dishes in PBS. The cells were lysed in 300 μl of buffer A (10 mM Tris-HCl, pH 8.0, 1 mM EDTA, 1% [wt/vol] Nonidet P-40, 150 mM NaCl, and 10 μM p-APMSF [p-amidophenyl)methylsulfonyl fluoride). The cell lysates were centrifuged at 4°C for 5 min at 16,100 × g, and each supernatant was incubated with the respective purified GST-JRAB mutant or GST-Rab13DAΔC3 (see later description) attached to glutathione-Sepharose beads and incubated for 90 min at 4°C. The beads were then washed with buffer A three times and resuspended in SDS sample buffer. Comparable amounts of the proteins that remained associated with the beads were separated by SDS–PAGE. The fraction of target protein bound to the affinity column was determined by Western blotting using an anti-GFP antibody.
Preparation of Rab13DA truncation mutants
To assess the interaction between Rab13 and JRAB/MICAL-L2, we first prepared recombinant Rab13DA protein. However, the expression level of full-length Rab13DA (aa 1–202) was not sufficient for repeated experiments, regardless of whether it was GST or His tagged. To increase the expression level, we prepared C-terminal–truncated mutants such as those used previously for crystallization of other small G proteins. All small G proteins contain switch I and switch II regions, whose spatial positions change drastically between GTP- and GDP-bound forms, as well as an interswitch region. Cross-species mammalian sequence analyses have revealed five RabF regions within the sequence that distinguish Rab proteins from other Ras superfamily members and four RabSF regions that are highly conserved within each Rab subfamily (Pereira-Leal and Seabra, 2000). In addition, complementarity-determining regions (CDRs) 1–3 are believed to be exposed to the surface in the 3D structure. Regarding Rab–effector complexes, there are three types of combinations of Rab protein interaction sites: 1) switch and interswitch, 2) type 1 plus CDR1 and CDR3, and 3) type 1 plus CDR1, CDR2, and CDR3 (Wu et al., 2005; Stein et al., 2012). Multiple alignments of Rab13 and other Rab proteins revealed the position of CDR3 (SF4), as shown in Supplemental Figure S1C. On the basis of this alignment, we prepared three Rab13DA truncation mutants: Rab13DA∆C1 (aa 1–166), Rab13DAΔC2 (aa 1–180), and Rab13DA∆C3 (aa 1–190). Among these mutants, only Rab13DA∆C1 lacks CDR3 (SF4). In the pull-down assay, GFP-Rab13DA∆C2 and GFP-Rab13DA∆C3 bound to GST-JRAB-C, whereas GFP-Rab13DA∆C1 and GFP-Rab13DN did not (Supplemental Figure S1D). These results indicate that CDR3 (SF4) is required for the Rab13–JRAB/MICAL-L2 interaction. We measured the expression level of recombinant Rab13DA∆C2 and Rab13DA∆C3 and found that the Rab13DA∆C3 was much more highly expressed than Rab13DA full-length or Rab13DA∆C2. Therefore, in this article, we used Rab13DA∆C3 for further analysis.
Establishment of a structural model of JRAB-C and models of the JRAB-C–JRAB-N and JRAB-C–Rab13 interactions
Structures of an ideal α-helical conformation of putative helices 1–5 and of random conformations for loops 1–4 were constructed by SYBYL-X, and the electrostatic potentials and hydrophobic properties on the molecular surfaces of the structures were calculated using eF-surf (Kinoshita and Nakamura, 2004).
Helices 1 and 2 and the first half of helix 3 are involved in the interaction between JRAB-N and JRAB-C, indicating that these three helices should be located near each other. Coiled-coil prediction (McDonnell et al., 2006) revealed that helix 1 has the potential to form a coiled-coil within itself or with other helices, such as helix 3 or 5. Therefore we positioned helices 1–3 so that helices 1 and 2 and the first half of helix 3 were located close together and the hydrophobic regions of helices 1 and 3 contacted each other to form a coiled-coil–like conformation. On the other hand, helices 2–5 and loop 4 are involved in the interaction between Rab13 and JRAB-C. In addition, the features of the three effector proteins that we used in the structural alignment revealed that in general, two antiparallel helices are involved in Rab-binding via hydrophobic and electrostatically negative regions. On the basis of these observations, we positioned helices 4 and 5 so that helices 2 and 3 and helices 4 and 5 were antiparallel and located close together; consequently the surface properties of the putative Rab-binding site on JRAB-C resemble those in the three aligned effector proteins (Figure 1C). To construct a model of the interaction between JRAB-C and JRAB-N (LIM) or Rab13, we modeled the structures of JRAB-N (LIM) and Rab13 by comparative modeling (Fugue [ Shi et al., 2001] and Modeller [ Eswar et al., 2006]) and calculated their surface properties (eF-surf [ Kinoshita and Nakamura, 2004]). The structural model of LIM was placed on the JRAB-C model such that the protein-binding residues in LIM predicted by PSIVER (Murakami and Mizuguchi, 2010) were in contact with the putative LIM-binding regions in the JRAB-C model. The Rab13 model was placed on JRAB-C based on the known structures of the three Rab–effector complexes.
ANS fluorescence spectra measurement
Fluorescence emission spectra of ANS were collected from 400 to 600 nm at an excitation wavelength of 395 nm with a Hitachi F-4500 fluorescence spectrophotometer (Hitachi High-Technologies, Tokyo, Japan) at 25°C. Protein and ANS concentrations were 30 μg/ml and 250 μM, respectively.
Volume rendering
Volume rendering is a popular computer graphics technique for visualizing 3D images and has been used in many scientific fields (Engel et al., 2004). Basically, volume rendering generates a 2D image on a view plane relative to a given view (camera position and direction) by integrating 3D image intensity according to a given transfer function that defines opacity and pseudocolor values. We used the VoTracer software for volume rendering (Ijiri, 2013). We focused on GFP fused to JRABwt, JRAB∆CC, or JRAB∆CT by manually adjusting a multidimensional transfer function (Kniss et al., 2002; intensity and its gradient field) implemented in the VoTracer.
Local motion estimation
We used an optical flow approach to extract local motions. Optical flow is a popular motion analysis approach in computer vision and video analysis, and many different optical flow models have been proposed. We initially examined three popular models (Horn and Schunck, 1981; Lucas and Kanade, 1981; Farnebäck, 2003) and their parameters implemented in OpenCV (Bradski, 2000). We selected Farnebäck’s (2003) algorithm with a Gaussian filter option (and window size is equal to 35) because of its high stability and robustness on our data.
For the optical flow approach, the motion orientations of all time-lapse images were aligned from left to right; that is, flopped images were used if the original images captured cell population movement from right to left. The JRAB∆CC, JRAB∆CT, and JRABwt data consist of 10, 7, and 10 time-lapse image sets, respectively. The spatial domain image size of all images is equal to 512 × 512 pixels. The temporal domain image sizes are given in Table 1,
Table 1:
Temporal domain image size.
| M | T | |
|---|---|---|
| JRAB∆CC | 4 | 318 |
| 2 | 245 | |
| 4 | 483 | |
| JRAB∆CT | 4 | 197 |
| 3 | 256 | |
| JRABwt | 3 | 288 |
| 5 | 167 | |
| 2 | 389 |
M and T, numbers of data sets and temporal size (i.e., number of images in a time-lapse data set), respectively. Total number of speed vectors was 2,025,586,688.
Directional analysis
For a given time-varying speed field, an angle histogram was calculated; the angle is given by the normalized speed vector and the unit x-axis vector because the orientations of the time-lapse images were aligned from left to right. The horizontal and vertical axes of the angle histogram present angle range and its normalized frequency, respectively. The angle range was equally quantized by N histogram bins (N = 64 in our experiments) with a periodic boundary condition. The average angle histograms for each population type were also calculated by shifting histogram peaks to match them.
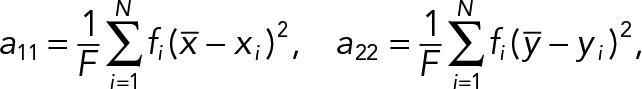
The kurtosis of angle histogram was calculated using the following equations. For a given angle histogram with N bins, let xi ∈ R and fi = f(xi) ∈ (0, 1), i = 1, 2, 3..., N be the ith interval center of the histogram bin and its corresponding frequency, respectively. The histogram kurtosis is given by
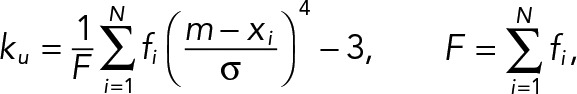 |
 |
where F is a frequency sum, m is a frequency-weighted average of xi, and σ is the variance of the histogram. The minimum (min), maximum (max), and average (ave) kurtosis values of the angle histogram within each population type are examined.
Two-dimensional median histogram
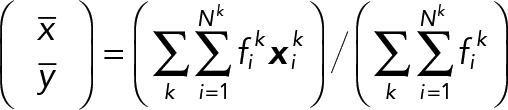
Consider a 2D histogram that is equivalent to a grayscale image quantizing a spatial 2D space; thus each histogram bin becomes an image pixel. Assume that the coordinate origin is located at the center of the 2D histogram (Figure 5E). For a given time-varying speed vector field, let the starting points of all vectors be the origin (the center of the 2D histogram). The 2D motion histogram was calculated by counting the vectors whose endpoint is located at each pixel. Then the histogram value was converted into a probability distribution by dividing its frequency total in order to normalize the difference in the time length of the data. To obtain robust statistical results, we used 2D median histograms as shown in Figure 5E, bottom, and Supplemental Figure S6. The median histogram consists of the median values of all motion histograms of each population type. The median histogram excludes outliers of speed vectors. In our experiments, we quantized the spatial space by intervals of 0.1 (0.1 subpixel).
For a given 2D histogram with  and
and 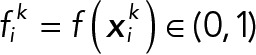 be the ith pixel center coordinates and its probability in each population, where k indicates a JRAB population group (ΔCC, ΔCT, and wild type [WT]).
In-population PCA
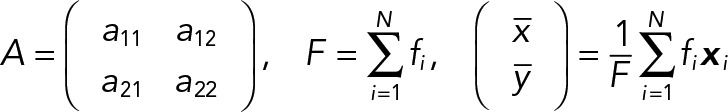
The PCA of the 2D median histogram for each population with respect to each population average was computed using the following equations. Consider the PCA principal values λ1, λ2 ∈R, λ1 ≥ λ2, and their corresponding principal axes e1, e2 ∈R2 which are defined by the eigensystem of a 2 × 2 covariance matrix. In our case, the covariance matrix A of the histogram is given by
 |
 |
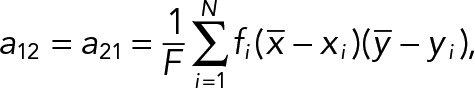 |
where N = Nk is a number of bins,  is the probability at the pixel coordinates
  of each population, k indicates a JRAB population group (ΔCC, ΔCT, and WT), F is a probability sum (note that it is not equal to 1 because of our median strategy), and
  is a probability-weighted average of
  . For calculating the eigensystem of A, we used the QR factorization algorithm (Francis, 1961) implemented in the linear algebra software package LAPACK (Anderson et al., 1999).
PCA contribution rate
The contribution rate of PCA is defined by Cr = λ1/(λ1 + λ2), where 0.5 ≤ Cr ≤ 1. If λ1 = λ2, then Cr = 0.5, and λ2 = 0 gives Cr = 1.
PCA with all-population average
In our analysis, we used the PCA via the average speed vector within each population type. Here we present another PCA result that consists of the speed vector averaged over all population types. The PCA of the 2D median histogram for each population with respect to the all-population average is computed by the same equations used in covariance matrix A, except for the average vector:
 |
where k indicates a JRAB population group (ΔCC, ΔCT, and WT).
Statistical analysis
One-way analysis of variance (ANOVA) followed by Tukey’s post hoc test was used for multiple group comparisons (Figures 2C and 4, A and E, and Supplemental Figure S8C). When assumptions of normality of the distribution or homogeneity of variances were not verified (Supplemental Figure S5A), Kruskal–Wallis ANOVA followed by Steel–Dwass post hoc test was used. Differences were assessed with a two-sided test and considered significant when p < 0.05.
Cell traction force assay
Relative magnitude of cell traction forces of clusters of MTD-1A cells expressing GFP-JRABwt, GFP-JRABΔCC, or GFP-JRABΔCT was evaluated using a modified version of a method originally developed to visualize cell traction forces based on wrinkling of deformable silicone cell substrates (Harris et al., 1980, 1981; Chrzanowska-Wodnicka and Burridge, 1996; Hinz et al., 2001; Castella et al., 2010). In the previous method, prepolymer silicone fluid was coated on a culture dish and polymerized by passing it through a burner flame for a few seconds so that wrinkles were generated on the originally planar substrate surface upon application of cellular traction forces. Here we instead coated a 35-mm-diameter glass-bottom dish with prepolymer silicone elastomers (Sylgard 184; Dow Corning Toray, Tokyo, Japan). No curing agent was added to the silicone elastomers. The dish was placed in an oven at 70°C to induce thermal expansion of the silicone substrates and then exposed to oxygen plasma (4 mA, 10 Pa, 1 min) using a plasma generator (SEDE-GE; Meiwafosis, Tokyo, Japan). The surface of the silicone substrates was thus hydrophilized, highly enhancing cell adhesiveness (Yokoyama et al., 2014) and increasing substrate stiffness (Saito et al., 2014), so that wrinkles with an amplitude of several hundred nanometers could be generated in a reversible manner on the functionalized surface in a direction perpendicular to traction forces.
Hanging-drop assay
To generate spheroids, we used the hanging-drop culture method (Yonemura, 2014). Briefly, MTD-1A cell solution (2.5 × 10⁵/ml) was seeded in 25-μl drops on a glass coverslip in a 60-mm dish. Cover slips were inverted and incubated for 3 d until spheroids formed.
Three-dimensional culture assay
A 1.6 mg/ml collagen type I gel (Cellmatrix type I-P; Nitta Gelatin, Osaka, Japan) was used for the collagen overlay assay (Ishida et al., 2014). An 8.0-mm-radius glass dish was filled with 150 μl of the collagen gel, onto which trypsinized cells (2.0 × 10³) were seeded. After culture for 3 or 5 d, a collagen gel solution (75 μl) was poured onto the cells, and the sample was incubated for 30 min at 37°C to induce gelation. The dish was then filled with culture medium. After 1 d, cells were fixed with 2% paraformaldehyde in PBS for 10 min, permeabilized with 0.5% Triton X-100 in PBS for 5 min, and blocked with 0.5% bovine serum albumin (Sigma-Aldrich) in PBS for 1 h. Samples were incubated with Alexa Fluor 555–phalloidin (1:300 dilution in PBS) overnight at room temperature. Fluorescence images were obtained using a confocal laser-scanning microscope (C1 confocal imaging system; Nikon) with a 60× objective.
Evaluation of JRAB indicator in vitro
HEK293 cells transiently expressing JRAB indicator were collected and lysed. Cell lysates were then directly subjected to spectral measurement by using an FP-6300 spectrofluorometer (Jasco, Hachioji, Japan) with 433-nm excitation.
FRET fluorescence imaging
FRET images were captured on an inverted microscope (Ti; Nikon) equipped with a 40×/NA Plan Apo objective (Nikon), cooled charge-coupled device camera (ANDOR iXon3), and 130-W mercury lamp (Intensilight C-HGFI; Nikon) with an FF01-442 excitation filter, an FF458-Di02 dichroic mirror, and emission filters (FF01-483 for enhanced cyan fluorescent protein and FF01-520 for Venus; Semrock, Rochester, NY).
Supplementary Material
Acknowledgments
We thank S. Yonemura (Tokushima University) and S. Kuroda (Tokyo University) for advice and suggestions; Y. Haraya for suggestions; C. Takida (our laboratory), T. S. Matsui and T. Araki (Nagoya Institute of Technology), and S. Shimazu (Nikon Instec) for technical assistance; T. Kitamura (Tokyo University) for providing reagents for retrovirus production; and A. Miyawaki (RIKEN BSI) for providing pcDNA3-Venus. This work was supported by Ministry of Education, Culture, Sports, Science and Technology KAKENHI Grants 20113004 (T.S.), 25111723 (A.S.), and 15H05954 (H.Y.), Japan Society for the Promotion of Science KAKENHI Grants 21390082, 15K15084 (T.S.), 22790293, 26460370 (A.S.), and 25430186, 25293079 (K.M.), the Naito Foundation (T.S.), the Uehara Memorial Foundation (A.S.), and the Kao Foundation for Arts and Sciences (A.S.).
Abbreviations used:
- ANS
8-anilino-1-naphthalenesulfonic acid
- CC
coiled coil
- CDR
complementarity-determining region
- CH
calponin homology
- CT
C-terminal
- FA
focal adhesion
- His
hexahistidine
- JRAB
junctional Rab13-binding protein
- MICAL-L2
molecules interacting with CasL-like 2
- PCA
principal component analysis
- PDB
Protein Data Bank
- WT
wild type.
Footnotes
This article was published online ahead of print in MBoC in Press (http://www.molbiolcell.org/cgi/doi/10.1091/mbc.E16-05-0332) on August 31, 2016.
REFERENCES
- Anderson E, Bai Z, Bischof C, Blackford S, Demmel J, Dongarra J, Du Croz J, Greenbaum A, Hammarling S, McKenney A, Sorensen D. LAPACK Users’ Guide, 3rd ed. Philadelphia, PA: Society for Industrial and Applied Mathematics; 1999. [Google Scholar]
- Bradski G. The OpenCV Library. 2000. Available at www.drdobbs.com/open-source/the-opencv-library/184404319 (accessed 1 November 2000)
- Castella LF, Buscemi L, Godbout C, Meister JJ, Hinz B. A new lock-step mechanism of matrix remodelling based on subcellular contractile events. J Cell Sci. 2010;123:1751–1760. doi: 10.1242/jcs.066795. [DOI] [PubMed] [Google Scholar]
- Chrzanowska-Wodnicka M, Burridge K. Rho-stimulated contractility drives the formation of stress fibers and focal adhesions. J Cell Biol. 1996;133:1403–1415. doi: 10.1083/jcb.133.6.1403. [DOI] [PMC free article] [PubMed] [Google Scholar]
- Engel K, Hadwiger M, Kniss JM, Lefohn AE, Salama CR, Weiskopf D. 2004. Real-Time Volume Graphics, In: SIGGRAPH ‘04, New York: ACM, article 29.
- Eswar N, Webb B, Marti-Renom MA, Madhusudhan MS, Eramian D, Shen MY, Pieper U, Sali A. Comparative protein structure modeling using Modeller. Curr Protoc Bioinformatics 2006. 2006 doi: 10.1002/0471250953.bi0506s15. 54, 5.6.1. [DOI] [PMC free article] [PubMed] [Google Scholar]
- Farnebäck G. Two-frame motion estimation based on polynomial expansion. In: Bigun J, Gustavsson T, editors. Lecture Notes in Computer Science, Vol. 2749. Heidelberg, Germany: Springer; 2003. pp. 363–370. [Google Scholar]
- Francis JGF. The QR transformation I. Computer J. 1961;4:265–271. [Google Scholar]
- Friedl P, Gilmour D. Collective cell migration in morphogenesis, regeneration and cancer. Nat Rev Mol Cell Biol. 2009;10:445–457. doi: 10.1038/nrm2720. [DOI] [PubMed] [Google Scholar]
- Friedl P, Locker J, Sahai E, Segall JE. Classifying collective cancer cell invasion. Nat Cell Biol. 2012;14:777–783. doi: 10.1038/ncb2548. [DOI] [PubMed] [Google Scholar]
- Gray RS, Cheung KJ, Ewald AJ. Cellular mechanisms regulating epithelial morphogenesis and cancer invasion. Curr Opin Cell Biol. 2010;22:640–650. doi: 10.1016/j.ceb.2010.08.019. [DOI] [PMC free article] [PubMed] [Google Scholar]
- Harris AK, Stopak D, Wild P. Fibroblast traction as a mechanism for collagen morphogenesis. Nature. 1981;290:249–251. doi: 10.1038/290249a0. [DOI] [PubMed] [Google Scholar]
- Harris AK, Wild P, Stopak D. Silicone rubber substrata: a new wrinkle in the study of cell locomotion. Science. 1980;208:177–179. doi: 10.1126/science.6987736. [DOI] [PubMed] [Google Scholar]
- Hinz B, Celetta G, Tomasek JJ, Gabbiani G, Chaponnier C. Alpha-smooth muscle actin expression upregulates fibroblast contractile activity. Mol Biol Cell. 2001;12:2730–2741. doi: 10.1091/mbc.12.9.2730. [DOI] [PMC free article] [PubMed] [Google Scholar]
- Horn BKP, Schunck BG. Determining optical flow. Artificial Intelligence. 1981;17:185–203. [Google Scholar]
- Hutagalung AH, Novick PJ. Role of Rab GTPases in membrane traffic and cell physiology. Physiol Rev. 2011;91:119–149. doi: 10.1152/physrev.00059.2009. [DOI] [PMC free article] [PubMed] [Google Scholar]
- Ijiri T. VoTracer: a volumetric image visualization and segmentation software. 2013. In: RIKEN: Image Processing Research Team. Available at www.riken.jp/brict/Ijiri/VoTracer/ (accessed 2013)
- Ishida S, Tanaka R, Yamaguchi N, Ogata G, Mizutani T, Kawabata K, Haga H. Epithelial sheet folding induces lumen formation by Madin-Darby canine kidney cells in a collagen gel. PLoS One. 2014;9:e99655. doi: 10.1371/journal.pone.0099655. [DOI] [PMC free article] [PubMed] [Google Scholar]
- Jones DT. Protein secondary structure prediction based on position-specific scoring matrices. J Mol Biol. 1999;292:195–202. doi: 10.1006/jmbi.1999.3091. [DOI] [PubMed] [Google Scholar]
- Kinoshita K, Nakamura H. eF-site and PDBjViewer: database and viewer for protein functional sites. Bioinformatics. 2004;20:1329–1330. doi: 10.1093/bioinformatics/bth073. [DOI] [PubMed] [Google Scholar]
- Kitamura T, Koshino Y, Shibata F, Oki T, Nakajima H, Nosaka T, Kumagai H. Retrovirus-mediated gene transfer and expression cloning: powerful tools in functional genomics. Exp Hematol. 2003;31:1007–1014. [PubMed] [Google Scholar]
- Kniss J, Kindlmann G, Hansen C. Multidimensional transfer functions for interactive volume rendering. IEEE Trans Vis Comput Graph. 2002;8:270–285. [Google Scholar]
- Konagurthu AS, Whisstock JC, Stuckey PJ, Lesk AM. MUSTANG: a multiple structural alignment algorithm. Proteins. 2006;64:559–574. doi: 10.1002/prot.20921. [DOI] [PubMed] [Google Scholar]
- Lucas BD, Kanade T. An iterative image registration technique with an application to stereo vision; 1981. In: Proceedings of the 7th International Joint Conference on Artificial Intelligence, Vol. 2, San Francisco: Morgan Kaufmann, 674–679. [Google Scholar]
- Maruthamuthu V, Sabass B, Schwarz US, Gardel ML. Cell-ECM traction force modulates endogenous tension at cell-cell contacts. Proc Natl Acad Sci USA. 2011;108:4708–4713. doi: 10.1073/pnas.1011123108. [DOI] [PMC free article] [PubMed] [Google Scholar]
- Marzesco AM, Dunia I, Pandjaitan R, Recouvreur M, Dauzonne D, Benedetti EL, Louvard D, Zahraoui A. The small GTPase Rab13 regulates assembly of functional tight junctions in epithelial cells. Mol Biol Cell. 2002;13:1819–1831. doi: 10.1091/mbc.02-02-0029. [DOI] [PMC free article] [PubMed] [Google Scholar]
- Mayor R, Carmona-Fontaine C. Keeping in touch with contact inhibition of locomotion. Trends Cell Biol. 2010;20:319–328. doi: 10.1016/j.tcb.2010.03.005. [DOI] [PMC free article] [PubMed] [Google Scholar]
- McDonnell AV, Jiang T, Keating AE, Berger B. Paircoil2: improved prediction of coiled coils from sequence. Bioinformatics. 2006;22:356–358. doi: 10.1093/bioinformatics/bti797. [DOI] [PubMed] [Google Scholar]
- Miyoshi H, Blomer U, Takahashi M, Gage FH, Verma IM. Development of a self-inactivating lentivirus vector. J Virol. 1998;72:8150–8157. doi: 10.1128/jvi.72.10.8150-8157.1998. [DOI] [PMC free article] [PubMed] [Google Scholar]
- Mizutani T, Kondo T, Darmanin S, Tsuda M, Tanaka S, Tobiume M, Asaka M, Ohba Y. A novel FRET-based biosensor for the measurement of BCR-ABL activity and its response to drugs in living cells. Clin Cancer Res. 2010;16:3964–3975. doi: 10.1158/1078-0432.CCR-10-0548. [DOI] [PubMed] [Google Scholar]
- Morimoto S, Nishimura N, Terai T, Manabe S, Yamamoto Y, Shinahara W, Miyake H, Tashiro S, Shimada M, Sasaki T. Rab13 mediates the continuous endocytic recycling of occludin to the cell surface. J Biol Chem. 2005;280:2220–2228. doi: 10.1074/jbc.M406906200. [DOI] [PubMed] [Google Scholar]
- Morita S, Kojima T, Kitamura T. Plat-E: an efficient and stable system for transient packaging of retroviruses. Gene Ther. 2000;7:1063–1066. doi: 10.1038/sj.gt.3301206. [DOI] [PubMed] [Google Scholar]
- Murakami Y, Mizuguchi K. Applying the Naive Bayes classifier with kernel density estimation to the prediction of protein-protein interaction sites. Bioinformatics. 2010;26:1841–1848. doi: 10.1093/bioinformatics/btq302. [DOI] [PubMed] [Google Scholar]
- Pereira-Leal JB, Seabra MC. The mammalian Rab family of small GTPases: definition of family and subfamily sequence motifs suggests a mechanism for functional specificity in the Ras superfamily. J Mol Biol. 2000;301:1077–1087. doi: 10.1006/jmbi.2000.4010. [DOI] [PubMed] [Google Scholar]
- Reed SE, Staley EM, Mayginnes JP, Pintel DJ, Tullis GE. Transfection of mammalian cells using linear polyethylenimine is a simple and effective means of producing recombinant adeno-associated virus vectors. J Virol Methods. 2006;138:85–98. doi: 10.1016/j.jviromet.2006.07.024. [DOI] [PubMed] [Google Scholar]
- Rorth P. Fellow travellers: emergent properties of collective cell migration. EMBO Rep. 2012;13:984–991. doi: 10.1038/embor.2012.149. [DOI] [PMC free article] [PubMed] [Google Scholar]
- Sahai E. Mechanisms of cancer cell invasion. Curr Opin Genet Dev. 2005;15:87–96. doi: 10.1016/j.gde.2004.12.002. [DOI] [PubMed] [Google Scholar]
- Saito AC, Matsui TS, Ohishi T, Sato M, Deguchi S. Contact guidance of smooth muscle cells is associated with tension-mediated adhesion maturation. Exp Cell Res. 2014;327:1–11. doi: 10.1016/j.yexcr.2014.05.002. [DOI] [PubMed] [Google Scholar]
- Sakane A, Abdallah AA, Nakano K, Honda K, Ikeda W, Nishikawa Y, Matsumoto M, Matsushita N, Kitamura T, Sasaki T. Rab13 small G protein and junctional Rab13-binding protein (JRAB) orchestrate actin cytoskeletal organization during epithelial junctional development. J Biol Chem. 2012;287:42455–42468. doi: 10.1074/jbc.M112.383653. [DOI] [PMC free article] [PubMed] [Google Scholar]
- Sakane A, Honda K, Sasaki T. Rab13 regulates neurite outgrowth in PC12 cells through its effector protein, JRAB/MICAL-L2. Mol Cell Biol. 2010;30:1077–1087. doi: 10.1128/MCB.01067-09. [DOI] [PMC free article] [PubMed] [Google Scholar]
- Sakane A, Sasaki T. Roles of Rab family small G proteins in formation of the apical junctional complex in epithelial cells. In: Ebnet K, editor. Cell Polarity, Vol. 1. Heidelberg, Germany: Springer; 2015. pp. 349–374. [Google Scholar]
- Shi J, Blundell TL, Mizuguchi K. FUGUE: sequence-structure homology recognition using environment-specific substitution tables and structure-dependent gap penalties. J Mol Biol. 2001;310:243–257. doi: 10.1006/jmbi.2001.4762. [DOI] [PubMed] [Google Scholar]
- Shikata H, Yakushijin Y, Matsushita N, Sakai A, Sugita A, Nakamura N, Yamanouchi J, Azuma T, Hato T, Yasukawa M. Role of activation-induced cytidine deaminase in the progression of follicular lymphoma. Cancer Sci. 2012;103:415–421. doi: 10.1111/j.1349-7006.2011.02186.x. [DOI] [PMC free article] [PubMed] [Google Scholar]
- Shimizu K, Hirose S, Noguchi T. POODLE-S: web application for predicting protein disorder by using physicochemical features and reduced amino acid set of a position-specific scoring matrix. Bioinformatics. 2007;23:2337–2338. doi: 10.1093/bioinformatics/btm330. [DOI] [PubMed] [Google Scholar]
- Stein M, Pilli M, Bernauer S, Habermann BH, Zerial M, Wade RC. The interaction properties of the human Rab GTPase family-comparative analysis reveals determinants of molecular binding selectivity. PLoS One. 2012;7:e34870. doi: 10.1371/journal.pone.0034870. [DOI] [PMC free article] [PubMed] [Google Scholar]
- Stryer L. The interaction of a naphthalene dye with apomyoglobin and apohemoglobin. A fluorescent probe of non-polar binding sites. J Mol Biol. 1965;13:482–495. doi: 10.1016/s0022-2836(65)80111-5. [DOI] [PubMed] [Google Scholar]
- Takai Y, Sasaki T, Matozaki T. Small GTP-binding proteins. Physiol Rev. 2001;81:153–208. doi: 10.1152/physrev.2001.81.1.153. [DOI] [PubMed] [Google Scholar]
- Terai T, Nishimura N, Kanda I, Yasui N, Sasaki T. JRAB/MICAL-L2 is a junctional Rab13-binding protein mediating the endocytic recycling of occludin. Mol Biol Cell. 2006;17:2465–2475. doi: 10.1091/mbc.E05-09-0826. [DOI] [PMC free article] [PubMed] [Google Scholar]
- Theveneau E, Mayor R. Cadherins in collective cell migration of mesenchymal cells. Curr Opin Cell Biol. 2012;24:677–684. doi: 10.1016/j.ceb.2012.08.002. [DOI] [PMC free article] [PubMed] [Google Scholar]
- Thompson JD, Higgins DG, Gibson TJ. CLUSTAL W: improving the sensitivity of progressive multiple sequence alignment through sequence weighting, position-specific gap penalties and weight matrix choice. Nucleic Acids Res. 1994;22:4673–4680. doi: 10.1093/nar/22.22.4673. [DOI] [PMC free article] [PubMed] [Google Scholar]
- Wu M, Wang T, Loh E, Hong W, Song H. Structural basis for recruitment of RILP by small GTPase Rab7. EMBO J. 2005;24:1491–1501. doi: 10.1038/sj.emboj.7600643. [DOI] [PMC free article] [PubMed] [Google Scholar]
- Yamamura R, Nishimura N, Nakatsuji H, Arase S, Sasaki T. The interaction of JRAB/MICAL-L2 with Rab8 and Rab13 coordinates the assembly of tight junctions and adherens junctions. Mol Biol Cell. 2008;19:971–983. doi: 10.1091/mbc.E07-06-0551. [DOI] [PMC free article] [PubMed] [Google Scholar]
- Yokoyama S, Matsui TS, Deguchi S. Microcontact peeling as a new method for cell micropatterning. PLoS One. 2014;9:e102735. doi: 10.1371/journal.pone.0102735. [DOI] [PMC free article] [PubMed] [Google Scholar]
- Yonemura S. Differential sensitivity of epithelial cells to extracellular matrix in polarity establishment. PLoS One. 2014;9:e112922. doi: 10.1371/journal.pone.0112922. [DOI] [PMC free article] [PubMed] [Google Scholar]
- Zahraoui A, Joberty G, Arpin M, Fontaine JJ, Hellio R, Tavitian A, Louvard D. A small rab GTPase is distributed in cytoplasmic vesicles in non polarized cells but colocalizes with the tight junction marker ZO-1 in polarized epithelial cells. J Cell Biol. 1994;124:101–115. doi: 10.1083/jcb.124.1.101. [DOI] [PMC free article] [PubMed] [Google Scholar]
- Zerial M, McBride H. Rab proteins as membrane organizers. Nat Rev Mol Cell Biol. 2001;2:107–117. doi: 10.1038/35052055. [DOI] [PubMed] [Google Scholar]
Associated Data
This section collects any data citations, data availability statements, or supplementary materials included in this article.