Abstract
High community incarceration rates have been shown to be associated with high rates of HIV and sexually transmitted diseases (STDs). Proposed mechanisms underlying this association include transmission by recently released inmates and community disruption through a skewed sex ratio or changes in sexual networks resulting from the absence of individuals removed by incarceration. To continue exploring the relationship between incarceration and STDs, we studied the 2006 rates of gonorrhea at the census tract level in Guilford County, North Carolina (NC) with the previous year’s level of incarceration as the exposure of interest. We replicated an analysis conducted in Durham, another NC county, but unlike in Durham we found no meaningful association. However, when quadratic and cubic exposure terms were added to the model to allow for a non-linear effect of incarceration, incarceration levels were significantly associated with rates of gonorrhea (p = 0.03). This indicates that the effect of incarceration on gonorrhea rates differs based on the level of incarceration in an area. Through the use of a spatial model, we also found evidence of the incarceration-gonorrhea association varying across the county. The association between incarceration and gonorrhea varies by the rate of incarceration and geographically.
Incarceration rates have been shown to be correlated with several markers of community health at the county level such as rates of human immunodeficiency virus (HIV) infection, bacterial sexually transmitted diseases (STDs), and teenage pregnancy (1,2). The association between incarceration and STDs was also explored at the census tract level in Durham County, North Carolina (NC) (3). Census tracts may more clearly approximate the geographical areas affected by high rates of incarceration. The multivariable models used in that study found several significant relationships between incarceration and STDs even after controlling for age distribution, percent African American and percent living below poverty (3). The models incorporated a one year lag under the assumption that the effects of incarceration rates on gonorrhea are not immediate (2,3).
There are at least two proposed mechanisms by which incarceration may affect the rate of HIV/STDs in the community. The first is the effect that individuals released from prison may have as they a) may engage in high risk behaviors or b) are more likely than other members of the community to be infected with HIV/STDs. Social service providers of men released from prison have described encounters with men who felt they needed to “make-up for lost time,” who post-release may have been more likely to have sex with “riskier” partners, and who encountered the destabilizing influence of diminished economic potential in the face of trying to find work as ex-offenders (4). In interviews conducted in California, Mississippi, Rhode Island and Wisconsin from1999–2000, one in four (27%) ex-offenders reported sex with multiple partners in the week after they were released (5). One in four (24%) recently released 18–29 year old men also had either an STD or hepatitis C virus (6). Finally, one in four (26%) HIV-positive ex-offenders reported unprotected sexual activity with their partners within 45 days of their release (7).
The second mechanism proposed is social disruption of the community resulting from “forced migration” of individuals into the prison system (1–3). Because men are incarcerated in greater numbers than women, incarceration can result in a skewed sex ratio which in turn may alter sexual networks or sexual behaviors such as concurrent partnerships or transactional sex (1–3). In ethnographic interviews with female partners of prisoners or ex-offenders, Thomas et al. found that some women relied on finding “substitute partners” to maintain financial solvency while their primary partner was in prison; said one woman interviewed, “They were doing that all the time. Keep money going while he was out.” (3)
In order to better understand whether the relationship between incarceration and STDs at the census tract level could be replicated in another NC county, we conducted portions of the Durham analysis in Guilford County. Guilford was selected because it has a demographic composition similar to Durham with both urban and rural populations (Table 1). Guilford typically experiences higher rates of incarceration, as measured by prison entries, than does Durham; Durham typically has higher STD rates with the exception of syphilis (8,9). Finally, Guilford was selected because the county was under consideration as a site of a future cohort study on the effects of incarceration on families; this current analysis provides preliminary data for such a study.
Table 1.
Characteristics of Guilford and Durham Counties, NC.
| County
|
||
|---|---|---|
| Guilford | Durham | |
| 2005 Population | 429,603 | 232,573 |
| Census tracts (number) | 98 | 53 |
| African American (%) | 29.9 | 37.2 |
| Poverty (%) | 14.9 | 12.9 |
| 2005 Incarceration* (%) | 322.6 | 147.5 |
| Proportion of census tracts with percent person-time in prison ≥ 0.5% (%) | 35.71 | 38.46 |
| 2006 Gonorrhea Rate per 100,000 | 244.2 | 317.4 |
As measured by rate of prison entry per 100,000. Guilford data are from 2005; Durham data are from 2002 and includes only the 52 tracts used in their analysis.
Methods
We received information from the North Carolina Department of Corrections for year 2005 incarcerations for 5,324 prison inmates who had listed an address from Guilford County as their most recent residence. In addition to a home address, each individual’s information included dates of prison entry and exit and whether the individual was still in prison at the end of the year. North Carolina state STD data from 2006 were used with permission from the Guilford County Health Department. We received 1,083 reports of gonorrhea.
We used ArcGIS (version 9.1) to map the addresses of inmates and cases of gonorrhea to a census tract. If the individual’s home address was able to be matched by the software (and could thus be plotted on the map by its latitudinal and longitudinal coordinates), the individual was included in the analysis. Match scores, which range from zero to 100 and reflect the degree of similarity between the individual’s address and a county reference file, were generated by ArcGIS for each address. All individual information was then aggregated to the census tract level.
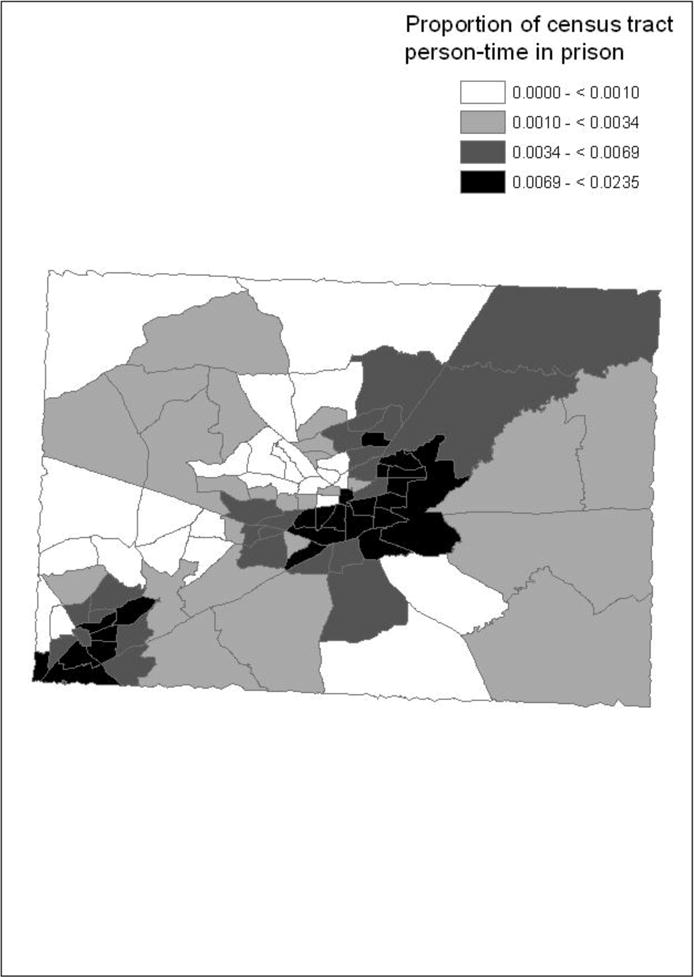
A total of 4022 (76%) of the prison inmate addresses matched to a location in Guilford County in ArcGIS, of which 3851 were matched with a score of 80–100; 171 were matched with a score of < 80. The census tract distribution of incarceration rates is presented in Figure 1.
Figure 1.

Geographic distribution of the proportion of census tract person-time in prison divided into quartiles in Guilford County, NC, 2005.
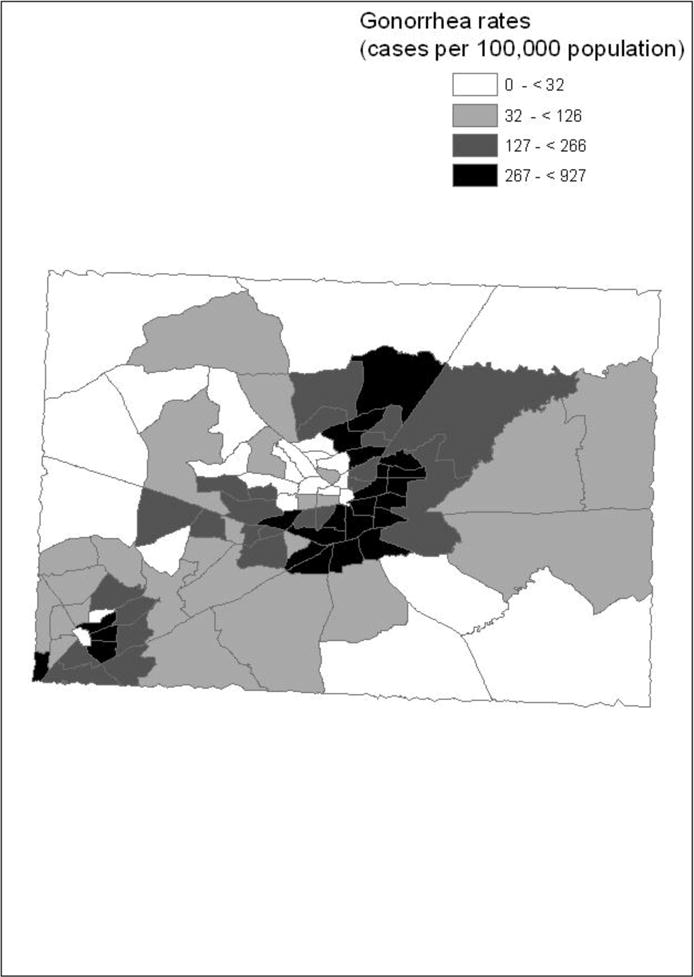
We were able to map 728 addresses (67%) of the cases of gonorrhea with a match score of ≥ 80. There were no notable differences between cases with addresses that were able to be matched and those unable to be matched (Table 2). The census tract distribution of gonorrhea rates is presented in Figure 2.
Table 2.
Characteristics of Laboratory-Confirmed Cases of Gonorrhea from Guilford County, NC from 2006 that could be matched at ≥ 80 (n = 728) and could not be matched at that level (n = 355).
| Characteristics | Matched | Not Matched |
|---|---|---|
| Mean Age (in years) | 26.5 | 27.0 |
| Male (%) | 50.6 | 53.5 |
| African American (%) | 86.7 | 83.7 |
| White (%) | 12.5 | 16.1 |
| Other/unknown race (%) | 0.8 | 0.3 |
| Hispanic (%) | 2.3 | 3.4 |
Figure 2.

Geographic distribution of gonorrhea rates divided into quartiles in Guilford County, NC, 2006.
We used a one-year lag between the incarceration data and gonorrhea data because such a temporal sequence is more consistent with a causal relationship than is a cross-sectional analysis. Moreover, in a previous study, a one-year lag yielded the strongest correlation (2).
We obtained demographic characteristics (age, sex, and race distributions) for each of the 98 census tracts in Guilford County from the US Census Bureau (10). We used the census tract populations as denominators to calculate proportions of these characteristics in each tract. Information on the proportion of the tract population living in poverty was obtained from the Public Health Disparities Geocoding Project Monograph (11).
We used Stata/IC version 10 to conduct a non-spatial statistical analysis. Because the data were over-dispersed, negative binomial models were more appropriate than traditional Poisson regression. Our exposure of interest was the proportion of census tract person-time in prison calculated as: the total number of days spent in prison over the course of 2005 for individuals whose reported residence was within a census tract, divided by the census tract population from the 2000 census multiplied by 365 days. We adjusted for three variables: the proportion of the tract who self-identified as African-American in the census data, the proportion living below the poverty level, and the age structure of the census tract (categories: 0–21, 22–39, 40+ years). These covariates were also used in the analysis of the Durham data (3).
We ran two separate models; one that included a single exposure term (proportion of census tract person-time in prison) to replicate the Durham analysis and a second model that included the exposure term, the exposure term squared and the exposure term cubed. This second model, a third-order polynomial model, allowed the relationship between incarceration and gonorrhea rates to vary non-linearly, which allows for the possibility of a threshold effect). This type of model has been used by criminologists to investigate threshold effects of incarceration on crime (12).
To assess the accuracy of our geocoding we conducted a validation study of 50 randomly identified addresses from the incarceration and STD data sets. With a geographic positioning system (GPS) and a printout of only the addresses and the census tract in which ArcGIS had placed the address, we drove to each location to confirm that it was a residential address and that the census tract assigned by ArcGIS was correct.
An important relationship between incarceration and STDs could be obscured if associations were to vary across census tracts. To determine if there was heterogeneity in effects, we conducted a geographically weighted regression with GWR (geographically weighed regression) software (version 3.0) to generate local parameter estimates. The coordinates used in the model were the centroids of each census tract which were provided to us by the US Census Bureau. The GWR software is unable to accommodate negative binomial regression. We used a Poisson model because it is better suited to rates than Gaussian and logistic models, the other two options provided by the software. A formal significance test of the degree of variation between local parameter estimates is not available for Poisson regression in GWR, however it is possible to determine the presence of heterogeneous effects by comparing two values: two times the standard error of the global parameter estimate generated by GWR and the range of local estimates (upper quartile – lower quartile). If the range is the larger value, it indicates the relationship varies over space. The model could only accommodate two covariates; we selected the proportion of tract population that was African-American and the proportion of the population in poverty.
The University of North Carolina’s Public Health and Nursing institutional review board approved this study.
Results
Proportions of census tract person-time in prison ranged from zero to 2.34% with a median of 0.32%. Census tract rates of gonorrhea ranged from zero to 927 per 100,000 person-years with a median of 125 per 100,000 person-years.
Maps of the rates of incarceration and STDs revealed similar patterns and the proportion of census tract person-time in prison and the rate of gonorrhea in the tracts were highly correlated (r = 0.79). However, in the model that replicated the Durham analysis, there was no significant association (beta = 12.20 (95% CI: −35.71, 60.11)). This beta coefficient reflects a rate difference of approximately 1.29 (95% CI: −3.67, 6.25) cases of gonorrhea per 100,000 person-years when comparing the STD rates at the 75th percentile of incarceration (689.7 days per 100,000 person-days per tract) and the 25th percentile (100.3 per 100,000 person-days per tract), or an exposure contrast ratio of 1.07 (95% CI: 0.81, 1.43).
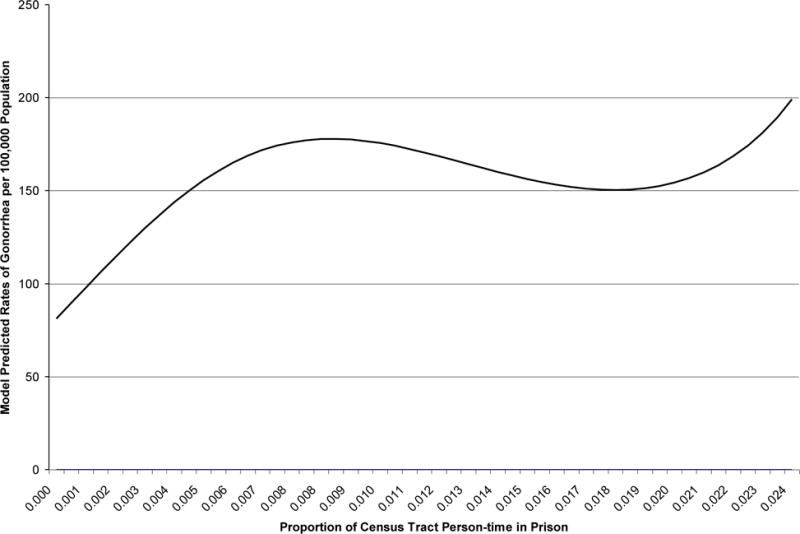
The third-order polynomial model, however, revealed that taken together, the exposure terms quantifying the amount of incarceration in the tract significantly predicted the rate of gonorrhea. The estimates generated by the individual terms (the proportion of census tract person-time in prison, that value squared and that value cubed) cannot be interpreted in isolation and using them to calculate rate differences can be misleading. These types of data are best shown in graphical form; the results are presented in Figure 3. As the amount of incarceration increased along the observed distribution of the proportion of census tract person-time in prison, the model-predicted rates of gonorrhea did not follow a linear path. Initially, increasing the proportion of census tract person-time in prison increased the predicted rate of gonorrhea. However, at a certain point (when roughly 1% of the census tract person-time was spent in prison), the curve began to flatten and the predicted rates of gonorrhea remained similar as incarceration increased. At an incarceration level of roughly 2% of census tract person-time in prison, the model-predicted rates of gonorrhea returned to being sharply increased by increasing levels of incarceration.
Figure 3.

Third-order polynomial model-predicted rates of gonorrhea across observed exposure distribution, controlling for the proportion of the tract that is African-American, the proportion living below the poverty level, and the age structure of the census tract (categories: 0–21, 22–39, 40+ years). Guilford County, NC, 2005.
All but one (98%) of the 50 addresses selected for the geocoding validation study were residential; 47 (94%) were placed by ArcGIS in the correct census tract.
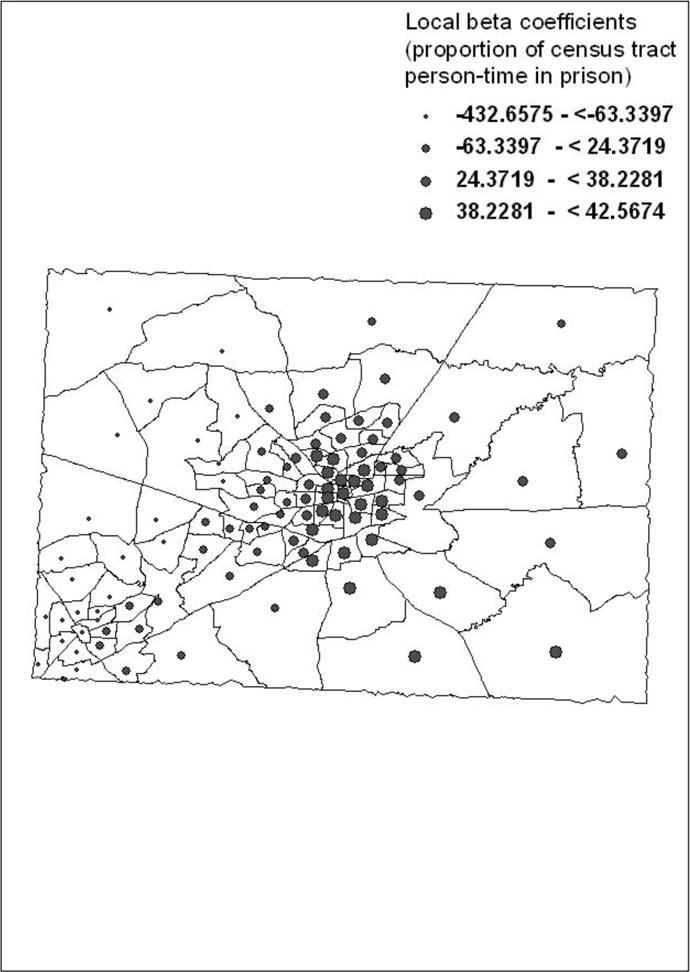
The betas for the incarceration variable in the GWR analysis ranged from −65.17 (lower quartile) to 37.94 (upper quartile). The range of local parameter estimates (103.11) was far greater than two times the standard error of the global estimate (23.89) indicating that the relationship between incarceration and gonorrhea rates varies across space. Additionally, the range of betas spanned the null, meaning that in certain census tracts incarceration appeared to decrease the rate of gonorrhea, while in other tracts it increased it. The census tract distribution of the local beta coefficients is presented in Figure 3.
Discussion
Our findings help illuminate the relationship between incarceration and STDs on an ecologic level. Our findings were inconsistent with the previous study in Durham County, NC, in which 2001 incarceration rates were linearly associated with 2002 gonorrhea rates with a beta of 5.40 (p=0.02) in a linear model. However, the results from our third-order polynomial model and the evidence from our spatial analysis indicate there is a non-linear association in Guilford County.
Clear et al. found a threshold effect between incarceration levels and crime (12). Their results suggest “a tipping point” of effects, in which low concentrations of incarceration improve community stability while high concentrations weaken it. We examined whether a similar threshold applied to the relationship between incarceration and gonorrhea rates. Evidence for a non-linear effect in Guilford was present in the parameters generated by the third-order polynomial model. Taken together, the three exposure terms contributed significantly to the prediction of census tract level gonorrhea rates.
The GWR analysis indicated that the relationship between gonorrhea rates and incarceration varied across census tracts. This finding suggests that characteristics of the communities that we were unable to control for may affect that relationship. Drug use appears frequently in the literature as an important issue not only in terms of its role in risky sexual behavior and its use by individuals recently released from prison, but also through the degree it affects those “left behind” (4,5,7). We were unable to assess the possible differences in its effect across census tracts. Other factors that we did not control for and that may have contributed to or distorted the relationship between incarceration and STDs include condom use and health care availability.
Our use of an ecologic model reflects the early state of the science of community health effects of incarceration and our interest in the rates of STDs within the entire community, not only among those individuals who went to prison. However, even aggregate-level associations are better understood with the addition of individual-level data. Additionally, interpretations of ecologic data require a number of assumptions (13). The use of summary measures to control for confounding provides no opportunity to consider joint distributions of covariates. For example, race-based income distribution was an important predictor of gonorrhea rates in counties throughout southeastern states (14); separate, aggregate measures of race and poverty cannot capture the effects of such a variable. In future studies, multilevel approaches will be especially helpful in advancing our understanding of the mechanisms by which incarceration affects community health.
This study is the first to report a non-linear effect of incarceration on STDs, a result that closely follows the findings and underlying theory presented by Clear et al. (12). This is also the first time a spatial analysis has been used to describe the variation of the incarceration-gonorrhea association across space. Additional investigation of the non-linear relationship between incarceration levels and community health outcomes is warranted and researchers’ efforts may best be focused on areas in which incarceration rates are the highest.
Figure 4.

Geographic distribution of the local beta estimates for the census tract person-time in prison variable controlling for percent of tract African-American and percent of tract population in poverty, divided into quartiles in Guilford County, NC, 2005.
Acknowledgments
This research was supported in part by a grant from the University of North Carolina Project on Ethnicity Culture and Health Outcomes (ECHO) and a National Research Service Award from the National Institute of Allergy and Infectious Diseases (grant number: 1-T32-AI070114-01A1). We thank the Guilford County Health Department, especially Dr. Mark Smith and Jared Hill, for providing data on gonorrhea infections and for assistance with our geocoding validation study. We thank the North Carolina Department of Corrections for data on incarcerations in Guilford County. We thank: Chris Wiesen, Statistics Consultant at the Odem Institute for Social Science Research at UNC for assisting with the polynomial regression analysis and calculation of the person time per census tract; Amanda Henley, the UNC GIS librarian, for help with geocoding; Brooke Levandowski, for geocoding the incarceration data; Elizabeth Torrone, for assistance with our regression analyses; and Dr. James Leloudis, Dr. Anissa Vines, and Lao Rubert of the Carolina Justice Policy Center for information on Guilford and Durham Counties.
References
- 1.Thomas JC, Sampson LA. High rates of incarceration as a social force associated with community rates of sexually transmitted infection. J Infect Dis. 2005;191(Suppl 1):S55–60. doi: 10.1086/425278. [DOI] [PubMed] [Google Scholar]
- 2.Thomas JC, Torrone E. Incarceration as forced migration: effects on selected community health outcomes. Am J Public Health. 2006;96:1762–5. doi: 10.2105/AJPH.2005.081760. [DOI] [PMC free article] [PubMed] [Google Scholar]
- 3.Thomas JCL, B A, Isler MR, Torrone E, Wilson G. Incarceration and Sexually Transmitted Infections: A Neighborhood Perspective. J Urban Health. 2008 Jan;85(1):90–9. doi: 10.1007/s11524-007-9231-1. [DOI] [PMC free article] [PubMed] [Google Scholar]
- 4.Seal DW, Margolis AD, Sosman J, Kacanek D, Binson D. HIV and STD risk behavior among 18- to 25-year-old men released from U.S. prisons: provider perspectives. AIDS Behav. 2003;7:131–41. doi: 10.1023/a:1023942223913. [DOI] [PubMed] [Google Scholar]
- 5.Seal DW, Eldrige GD, Kacanek D, Binson D, Macgowan RJ. A longitudinal, qualitative analysis of the context of substance use and sexual behavior among 18- to 29-year-old men after their release from prison. Soc Sci Med. 2007;65(11):2394–406. doi: 10.1016/j.socscimed.2007.06.014. [DOI] [PubMed] [Google Scholar]
- 6.Sosman JM, MacGowan RJ, Margolis AD, et al. Screening for sexually transmitted diseases and hepatitis in 18–29-year-old men recently released from prison: feasibility and acceptability. Int J STD AIDS. 2005;16:117–22. doi: 10.1258/0956462053057594. [DOI] [PubMed] [Google Scholar]
- 7.Stephenson BL, Wohl DA, McKaig R, et al. Sexual behaviours of HIV-seropositive men and women following release from prison. Int J STD AIDS. 2006;17:103–8. doi: 10.1258/095646206775455775. [DOI] [PubMed] [Google Scholar]
- 8.North Carolina Department of Corrections. DOC STATISTICS ON THE WEB. 2007 http://www.doc.state.nc.us/rap/index.htm. Accessed December 31, 2007.
- 9.Epidemiology and Special Studies Unit. HIV/STD Surveillance Report. Raleigh: NC: Department of Health and Human Services; 2006. http://www.epi.state.nc.us/epi/hiv/pdf/std06rpt.pdf. Accessed December 31, 2007. [Google Scholar]
- 10.American Community Survey. US Census Bureau. 2006 http://www.census.gov/acs/www/index.html. Accessed December 31, 2007.
- 11.The Public Health Disparities Geocoding Project Monograph. 2004 http://www.hsph.harvard.edu/thegeocodingproject/. Accessed September 15, 2007.
- 12.Clear T, Rose DR, Waring E, Scully K. Coercive mobility and crime: a preliminary examination of concentrated incarceration and social disorganization. JQ. 2003;20:33–64. [Google Scholar]
- 13.Greenland S. Ecologic versus individual-level sources of bias in ecologic estimates of contextual health effects. Int J Epidemiol. 2001;30:1343–50. doi: 10.1093/ije/30.6.1343. [DOI] [PubMed] [Google Scholar]
- 14.Thomas JC, Gaffield ME. Social structure, race, and gonorrhea rates in the southeastern United States. Ethn Dis. 2003;13:362–8. [PubMed] [Google Scholar]


