

Abstract
Pituitary adenylate cyclase activating polypeptide (PACAP, gene name Adcyap1) regulates a wide variety of neurological and physiological functions, including metabolism, cognition, and plays roles in of multiple forms of stress. Due to its preferential expression in nerve fibers, it has often been difficult to trace and identify the endogenous sources of the peptide in specific populations of neurons. Here, we introduce a transgenic mouse line that harbors in its genome a bacterial artificial chromosome containing an enhanced green fluorescent protein (EGFP) expression cassette inserted upstream of the PACAP ATG translation initiation codon. Analysis of expression in brain sections of these mice using a GFP antibody reveals EGFP expression in distinct neuronal perikarya and dendritic arbors in several major brain regions previously reported to express PACAP using a variety of approaches, including radioimmunoassay, in situ hybridization, and immunohistochemistry with and without colchicine. EGFP expression in neuronal perikarya was modulated in a manner similar to PACAP gene expression in motor neurons after peripheral axotomy in the ipsilateral facial motor nucleus in the brainstem, providing an example whereby the transgene undergoes proper regulation in vivo. These mice and the high-resolution map obtained are expected to be useful tools to understand anatomical patterns of PACAP expression and its plasticity in the mouse.
Keywords: Adcyap1, central nervous system, neuropeptide, facial nerve axotomy, pituitary adenylyl cyclase-activating polypeptide, reporter mouse, RRID:IMSR_MMRRC:012011, RRID:AB_177621, RRID:AB_10058149, RRID:AB_10073917, RRID:AB_177621, RRID:AB_2336201, RRID:AB_10563748, RRID:AB_10049744, RRID:AB_10680176, RRID:nlx_143660, RRID:SciRes_000137
INTRODUCTION
PACAP is a 38 amino acid neuropeptide originally isolated in 1989 as a hypophyseal factor that stimulated cAMP production in pituitary cells (Miyata et al., 1989). The primary amino acid sequence of PACAP and its C-terminal truncated 27 amino acid form is closely related to vasoactive intestinal peptide (VIP), and is highly conserved across evolution. For example, the sequence of the truncated form is 97% identical to that of amphibians and 90% to that of hydra and other cnidarians. After its discovery, PACAP was found to regulate brain development, act as a neurotransmitter/neuromodulator to control multiple behaviors and organ systems, and function to maintain homeostasis after physiological challenges including metabolic, traumatic, inflammatory, hemodynamic, and psychogenic stress (reviewed in Delgado et al., 2004; Falluel-Morel et al., 2007; Dejda et al., 2008; Vaudry et al., 2009; Hammack et al., 2010; Hashimoto et al., 2011; Reglodi et al., 2011; Seaborn et al., 2011; Stroth et al., 2011; Tan and Waschek, 2011; Mustafa, 2013; Waschek, 2013). Unfortunately, investigation of the precise neural circuitries involved in these activities has been hampered by the lack of PACAP antibodies which can robustly label the neuronal cell bodies that express PACAP without the use of colchicine, an axonal transport inhibitor, and a potent and toxic drug which can on its own induce alterations in gene and protein expression (Cortés et al., 1990). We report here a new transgenic mouse model in which a large (>97kb) PACAP 5’ promoter/enhancer region drives the expression of the inert reporter EGFP.
MATERIALS AND METHODS
Animals
PACAP-EGFP transgenic mice, Tg(Adcyap1-EGFP)FB22Gsat/Mmucd (RRID:IMSR_MMRRC:012011) were generated using the bacterial artificial chromosome (BAC; RP24-358O1) by the Gene Expression Nervous System Atlas (GENSAT) project (Gong et al., 2003; 2010) and obtained from the Mutant Mouse Resource & Research Centers. This BAC contained the 6.5 kb murine PACAP gene and approximately 97 kb 5’ and 107 kb 3’ flanking sequences, and harbors no other known genes. Within this BAC, an EGFP-encoding cassette was inserted directly upstream of the ATG initiation codon of PACAP and was followed by polyA signal to prevent run-through expression of PACAP. The modified BAC was linearized and injected into pronuclei of FVB/NTac mice by standard GENSAT protocols (http://www.gensat.org/makeconnection.jsp). An optimal founder (FB22) was selected and offspring were stored as cryoprotected embryos. Mice were regenerated from some of these embryos, and shipped to the UCLA vivarium. Offspring were used for the studies reported here. All experiments were performed in accordance with the institutional guidelines of the University of California, Los Angeles, the University of Southern California, the ARVO Statement for the Use of Animals in Ophthalmic and Vision Research. Six PACAP-EGFP mice were used for this analysis: three naïve and three to unilateral facial nerve axotomy, all male between one and five months of age.
Antibody Characterization
Two primary antibodies were used to detect EGFP either to intensify the native fluorescent signal or to visualize the expression by diaminobenzadine (DAB) staining. These antibodies are listed in Table 2. Secondary antibodies are listed in Table 3. Two anti-GFP antibodies were used in this study. The first, A-21311 (Life Technologies, RRID:AB_10058149), is a rabbit polyclonal antibody raised against Aequorea victoria GFP, and is conjugated to Alexa Fluor 488. In this study, however, this antibody was used only for DAB staining by way of a biotin-conjugated secondary antibody. The second anti-GFP antibody used in this study, (Life Technologies Cat#A-11122, RRID:AB_10073917), is also a rabbit polyclonal antibody raised against A. victoria GFP, and was used for immunofluorescence by way of fluorophore-conjugated secondary antibodies. No differences in the pattern of expression were noted between the two anti-GFP antibodies used in this study. Neither anti-GFP antibody used in the study reacted with tissue from wild type littermates (data not shown). One antibody, NeuN (Millipore Cat#MAB377B, RRID:AB_177621), was used to identify neuroanatomical structures in the brain. This antibody has been used extensively as an anatomical marker of most neuronal cell types, with 124 citations listed in the most recent Journal of Comparative Neurology Antibody Database (V14; RRID:nlx_143660).
Table 2.
Primary Antibodies.
| Primary Antibody |
Immunogen | Source | Catalog Number, RRID |
Host | Concentration |
|---|---|---|---|---|---|
| GFP | GFP isolated from jellyfish Aequorea victoria |
Life Technologies |
A-21311, RRID:AB_10058149 |
Rabbit polyclonal IgG |
1:500 |
| GFP | GFP isolated from jellyfish Aequorea victoria |
Life Technologies |
A-11122, RRID:AB_10073917 |
Rabbit polyclonal IgG |
1:500, 1:2500 |
| NeuN | DNA-binding, neuron- specific NeuN from purified cell nuclei from mouse brain |
Millipore | MAB377, RRID:AB_177621 |
Mouse monoclonal IgG |
1:500 |
Table 3.
Secondary Antibodies.
| Catalog # | Manufacturer | Reactivity | Conjugate | Concentration |
|---|---|---|---|---|
| BA-1100 | Vector | Rabbit | Biotin | 1:200 |
| RRID:AB_2336201 | Laboratories | IgG | ||
| A11008 | Life | Rabbit | Alexa Fluor | 1:400 |
| RRID:AB_10563748 | Technologies | IgG | 488 | |
| A21207 | Life | Rabbit | Alexa Fluor | 1:1000 |
| RRID:AB_10049744 | Technologies | IgG | 594 | |
| Ab97035 | Abcam | Mouse | Cy3 | 1:400 |
| RRID:AB_10680176 | IgG |
Immunohistochemistry
Animals were anesthetized with isoflurane (Phoenix) and transcardially perfused with ice-cold saline followed by 4% parafolmaldehyde in phosphate buffered saline (PBS), pH 7.2. Brains and spinal cords were removed and post-fixed overnight in 4% paraformaldehyde (PFA) and cryoprotected sequentially with 10%, 20% and 30% sucrose at 4°C. Brains were embedded in optimal cutting temperature solution (OCT), frozen and cryosectioned as 40μm free floating sections, and were stored in cryoprotectant (50% glycerol in PBS + 0.1% sodium azide). Spinal columns were removed, fixed in 10% neutral buffered formalin (NBF; Fisher Scientific) overnight at 4°C, cryoprotected with 20% sucrose solution overnight at 4°C, then the spinal cords were dissected out from the vertebrae. Spinal cords were embedded in gelatin blocks, which were then fixed in 10% NBF overnight at 4°C and re-cryoprotected as above before sectioning on a cryostat as 40μm floating sections.
For chromogenic immunostaining, sections from one animal were washed in PBS + 0.2% Tween (PBST), blocked with 0.3% H2O2 for 10 minutes, washed in PBST, blocked in 10% normal donkey serum in PBST for 2 hours at room temperature and incubated overnight at 4°C in 1:500 anti-GFP (A-21311, Life Technologies). Samples were washed in PBST, incubated with 1:200 biotinylated anti-rabbit secondary antibody (Vector Laboratories Cat#BA-1100, RRID:AB_2336201) for 2 hours at room temperature, washed, reacted with avidin-horse radish peroxidase conjugate (Vector Laboratories) for 60 minutes, washed and visualized with DAB (Vector Laboratories) until clear signals were seen with minimal background. Sections were dried overnight, dehydrated in ethanol and delipidized with xylenes. Sections were slide-mounted and sealed with DPX mounting medium (EMS). Brightfield images were acquired on an Olympus 1X81 inverted microscope with a motorized stage. Slidebook software was used to capture sub-images from each tissue section and subsequently stitch them together into a single montage image.
For immunofluorescence two protocols were used. In the first, used for the majority of animals in the study, sections were prepared as above, blocked and permeabilized in a solution containing PBS + 10% normal goat serum (NGS) + 1% bovine serum albumin (BSA) + 0.5% TritonX-100 for 1 hour. The anti-GFP primary antibody (A11122, Life Technologies) and anti-NeuN antibody (MAB377, Millipore) were diluted 1:500 in PBS + 5% NGS + 1% BSA and sections were incubated overnight at 4°C, then washed in PBS, and subsequently incubated with an anti-rabbit AlexaFluor 488 (Life Technologies Cat#A11008, RRID:AB_10563748) and anti-mouse Cy3 (Abcam Cat#Ab97035, RRID:AB_10680176) secondary antibodies diluted 1:400 for 2-4 hours at room temperature. Sections were washed in PBS and mounted on slides, and coverslipped with Prolong Gold Antifade Reagent (Life Technologies). Fluorescence images were acquired with a Zeiss HR camera on an Olympus IX70 microscope or an AxioImager.M2.
The alternative immunofluorescence protocol was used as follows. One mouse was given an overdose injection of sodium pentobarbital and transcardially perfused with ice-cold normal saline followed by ice-cold 0.1M borate buffered 4% PFA. Brains were post-fixed overnight in PFA, and then embedded in 4.5% agarose and sliced at 50 um thickness on a vibratome. A 1-in-4 series was collected and stained with an anti-GFP antibody. Sections were soaked for one hour in blocking buffer consisting of 2% normal donkey serum and 0.1% Triton X-100 in PBS, and then transferred into rabbit anti-GFP antibody (A-11122, Life Technologies) at 1:2500 in blocking buffer. Sections were kept in primary antibody for 72h at 4°C, after which they were washed in PBS, and then placed in donkey anti-rabbit AlexaFluor 594 conjugated secondary antibody (Life Technologies Cat#A21207, RRID:AB_10049744) at 1:1000 in blocking buffer overnight at 4°C. Sections were washed and steeped in NeuroTrace Blue 435/455 (N-21479, Life Technologies) fluorescent Nissl dye at 1:500 in 0.05% Triton X-100 PBS for 2h at room temperature, followed by a final wash. Tissue series were mounted onto glass slides and coverslipped with 40% glycerol in PBS. Sections were imaged with an Olympus VS120 multi-slide scanning epifluorescence microscope with a 10x UPlanSApo objective lens or 20x UPlanSApo lens, capturing the blue and red fluorophores. Confocal images were acquired on an Olympus Fluoreview FV1000 laser scanning microscope using 405 and 543 nm lasers to stimulate the fluorophores and a 10X UPLanSApo objective lens to capture the images. Subsequent processing of images was done using the Fiji package of ImageJ software (Schindelin et al., 2012; RRID:SciRes_000137), which included adjustments to brightness, contrast and hue, and removal of objects within the field of view, but not part of, the tissue sections. Confocal z-stacks separated by 1μm were collapsed by maximum intensity projection. Images containing red fluorophores signaling EGFP-immunoreactivity were converted to green for continuity. Figures were created with Pixelmator (Vilnius, Lithuania).
Facial nerve axotomy
Three adult male mice were anesthetized with xylazine (8mg/kg)/ketamine (100mg/kg). A small patch of the animals’ cheek inferior to the ear was shaved and a ~1cm incision was made with a scalpel blade, exposing the facial nerve near its branching point. The facial nerve was severed with iridectomy scissors, ensuring that the ends of the severed nerve were no longer in contact. The skin over the incision was then resealed with Vetbond (3M) and the animals were returned to a clean cage. Animals were monitored for 48 hours and given caprofen (Medigel cup; Clear H2O) for pain management. Animals were then perfused through the heart with 10% neutral buffered formalin and the brains were dissected and removed. The brains were post-fixed in 10% neutral buffered formalin overnight, followed by cryoprotection in 20% sucrose solution. Brains were then embedded in gelatin blocks, re-fixed and re-cryoprotected as above. Sections were cut on a cryostat to 40μm thickness, and EGFP expression was determined by immunofluorescence for GFP and NeuN as described above.
RESULTS
Broad CNS expression of PACAP-EGFP transgene
Although native EGFP fluorescence was observed in some structures of the brain of PACAP-EGFP mice, detection of transgene expression was greatly enhanced by EGFP immunohistochemistry using either fluorescence or chromogenic methods. A comprehensive and high-resolution library of brain and spinal cord sections stained using DAB and fluorescent antibodies can be accessed at [hyperlink to BioLucida viewer will be inserted upon acceptance of the publication]. All immunostaining methods provided similar information, although in some cases (as follows) the DAB system revealed more clear morphology and more intense staining of neuronal process. We discuss below some selected brain regions of special interest, and compare the EGFP expression patterns that observed for PACAP in rat in published studies (Arimura et al., 1991; Masuo et al., 1993; Mikkelsen et al., 1994; Hannibal, 2002) and/or PACAP mRNA expression data available on the Allen Mouse Brain Atlas website (http://mouse.brain-map.org/experiment/show/74511882; (Lein et al., 2007). A comparison of gene expression from the Allen Atlas and the distribution of EGFP-expressing cells is summarized in Table 4. In all brain and spinal cord areas observed, labeled cells appear neuronal in morphology. Co-labeling with an astrocyte marker (S100β; Sigma SAB1409625) on sagittal sections spanning the brain did not reveal any apparent overlap with GFP-labelled cell bodies (data not shown).
Table 4.
Comparison of PACAP or reporter expression across three studies.
| Structure | Rat PACAP- expressing cell bodies (Hannibal, 2002) |
PACAP- EGFP cell bodies |
PACAP mRNA from Allen Atlas |
|---|---|---|---|
| Retina | |||
| Retinal ganglion cell layer | + | ++ | N/R |
| Inner plexiform layer | − | − | N/R |
| Inner nuclear layer | − | rare | N/R |
| Outer plexiform layer | N/R | − | N/R |
| Outer nuclear layer | N/R | − | N/R |
| Olfactory Bulb | |||
| Glomerular layer | − | + | + |
| Mitral layer | + | + | + |
| Granular layer | − | − | − |
| Accessory olfactory bulb | − | + | + |
| Anterior olfactory nucleus | ++ | + | + |
| Isocortex | |||
| Prelimbic area | N/R | + | + |
| Infralimbic area | N/R | + | + |
| Layer 1 | + | − | − |
| Layer 2 | ++ | ++ | ++ |
| Layer 3 | ++ | + | + |
| Layer 4 | − | + | + |
| Layer 5 | ++ | +++ | +++ |
| Layer 6 | + | + | + |
| Hippocampus | |||
| Entorhinal area | ++ | +++ | + |
| CA1 | ++ | + | − |
| CA2 | ++ | ++ | − |
| CA3 | ++ | + | − |
| Dentate gyrus | |||
| Granule cell layer | +++ | − | − |
| Polymorph layer (hilus) | +1 | + | + |
| Amygdala | |||
| Lateral amygdala | + | +++ | + |
| Basal amygdala | + | ++ | + |
| Cerebral nuclei | |||
| Caudoputamen | − | − | − |
| Globus pallidus | − | − | − |
| Bed nucleus of the stria terminalis | + | − | − |
| Thalamus | |||
| Medial habenula | ++++ | − | ++ |
| Lateral habenula | ++++ | − | + |
| Ventral anteriolateral complex | − | − | − |
| Ventral posterior complex | − 1 | − | − |
| Paraventricular nucleus | − | − | − |
| Intergeniculate leaflet | − | − | − |
| Hypothalamus | |||
| Paraventricular nucleus | + | + | + |
| Mammilary nuclei | ++++ | +++ | +++ |
| Suprachiasmatic nucleus | − | − | − |
| Supraoptic nucleus | − | − | − |
| Subfornical organ | ++++ | − | ++ |
| Vascular organ of the lamina terminalis | +++ | ++ | ++ |
| Ventromedial hypothalamic nucleus | ++++ | ++ | +++ |
| Midbrain | |||
| Periaqueductal gray | + | + | ++ |
| Dorsal raphe nucleus | − | ++ | + |
| Cuneiform nucleus | N/R | ++ | + |
| Pedunculopontine nucleus | N/R | ++ | + |
| Ventral tegmental area | + | + | + |
| Substantia nigra | + | ++ | ++ |
| Olivary pretectal nucleus | − | ++ | ++ |
| Area postrema | − | ++ | + |
| Dorsal interfascicular raphe | − | + | + |
| Hindbrain | |||
| Lateral parabrachial nuclei | +++ | ++ | ++ |
| Medial parabrachial nuclei | +++ | rare | + |
| Dorsal tegmental nucleus | − | − | − |
| Nuclei of the solitary tract | +++ | +++ | ++ |
| Medial vestibular nucleus | +++ | + | + |
| Spinal vestibular nucleus | +++ | + | + |
| Nucleus of the origin of efferents | N/R | − | − |
| Supravestibular nuclei | N/R | − | − |
| Nucleus ambiguus | +++ | + | + |
| Inferior colliculus | + | + | + |
| Paragigantocellular nucleus | +1 | + | + |
| Intermediate reticular nucleus | + | + | + |
| Parvocellular nucleus | ++2 | + | + |
| Prepositius nucleus | N/R | + | + |
| Inferior olivary nuclei | N/R | − | ++ |
| Spinal nuclei of the trigeminal tract | N/R | + | + |
| Locus coeruleus | +++2 | + | + |
| Gracile nucleus | N/R | + | + |
| Extracuneate nucleus | N/R | − | − |
| Raphe pallidus | + | + | + |
| Raphe obscurus | + | + | + |
| Cochlear nuclei | +++ | + | + |
| Facial motor nucleus | − | − | − |
| Cerebellum | |||
| Purkinje cell layer | ++ | − | ++ |
| Deep cerebellar nuclei | ++ | − | − |
| Spinal cord | |||
| 1Sp | − | +++ | ++ |
| 5Sp | ++ | + | + |
| 7Sp | +1 | + | + |
| Lateral gray column | +1 | + | ++ |
| Dorsal gray horn | ++1 | ++ | + |
Our assessment the level of PACAP expression directly from the images in Hannibal (2002), otherwise expression levels reflect those reported by Hannibal in Table 1 of that publication.
Only observed when colchicine was employed. For the Allen Atlas, the expression levels reflect our assessment of the images published on the website.
N/R: Not reported. Relative levels of expression: − not detectable, rare, + low, ++ moderate, +++ intense, ++++ very intense expression.
Olfactory Bulb
Hannibal (2002) observed PACAP immunoreactivity in mitral cells in the rat olfactory bulb and a moderate density of nerve fibers in the glomerular cell layer. In agreement with this data, we observed intense GFP immunoreactivity in mitral cells, with dendrites extending at least to the base of the glomerular layer (Figure 1). Also in agreement, we found EGFP-immunoreactive cells in the accessory olfactory bulb and in the anterior olfactory nucleus. In addition, we observed intense staining of perikarya scattered throughout the glomerular layer (presumed to be periglomerular cells), with the highest concentrations of these cells at the base. Although periglomerular cells were not reported to express PACAP in the rat (Hannibal, 2002), gene transcripts for PACAP were clearly detected in a pattern similar to of GFP in the periglomerular layer of the mouse olfactory bulb (Allen Mouse Brain Atlas), indicating the expression we observed in these cells was driven by PACAP regulatory sequences in the transgene. The lack of corresponding expression in rats is most likely due to a species difference or a lower level of detectability using the methods employed.
Figure 1. EGFP immunoreactivity in the olfactory bulb.
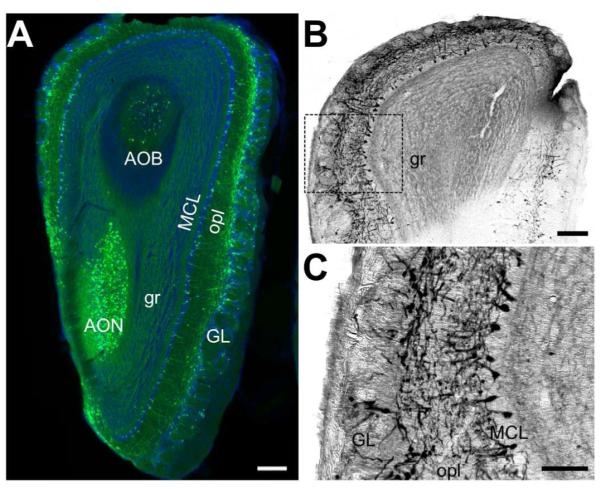
A) A low-resolution immunofluorescence image of the olfactory bulb showing EGFP expression (green) and Nissl staining (blue). EGFP-expressing cells and/or fibers are abundant in the outer plexiform layer (opl), mitral cell layer (MCL), accessory olfactory bulb (AOB), and anterior olfactory nucleus (AON), with relatively less expression in the granule layer (gr) and in the glomeruli, though some cells can be found in the glomerular cell layer (GL). Scale bar = 200μm. B) A low-resolution DAB-stained image of the olfactory bulb showing EGFP-immunoreactivity prominent in mitral cell bodies with processes in the granular layer. Scale bar = 200μm. C) Inset defined in (B) a high-resolution image of the EGFP-labeled mitral cells. Scale bar = 100μm.
Neocortex
GFP-positive cells were detected in cortical layers 2/3, 4, 5, and 6 in the lateral portions of the neocortex (Figure 2A) including the primary motor (Figure 2B), somatosensory (Figure 2C), piriform, and insular cortex. Cells with a distinct pyramidal morphology were observed in layers 2/3 (Figure 2D) and layer 5. Interestingly, in the cingulate cortex cellular expression appears to be restricted to layer 5 (data not shown). The results are largely congruent with published studies, where PACAP immunoreactive cells were found predominantly in layers 3 and 5, with a pyramidal morphology (Hannibal, 2002). Furthermore, PACAP mRNA expression is found in the pyramidal cell layers in the cortex (Mikkelsen et al., 1994; Hannibal, 2002; Stumm et al., 2007; Hu et al., 2011).
Figure 2. EGFP immunoreactivity in the neocortex and the corpus callosum.

A) Low-resolution immunofluorescent overview of EGFP-expressing cells (green) in the neocortex (CTX) and the corpus callosum (CC). Structures are identified by Nissl stain (blue). Also included in the image are the caudatoputamen (CP), the thalamus (TH), and the anteroventral nucleus of the thalamus (AV), all of which have diffuse EGFP immunostaining, as well as the external globus pallidus (GPe), which shows very little if any staining. Scale bar = 1mm. B), Inset of the primary motor cortex defined in (A). EGFP-immunoreactive cell bodies with a pyramidal morphology are found in layers 2/3, 5, and 6. Only fibrous-staining is found in layer 1, and no staining is observed in the cingulum bundle (cing). Scale bar = 200μm. C) Inset of the somatosensory cortex defined in (A). There is denser staining of cell bodies and fibers compared to the motor cortex, but the same laminar pattern is observed with the addition of many cell bodies stained in layer 4. Scale bar = 200μm. D) High-resolution inset of the area outlined in (B) showing the pyramidal morphology of the cells in layer 2/3 and the dendrites of those cells extending toward layer 1. Scale bar = 50 μm. E) Fibrous EGFP immunoreactivity is found primarily in the ventral portion of the CC, with much less in the dorsal portion. Intense staining is observed in the induseum griseum (IG) immediately superior to the CC. Few cell bodies are labeled in the retrosplenial area (RSP) at this section along the rostro-caudal axis. Some pyramidal cells can be found in the CA1 region of the hippocampus on this section. Scale bar = 100μm.
GFP-positive elements in cortical layer 1 appeared fibrous, with no obvious staining of cell bodies. This suggests that the non-pyramidal neurons that reside in layer 1 (Hestrin and Armstrong, 1996) are not likely to express PACAP themselves. Instead, the diffuse expression in this layer may be arising from dendrites of PACAP-expressing neurons in other cortical layers or from axons arising from other cortical layers or from the thalamus (Rubio-Garrido et al., 2009). The fibrous expression is similar to the PACAP immunoreactivity reported by (Hannibal, 2002), suggesting that the expression is not ectopic. The source of EGFP in layer 1 is not yet known. Two likely sources could include dendrites of EGFP positive cells ascending from lower levels of the cortex, or from M-type thalamic projections directly to this layer (Rubio-Garrido et al., 2009). Further studies would be needed to dissect the contributions of each of these structures to PACAP expression in layer 1.
Corpus Callosum
Here we report for the first time evidence of PACAP projections across the midline through the corpus callosum. The rostral portion of the corpus callosum is labeled throughout, but more caudally we find labeled axons are restricted to the ventral portion (Figure 2E). It was recently demonstrated that the axons in the corpus callosum are segregated based on the location of the originating projection neuron, with neurons located laterally projecting axons through the ventral corpus callosum (Zhou et al., 2013). This is consistent with our observation of increased density of labeled cell bodies in the lateral neocortex. Interestingly, we find intense EGFP expression in the indusium griseum, a structure immediately superior to the corpus callosum composed of glial tissue (Tubbs et al., 2013). Little is known about the function of the induseum griseum, though it is known to receive innervation from the hippocampus (Jinno et al., 2007) and the olfactory bulb (Shipley and Adamek, 1984). The EGFP immunoreactivity is likely due to axons from projections into the induseum griseum, since PACAP is not known to be normally expressed in glia.
Hippocampus
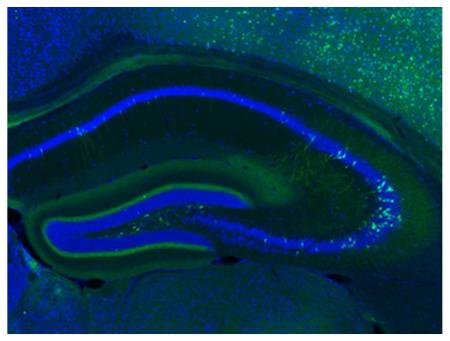
PACAP expression has been reported in widely scattered pyramidal cells in CA1-CA3 layers of the rat hippocampus Hannibal (2002). Similarly, PACAP-EGFP mice exhibited reporter expression in CA pyramidal cells. However, analyses of coronal sections spanning the entire hippocampus revealed that the pattern of expression changed substantially along the rostral-caudal axis. For example, on rostral sections (corresponding to dorsal hippocampus), primarily CA1 neurons were labeled (Figure 3A), whereas expression spread to CA2 and CA3 neurons towards the intermediate regions (Figure 3B-D). In the most caudal sections (corresponding to the ventral hippocampus), many CA3 neurons were intensely labeled. The Allen mouse Atlas, however, does not show any PACAP gene expression in the CA regions. In addition to expression in CA pyramidal neurons, cells with a mossy cell morphology were strongly labeled in the polymorphic layer (also called hilus; Figure 3E), as also observed by Hannibal (2002). In addition to the labeling of cell bodies, EGFP immunoreactivity was pronounced throughout the hippocampal dentate gyrus molecular layer (Figure 3E). This most likely corresponds to axonal projections from PACAP-expressing neurons in the entorhinal cortex and/or in axons of the PACAP expressing mossy neurons in the polymorphic layer. We did not see evidence for GFP expression in pyramidal basket cells in this area, as previously suggested for PACAP in rats (Hannibal, 2002). In agreement with the EGFP expression, the Allen mouse Atlas shows no expression of PACAP mRNA in these cells.
Figure 3. EGFP-immunoreactive cells in the hippocampus.

A) Low-resolution immunofluorescence overview of EGFP-immunoreactivity in a relatively anterior section of the hippocampus. EGFP-labeled cell bodies (green) are found primarily in the pyramidal layer of CA1 as well as in the polymorph layer (po) of the dentate gyrus. Some cell bodies are intensely labeled in CA2 and CA3, as well, though in smaller proportion to CA1 Diffuse and fibrous staining is found in the CC, stratum radiatum (sr), particularly in the ventral portion that abuts the dentate gyrus, as well as a tight band in the molecular layer of the dentate gyrus (DG). Nissl staining (blue) provides the anatomical structure. Scale bar = 500μm. B) Another cross section of the hippocampus, representing a more central portion than in (A). Here, there is denser labeling of cells in the CA2 and CA3 region. A similar pattern of staining to (A) is found in other subregions. C) High-resolution inset of the CA1 region defined in (B). Some cell bodies and processes with neural morphology are stained in this region, but sparsely at this position along the rostro-caudal axis. Scale bar = 100μm. D) Confocal image of the CA3 region of the hippocampus. Cells with a pyramidal morphology are labeled in the pyramidal layer (sp), with processes extending out to the stratum oriens (so) and sr. E) High-resolution inset of the DG defined in (B). Very dense fibrous staining is observed in the medial perforant pathway in the molecular layer (mo) abutting the granule layer (sg). Additionally, large cells within the polymorph layer are intensely stained for EGFP. Scale bar = 200μm.
Despite the clear EGFP labeling of CA hippocampal neuronal perikarya in PACAP-EGFP mice, PACAP mRNA in situ hybridization signals were not visualized above background in the corresponding cell layers in the Allen Mouse Brain Atlas. Interestingly, these CA neurons represent the only population of EGFP+ cells examined which did not exhibit corresponding mRNA signals in the Allen Atlas (see Table 4 for a summary), although the converse was not always true (Table 4 and discussion). In the adult rat, PACAP in situ mRNA signals and/or PACAP immunoreactive neurons were reported in CA neurons by at least two groups (Skoglösa et al., 1999; Hannibal, 2002). Nonetheless, more sensitive and specific in situ hybridization methods may be necessary to definitive determine in mice if the EGFP signals we observed in the hippocampal CA regions correspond to neurons that truly express the gene in this species.
Amygdala, Striatum, and Bed Nucleus of the Stria Terminalis
In the transgenic mice, the lateral and basal amygdala contain an abundance of cell bodies and fibers labeled with EGFP, especially the lateral amygdala (Figure 4A). The central amygdala and caudatoputamen were devoid of EGFP immunoreactive cell bodies, but contained diffuse staining, most likely corresponding to fibers. These staining patterns appear to be consistent PACAP immunoreactivity reported in the rat (Hannibal, 2002). The abundance of GFP immunoreactive neuronal perikarya in the basolateral amygdala, and the paucity of staining in the bed nucleus of the stria terminalis (Figure 4B) contrasts quantitatively, but not qualitatively with patterns observed previously by immunohistochemistry in the rat. This is likely explained by differences in cellular localization of PACAP vs. EGFP in cell bodies vs. axons (Hannibal, 2002). Moreover, the Allen Atlas demonstrated signals of individual cells in the basolateral amygdala. We also observed fibrous staining in the anterior commissure and the internal capsule (Figure 4B).
Figure 4. EGFP-immunoreactivity in the amydgala and bed nucleus of the stria terminalis.

A) High-resolution image of the amygdala area. EGFP-positive cells are found only in the lateral and basal amydala (LA and BA, respectively), with particular intensity in the LA. Cell body staining appears to be absent in central amygdala (CeA), though diffuse staining resembling fibers is present throughout. Cell body staining is also absent from the caudatoputamen (CP), though there is diffuse immunoreactivity throughout the structure. Scale bar = 200μm. B) High-resolution image of the dorsal and ventral bed nucleus of the stria terminalis (dBNST and vBNST, respectively) showing a lack of EGFP-positive cells in this region. A fibrous pattern of staining is observed in the anterior commissure (ac) and the internal capsule (int). Scale bar = 200μm.
Thalamus
Our findings in much of the thalamus are in agreement with that of others in the rat, where few or no positive perikarya in this structure (Figure 5A). On the other hand many regions in the thalamus exhibited diffuse staining, such as the ventral anteriolateral and ventral posterior complexes, and the paraventricular nucleus of the thalamus, in agreement with reports of abundant PACAP immunoreactivity in fibers and fiber tracts in much of the thalamus (Hannibal, 2002). However, a few discrepancies in cell bodies and fibers are found in the thalamus of PACAP-EGFP mice compared to available data. For example, the Allen Mouse Brain Atlas shows strong PACAP mRNA signals in the medial and lateral habenula, while Hannibal (2002) report the presence of PACAP immunoreactivity cell bodies in the corresponding structure in rats. In contrast, we observed only fibrous staining in these structures in PACAP-EGFP mice, and few, if any, cell bodies (Figure 5B). Additionally, we find little, if any, fibrous EGFP immunoreactivity in the intergeniculate leaflet (IGL; data not shown), in which Hannibal (2002) reported dense fibrous staining. The IGL is a target of retinal projections, which have been reported to express PACAP (Hannibal et al., 2000; 2001; 2002). The lack of EGFP immunoreactivity in location, as well as other areas to be discussed that receive retinal projections, may be due to difficulty of EGFP diffusion from the optic nerve to target areas in the brain.
Figure 5. EGFP-immunoreactivity in the thalamus and hypothalamus.

A) Low-resolution image of a broad portion of the thalamus showing immunoreactivity in a fibrous pattern in several locations, including the lateral habenula (LH), paraventricular nucleus of the thalamus (PVT), the medial and lateral dorsal nuclei (MD and LD, respectively), and the ventral anteriolateral and posterior nuclei (VA and VP, respectively). Scale bar = 500μm. B) Confocal image of the medial habenula (MH), LHT and PVT. At this resolution, no labeled cell bodies are observed, but some diffuse fluorescence is found in the LH and PVT. Scale bar = 100μm. C) Confocal image of the paraventricular nucleus (PVN of the hypothalamus (HY). Labeled cells appear to project processes outside of the nucleus and may be parvo- or magnocellular projection neurons, or both. Scale bar = 100μm. D) Low-resolution image highlighting the intense cellular and neuropil staining of the medial and lateral mammillary nuclei (MM and LM, respectively). Some additional fibrous staining is seen in the mammilotegmental tract (mtg). Scale bar = 500μm. E) Confocal image showing sparse EGFP immunoreactivity in the suprachiasmatic nucleus (SCN). While general immunoreactivity in the nucleus is less than the surrounding tissues, some intense, punctate fluorescence is observed. Scale bar = 100μm. The optic tract shows fibrous staining. Scattered neurons are labeled in the neighboring areas of the hypothalamus. Scale bar = 200μm. F) Confocal image showing sparse immunoreactivity in the suproptic nucleus (SON). Scale bar = 200μm. G) Confocal image of the subfornical organ (SFO). Little, if any, immunoreactivity is observed in this region. Scale bar = 100μm. H) Confocal image of the vascular organ of the lamina terminalis (OVLT). EGFP-labeled cells have a neuronal morphology in this region. Scale bar = 100μm. I) Low-resolution image showing intensely labeled cell bodies and processes in the ventromedial nucleus of the hypothalamus (VMH). Scale bar = 200μm. J) Confocal image showing the median eminence (ME) at a higher resolution. Diffuse immunofluorescence is observed in the ventral portion, with more punctate expression in the dorsal portion. Scale bar = 100μm.
Hypothalamus
Radioimmunoassays indicate that the highest concentrations of PACAP in the rat brain are in the hypothalamus (Arimura et al., 1991; Masuo et al., 1993; Hannibal et al., 1995a). Studies to localize expression using immunohistochemistry and in situ hybridization show that PACAP-expressing neuronal cell bodies are located in the parvocellular and magnocellular neurons of the paraventricular nucleus of the hypothalamus (Köves et al., 1991; Kivipelto et al., 1992; Kimura et al., 1994; Murase et al., 1995; Hannibal et al., 1995a; b; Piggins et al., 1996; Das et al., 2007). We observed intense staining for EGFP in neuronal perikarya within the paraventricular nucleus (Figure 5C), and in other regions of the hypothalamus shown to harbor cell bodies that express PACAP peptide or mRNA in rodents (Arimura et al., 1991; Masuo et al., 1991; 1993; Hannibal, 2002), including mammillary nuclei (Figure 5D). Notably, we found no EGFP immunoreactive perikarya and considerably less staining of fibers in the suprachiasmatic nucleus than in the surrounding hypothalamus (Figure 5E). However, using confocal microscopy some punctate immunoreactivity was evident within the nucleus that may correspond to axonal inputs into the nucleus. Hannibal (2002) reported intense fibrous staining in the SCN in the rat, and there is a wealth of evidence that PACAP-expressing nerve fibers innervate the nucleus (Hannibal et al., 1997; 2000; 2001; 2002; Michel et al., 2006). Interestingly, though, we do find EGFP signals in the optic nerve (Figure 5E). As with the IGL, our low-level fiber staining in the suprachiasmatic nucleus most likely reflect a relatively low amounts of EGFP protein in axon terminals compared to PACAP in these mice, although a species difference cannot be ruled out.
Elsewhere in the hypothalamus, there has been some controversy as to the pattern of PACAP expression in the supraoptic nucleus. Originally, Köves et al. (1991), using rabbit antisera targeting PACAP (no. 88121-3; (Köves et al., 1990) labeled cell bodies that were densely packed in the supraoptic nucleus of rats without the use of colchicine. This pattern of staining was repeated by Kivipelto et al. (1992) in rats with the same antisera, but only with colchicine administration. Hannibal (2002), using a mouse monoclonal antibody (code MabJHH1), reported dense fiber staining in the rat supraoptic nucleus, but not in cell bodies unless colchicine was employed. Of note, Hannibal (2002) found no gene expression in the supraoptic nucleus by in situ hybridization under normal conditions. We found no obvious GFP immunoreactive cell bodies (Figure 5F), in agreement with the Allen atlas, which showed no obvious gene expression in the supraoptic nucleus. Surprisingly we observed little, if any, fibrous staining within the supraoptic nucleus, which again may due to a species difference or a relative low amounts of EGFP or the inability of the GFP antibody to detect fibers in this structure.
Hannibal (2002) reported PACAP immunoreactivity in several of the hypothalamic circumventricular organs, including the subfornical organ (SFO), the vascular organ of the lamina terminalis (OVLT), and the median eminence (ME). While Hannibal observed fibrous staining in all aforementioned areas, only the SFO and OVLT were reported to have immunoreactive cell bodies. In situ hybridization data from the Allen Mouse Brain Atlas confirms expression in SFO and OVLT. In the PACAP-EGFP mouse we find few, if any, immunoreactive cells in the SFO, though some fibrous staining is evident (Figure 5G). The expression pattern of both cell bodies and fibers in the OVLT (Figure 5H), however, agrees with the previous studies). PACAP fibers were previously observed in the internal layer of the ME (Mikkelsen et al., 1995; Hannibal, 2002). In the PACAP-EGFP mouse we find a similar fibrous pattern of immunoreactivity, although the distribution of GFP immunoreactivity was more ventral than that reported for PACAP (Figure 5I, J). In more caudal regions of the hypothalamus we also observe EGFP-labeled cell bodies and fibers in the ventromedial hypothalamic nucleus (Figure 5I), in agreement with the results from Hannibal (2002) and the Allen Mouse Brain Atlas.
Midbrain
In the midbrain, we observe scattered neuronal perikarya in the periaqueductal gray. Higher density distributions of label cells are found in the dorsal raphe, cuneiform, and pedunculopontine nuclei (Figure 6A). There is very dense labeling of cell bodies and/or fibers in the ventral tegmental nucleus. The cell body staining in these areas is in agreement with in situ hybridization data in the rat (Hannibal, 2002) and in the Allen Mouse Brain Atlas. In the olivary pretectal nucleus (OPN), Hannibal (2002) reported dense fibrous staining, but observed no PACAP immunoreactivity in cell bodies. The Allen Mouse Brain Atlas, however, does report PACAP-mRNA expressing cells in the OPN, though only in the caudal portion of the nucleus. Here, we find EGFP immunoreactivity in cell bodies within the nucleus, though little fibrous staining overall (Figure 6B). In the area postrema (AP), a medullary circumventricular organ, Hannibal (2002) reported dense fibrous PACAP innervation, though no immunoreactive cell bodies. However, the Allen Mouse Brain Atlas does show sparse PACAP mRNA signals over cells within the structure. In our PACAP-EGFP mouse we observe a similar pattern of cellular staining in the AP compared to the Allen atlas, but very little fibrous staining contrary to Hannibal (2002; Figure 6C).
Figure 6. EGFP-immunoreactivity in the midbrain and medulla.
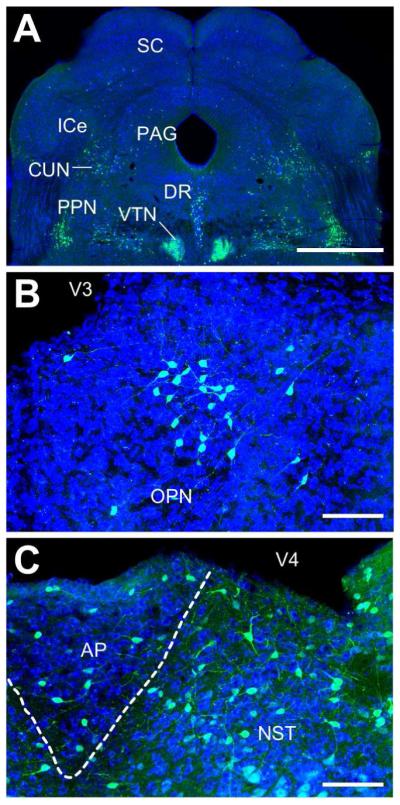
A) Low-resolution image showing several midbrain areas containing cell body staining of EGFP. These include the periaqueductal gray (PAG), the cuneiform (CUN), pedunculopontine (PPN), and dorsal raphe (DR) nuclei. The ventral tegmental nucleus is very densely labeled. Little staining is observed in the superior or inferior colliculi (SC and ICe, respectively). Scale bar = 500μm. B) Confocal image of the olivary pretectal nucleus (OPN). A subset of cell bodies and processes in this nucleus express EGFP. Scale bar = 100μm. C) Confocal image of area postrema (AP). A subset of cells with neuronal morphology express EGFP, though at a lower density than the neighboring nucleus of the solitary tract (NST). Scale bar = 100μm.
Hindbrain
Analysis of the hindbrain using the PACAP-EGFP reporter mouse showed localization of EGFP-positive neurons and projections consistent with previous reports. Dense innervation was previously observed in the parabrachial nuclei, with more in the lateral than medial nuclei (Hannibal, 2002; Das et al., 2007; Krashes et al., 2014). The portions of the lateral parabrachial nucleus, including the central, dorsal, ventral, internal and external parts were observed to contain a high density of somata and projections with fewer EGFP neurons in the medial parabrachial nucleus (Figure 7A). The dorsal tegmental nucleus contained fibrous staining, but no apparent cell bodies (Figure 7B). Some of the densest PACAP immunoreactivity has been reported in multiple nuclei of the solitary tract (Légrádi et al., 1994; Hannibal, 2002; Das et al., 2007; Dürr et al., 2007; Krashes et al., 2014). Similarly, we observed multiple nuclei (central, dorsolateral, ventrolateral, medial, dorsomedial and intermediate) of the solitary tract that are densely innervated, making it difficult to delineate all nuclei (Figure 7C-E). Significant hindbrain innervation was reported for the medial and spinal vestibular nuclei (Légrádi et al., 1994; Hannibal, 2002; Das et al., 2007; Krashes et al., 2014). The PACAP-EGFP reporter mouse shows the same innervation of the medial and spinal (data not shown) vestibular nuclei, which contained a greater density of EGFP neurons (Figure 7C) but the nucleus of the origin of efferents, the lateral, medial, posterodorsal and supravestibular nuclei are also innervated (data not shown). Finally, the nucleus ambiguus was previously reported to contain fibers and have a high density of somata (Légrádi et al., 1994; Hannibal, 2002; Das et al., 2007; Krashes et al., 2014). The PACAP-EGFP reporter mouse shows consistent dense non-cellular immunoreactive material but fewer somata than previously indicated (Figure 7E, F).
Figure 7. EGFP immunoreactivity in representative areas of the brainstem.

A) Low-resolution image of a cross-section of the hindbrain at the level of the cerebellum. Dense labeling of cell bodies is observed in the lateral and medial parabrachial nuclei (LPB and MPB, respectively). Also in the image, no significant staining is found in the cerebellum (CB). Some cells are labeled in the inferior colliculus, central nucleus (ICc), but the labeling is sparse. Scale bar = 1mm. B) High-resolution inset defined in (A), highlighting the fibrous staining pattern in the DTgC. Cellular labeling is observed in the pontine raphe nuclei (PnR). Scale bar = 200μm. C) Low-resolution image of a hindbrain cross-section more caudal than in (A). Intense EGFP immunoreactivity is found in the nuclei of the solitary tract (NST), the parvicellular reticular nucleus (PCRtA) and medial vestibular nucleus (MVe). At this level, few if any cells or fibers are found in the spinal trigeminal tract (Sp5). Scale bar = 1mm. D) High-resolution inset defined in (C) showing intensely labeled cell bodies and fibers in the NST. Scale bar = 200μm. E) Low-resolution image of a hindbrain cross-section more caudal than in (C). At this level there is also intense staining in the NST, as well as in the cuneate (CUN). Sparse cell bodies are labeled for EGFP in the dorsomedial and interpolar spinal trigeminal nuceli (DMSp5 and Sp5I, respectively). On coronal sections, the inferior olive (IO) exhibits alternating horizontal bands of high and low immunoreactivity. Scale bar = 1mm. F) High-resolution inset defined in (E) showing dense cell body and fibrous labeling in the nucleus ambiguous (Amb) and sparse labeling in the rostroventrolateral reticular nucleus (RVL). Scale bar = 100μm.
Sparse PACAP innervation of the inferior colliculus was previously noted (Hannibal, 2002) with similar innervation detected in the PACAP-EGFP reporter mouse (Figure 7A). Sparse innervation was also reported in the lateral paragigantocellular nucleus/C1/A5, the intermediate reticular nucleus/rostroventral reticular nucleus/A1, parvicellular nucleus and prepositius nucleus/C3 and inferior olive (Légrádi et al., 1994; Hannibal, 2002; Das et al., 2007; Krashes et al., 2014). We found similarly sparse somata in many reticular nuclei including the paragigantocellular nucleus, parvicellular, intermediate and prepositus nuclei with slightly greater density in the rostroventral reticular nucleus, and fibers only in the inferior olivary nuclei (Figure 7C,E and F).
Notable differences in the EGFP reporter mouse include expression in the trigeminal nuclei. Hannibal (2002) found no or minimal gene expression in the trigeminal nuclei, consistent with immunolocalization showing dense fiber innervation but none-to-few PACAP-positive somata. Specifically, dense fiber tracts were observed in the spinal trigeminal tract (Légrádi et al., 1994; Hannibal, 2002). However, the Allen Mouse Brain Atlas does show some gene expression, consistent with our observations. We find EGFP-positive neurons located within the caudalis, interpolar and dorsomedial spinal trigeminal nuclei with rare neurons are observed in the oralis subnucleus (Figure 7C, E). EGFP-positive neurons localized to the trigeminal nucleus caudalis are mostly seen at the boundary with the spinal trigeminal tract or the medullary reticular nucleus, which also contains some EGFP-positive somata (data not shown). Only a few fibers were observed in the spinal trigeminal tract in the EGFP reporter mice, and these appear to be projections from local somata (data not shown).
Differences regarding the presence of projections versus somata were noted that may reflect the ability to detect somatic levels of PACAP only after colchicine induction versus cytoplasmic-localized EGFP protein. Fibers were previously reported in the dorsal tegmental nuclei (Hannibal, 2002; Krashes et al., 2014). We observed both axon projections and somata in the dorsal tegmental central nucleus (Figure 7A, data not shown for somata). Immunolocalization of PACAP showed expression in fibers located in the locus coeruleus with a few PACAP-positive somata observed after induction with colchicine treatment (Hannibal, 2002). By contrast, we observed both fibers and a few sparse EGFP-positive somata without colchicine treatment (data not shown). Similarly, fibers were previously reported in the gracile and extracuneate nucleus (Légrádi et al., 1994; Hannibal, 2002). Again, we observed somata in the gracile nucleus (not shown) with a moderate number of somata in the rostral cuneate nucleus but not in the caudal cuneate or extracuneate nuclei (Figure 7E).
Additional differences were observed that may reflect variability in sections and expression in adjacent or related regions. Sparse innervation of the raphe pallidus and obscurus was previously observed by immunohistochemistry (Légrádi et al., 1994; Hannibal, 2002) in comparison to pontine raphe and dorsal interfascicular raphe somata observed in this reporter mouse (Figure 7A). Innervation of the ventral cochlear nuclei has been reported with no mention of the other cochlear nuclei (Hannibal, 2002) compared to the very sparse number of EGFP-positive somata we observed in the dorsal, central and ventral cochlear nuclei (data not shown).
Cerebellum
We observed very little staining of cell bodies or fibers in the cerebellar cortex, as represented in Figure 7A. This seems to be in contrast with previous reports of PACAP immunoreactivity in Purkinje cell bodies observed in the rat (Nielsen et al., 1998; Hannibal, 2002), as well as in situ hybridization in the Allen Mouse Brain Atlas, which shows what appear to be prominent expression in Purkinje cells. Scattered EGFP immunoreactive cells and fibers were observed in the deep cerebellar nuclei the PACAP-EGFP mice, consistent with Hannibal (2002).
Spinal Cord
We find intense staining of cell bodies in the Sp1 layer of the dorsal horn (Figure 8A-C), with more sparse cell distribution in the intermediolateral column of the lateral gray column (Figure 8A,B,D). Fibrous staining occurs throughout the lateral gray column, as well as the dorsal corticospinal tract (Figure 8A). Our findings of EGFP expression in the dorsal gray horn of spinal cord corresponds with previously published PACAP expression studies (Ghatei et al., 1993; Moller et al., 1993; Pettersson et al., 2004). PACAP-immunoreactive cell bodies were also described in smaller diameter dorsal root ganglia neurons terminating in dorsal horn (Moller et al., 1993; Legradi et al., 1994).
Figure 8. EGFP immunoreactivity in the cervical and thoracic spinal cord.
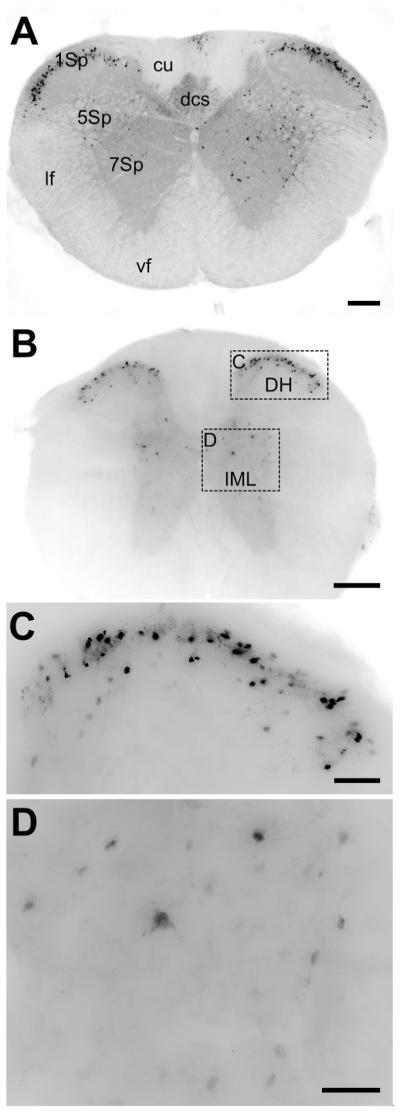
A) Low resolution image of a cross-section of the cervical spinal cord. The gray matter of the spinal cord is diffusely labeled for EGFP, as is the dorsal corticospinal tract (dcs). Intense labeling of cell bodies is observed in lamina 1, with more scattered cell labeling in laminae 5 and 7. Scale bar = 200μm. B) Low-resolution image of a cross-section of thoracic spinal cord. There is a similar pattern of EGFP immunoreactivity to that in (A). Scale bar = 200μm. C) High-resolution inset of the dorsal horn area defined in (B). Many cells in this area are intensely stained. Scale bar = 50μm. D) High-resolution inset of the intermediolateral column (IML) showing dispersed neurons and processes stained for GFP. Scale bar = 50μm.
Retina and optic nerve
In the retina, we find cell bodies expressing EGFP in the ganglion layer of the retina, though only in a subset of the cells in the layer. Additionally, we find punctate staining in the inner plexiform layer and fibrous staining in the inner nuclear and outer plexiform layer (Figure 9A). This is in agreement with PACAP immunoreactivity in the rat, in which PACAP is found in a subset of retinal ganglion cells that co-express melanopsin (Hannibal et al., 2000; 2002; Hannibal, 2002). In the optic nerve we do see EGFP immunostaining of some axons (Figure 9B), presumably corresponding to the PACAP projections in the retinohypothalamic tract. While the staining in the optic nerve appears to be punctate, the puncta do form a linear pattern, suggesting axonal expression.
Figure 9. EGFP immunoreactivity in the retina and optic nerve.

A) Confocal image of a retinal cross section. EGFP-expressing cell bodies are found in the retinal ganglion cell layer (RGC). EGFP puncta and fibrous staining is apparent in the inner plexiform, inner nuclear, and outer plexiform layers (IPL, INL, and OPL, respectively). Scale bar = 50μm. B) Confocal image of a longitudinal section of the optic nerve from a PACAP-EGFP mouse. While EGFP immunoreactivity is evident, immunoreactive fibers are relatively sparse. Scale bar = 20μm.
Facial Nerve Axotomy
Since these mice express EGFP from the PACAP promoter sequences inserted into a BAC, we wanted to test whether expression levels of EGFP would be regulated in a similar manner as PACAP. Previous studies have shown that axotomy of the facial nerve results in a robust increase in expression of mRNA in the ipsilateral facial motor nucleus, peaking at 48 hours post-axotomy (Zhou et al., 1999; Armstrong et al., 2004; 2006). In the PACAP-EGFP mice, EGFP expression is absent in the facial motor nucleus under basal conditions. However, consistent with the previous findings, 48 hours after facial nerve axotomy we observed a massive increase in EGFP immunoreactivity in the ipsilateral, but not contralateral facial motor nucleus (Figure 10). The expression was limited to a subset of large neurons within the facial motor nucleus, consistent with the earlier reports of gene expression in axotomized rats and mice (Zhou et al., 1999; Armstrong et al., 2004; 2006). Co-labeling with an astrocyte marker (S100β) did not reveal any overlap with the GFP signal in neither the facial motor nucleus nor any other observed region (data not shown), suggesting that in this model of injury, PACAP is not expressed in astrocytes. These results show that the EGFP expression in these transgenic mice can follow changes in PACAP expression, and therefore can be used as a surrogate model for modulation of PACAP expression.
Figure 10. EGFP in the facial motor nucleus resulting from facial nerve axotomy.
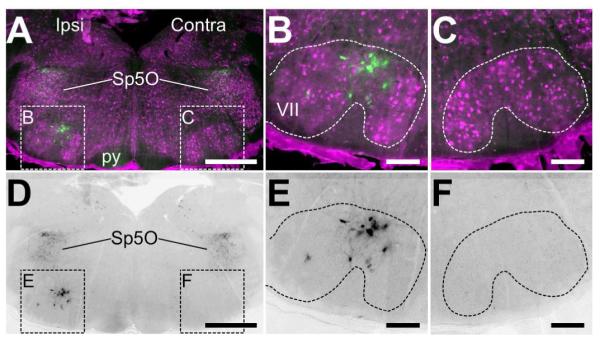
A) and D) Low-resolution images of the hindbrain showing the facial motor nuclei ispi- and contra-lateral to the site of facial nerve axotomy. In (A), NeuN immunostaining (magenta) shows the anatomical position of the facial motor nucleus (VII). Only on the ipsilateral side are there cells intensely labeled for EGFP in VII, whereas labeled cells can be found in the spinal nucleus of the trigeminal oral part (Sp5O) and diffuse staining in the pyramid of the corticospinal tract (py). In (D), only the EGFP immunoreactivity of the image in (A). Scale bars = 200μm. B) and E) High-resolution insets of the ipsilateral VII containing EGFP-positive cells defined in (A) and (D). The cells are large in size and have a neural morphology with processes. Scale bars = 50μm. C) and F) High-resolution insets of the contralateral VII defined in (A) and (D). No EGFP immunoreactivity is detected. Scale bars = 50μm.
DISCUSSION
The results of this comparative analysis suggest that the PACAP-EGFP mouse generally represents the known distribution pattern of PACAP expressing cell bodies and indirectly, to some extent, the distribution of PACAP immunoreactive nerve fibers. The concordance of the former with data in the Allen Mouse Brain Atlas is quite high (Table 4). There are only a few neuronal populations for which the Allen Atlas demonstrated PACAP mRNA expression that did not exhibit corresponding EGFP+ perikarya in PACAP-EGFP mice. These include the medial and lateral habenula, the inferior olivary nuclei, and the cerebellar Purkinje cells (Table 4). No regions of ectopic reporter expression were observed in brain in the PACAP-EGFP mice. Most other differences reflect variation in labeling density, which may be attributable to the variable nature of immunohistological analysis of small diffusible peptides and variation in regions analyzed. With respect to previously published data of PACAP axon terminals, a few inconsistencies are noted. The most obvious being the lack of intense immunoreactivity in areas innervated by retinal projections, such as the SCN, SON, IGL, and OPN. As discussed, EGFP is not likely subject to the same axonal transport mechanisms as PACAP, so it is possible that this is due to a failure of EGFP to diffuse in large concentrations down these axons and/or lack of clustering at axon terminals.
It can be difficult to detect certain proteins in long axon tracts. For example, Hannibal (2002) detected PACAP most intensely in terminal axonal projections, and in some cases in the presumed corresponding soma, but practically no reactivity in relevant white matter tracts. On the other hand, an advantage of the PACAP-EGFP mouse model may be the ability to track long range axons from PACAP-expressing neurons in which the EGFP diffuses freely in the cytoplasm. Here, we find that many white matter tracts in the brain are EGFP immunoreactive, albeit in varying degrees. The intensity seems to correspond to the density of EGFP-expressing axons that feed into the white matter tracts. For example, as with previous reports of PACAP, EGFP is expressed only in a subset of retinal ganglion cells in the reporter mouse. Accordingly, there is some EGFP immunoreactivity in the optic nerve (Figure 9B), but it is less intense than in some other white matter tracts. The anterior commissure is also an example of a white matter tract in which EGFP intensity varies depending on the source of presumed inputs. The anterior limb contains axons originating from the accessory olfactory bulb and the anterior piriform cortex (Brunjes 2013). While the piriform cortex does contain a high density of EGFP-reactive neurons (data not shown), the accessory olfactory bulb has a fairly low density of immunoreactivity (Figure 1A). In contrast the posterior limb of the anterior commissure contains axons from the cortex and amygdala, two regions that have a very high density of EGFP-expressing cell bodies (Figures 2 and 4). As such, the posterior limb of the anterior commissure is more intensely stained for EGFP (Figure 4B). Similarly, the ventral portion of the corpus callosum is more immunoreactive than the dorsal portion (Figure 2E), corresponding to the different densities of EGFP-expressing cell bodies in the cortical sources, as discussed above. Located immediately ventral to the corpus callosum is the dorsal fornix, a white matter tract that contains axons from the CA1 region of the hippocampus. While there are EGFP-expressing cell bodies in CA1 (Figure 3A, B), they are relatively sparse. This corresponds to the lower intensity of immunostaining in the dorsal fornix (Figure 2E). While at least some EGFP immunoreactivity is found in most white matter tracts, notably there is none found in the cerebellar white matter, as there is no expression in Purkinje neurons.
Presumably most of the PACAP peptide within a neuron is localized to axon terminals where it can be released. For this reason, Hannibal (2002) used colchicine treatment to observe PACAP immunoreactivity in cell bodies in some brain regions. However, it is known that colchicine can induce neuropeptide expression (Cortés et al., 1990). The use of colchicine could explain some of the differences in reported PACAP expression in the present and past studies. Furthermore, cross-reactivity of antibody binding or in situ hybridization probes could explain some of the discrepancies. In the BAC transgenic mouse used in this study, the expression of EGFP is driven by PACAP gene regulatory elements on the transgene. EGFP is allowed to freely distribute in the cytoplasm, thereby labeling both cell bodies and processes of PACAP-expressing cells, overcoming the need for colchicine treatment. A consideration, of course, with this model is that expression is measured indirectly, and therefore may not always faithfully or completely reproduce endogenous expression patterns. This may be due to a possibly incomplete set of PACAP regulatory sequences or expression inappropriately repressed or enhanced by non-PACAP gene regulatory elements at the site of its random insertion. These latter possibilities may account for some of the inconsistencies where EGFP was found to be lacking in areas of reported PACAP expression, such as in the Purkinje cell layer. Lastly, there may be species differences between PACAP expression between the rats used in previous studies (Köves et al., 1991; Kivipelto et al., 1992; Kimura et al., 1994; Hannibal et al., 1995a; b; Piggins et al., 1996; Hannibal, 2002) and the mice used in this study and the Allen Mouse Brain Atlas. However, given the numerous consistencies within these results and previously published reports, this model can be a useful tool to study PACAP expression in mice.
To date, at least two other PACAP transgenic mouse lines have been generated by embryonic stem cell targeting that can potentially be used as PACAP reporter lines. In one, an internal ribosomal entry site (IRES)-Cre cassette was inserted into the PACAP gene just downstream of the stop codon so that both PACAP and Cre would be bi-cistronically expressed under the control of endogenous PACAP gene (Adcyap1tm1.1(cre)Mjkr MGI:5562871; Krashes et al., 2014). Although Cre expression was not directly examined, this line was crossed to a reporter line that expresses EGFP as a result of Cre-mediated recombination. While the expression pattern in this line generally resembles that which we find in our BAC transgenic line, a notable difference is seen in the cortex. Whereas we find EGFP expression in cell bodies in all layers of the cortex save layer 1, the expression pattern in the PACAP-IRES-Cre line seems to be largely restricted to layers 5 and 6. The difference could be due to insufficient Cre expression in some cell populations, particularly if the translation rate of Cre is a fraction of that for PACAP due to the lower efficiency of IRES as a driver (Bochkov and Palmenberg, 2006). Supporting this hypothesis, in situ hybridization and PCR reports show that Cre gene expression is most intense in layer 5 (Stumm et al., 2007; Hu et al., 2011), suggesting that the transcription level of recombinase in this transgenic model may be too low in other layers to affect the reporter gene. This potential effect could explain the lack of EGFP expression in the corpus callosum of the PACAP-IRES-Cre mice, since there is no expression in cortical layers 2/3, where the callosal projections are believed to originate (Wang et al., 2007).
The second mouse line was developed by the Allen Institute of Brain Science, using a different bicistronic knock-in system to create an Adcyap1-2A-Cre mouse line. In this F2A system, the resulting endogenous peptide, in this case PACAP, is thought to be translated at levels approximately equal to the reporter, unlike the frequently observed decreased expression of peptides downstream of the IRES element (Chan et al., 2011). Cre expression is thus expected to be higher in these mice than in the line reported by Krashes et al. (2014). In situ hybridization for Cre recombinase in the Adcyap1-2A-Cre strain (found on the Allen Mouse Brain Atlas website) yields a pattern of expression consistent with previous studies of PACAP. Interestingly, this line has been used by the Allen Mouse Connectivity Project to trace PACAP connectivity through targeted viral injections of a floxed reporter. On the other hand, analysis of a recombined (tdTomato) reporter in Adcyap1-2A-Cre mice crossed with the Ai14 reporter (Jackson Laboratories) gave a strikingly different pattern of gene expression (also found on the Allen Brain Atlas website). Nearly every brain structure appears to have tdTomato gene expression, including areas not previously identified by PACAP immunoreactivity or in situ hybridization, such as in the caudatoputamen. This points out a problem when using a Cre/Lox system as a surrogate for genes such as PACAP that are expressed in populations of progenitor cells. If Cre induces recombination in progenitor cells, the mutation will in turn be passed to all progeny, regardless of whether or not Cre continues to be expressed. On the other hand, Cre mice such as these can be particularly useful for manipulating other genes in PACAP-expressing cells, as demonstrated by Krashes et al. (2014).
In summary we demonstrate here that the PACAP-EGFP mouse line can be used as a proxy for PACAP expression in cell bodies and processes. They also appear to mimic changes in gene expression under certain experimental conditions, as with the example of EGFP expression modulation in the facial nerve axotomy injury model. Further studies will need to address whether the transgene in these mice is correctly regulated under by other manipulations. Other applications for this mouse strain include, but are not limited to co-labeling for activity markers (c-fos, e.g.) to determine if PACAP expression neurons are activated under various experimental conditions, in vivo identification of PACAP-expressing neurons for electrophysiological stimulation and recording, colocalizing retrograde and anterograde tracers to map neuronal circuits to PACAP-expressing neurons, and 3D imaging PACAP innervation and connectivity by high-resolution optical sectioning.
Table 1.
List of Abbreviations Used in Figures
| 1Sp | Lamina 1 of the spinal cord |
| 5Sp | Lamina 5 of the spinal cord |
| 7Sp | Lamina 7 of the spinal cord |
| ac | Anterior commissure |
| alac | Anterior limb of the anterior commissure |
| Amb | Nucleus ambiguous |
| AOB | Accessory olfactory bulb |
| AON | Anterior olfactory nucleus |
| AP | Area postrema |
| ARH | Arcuate hypothalamic nucleus |
| AV | Anteroventral nucleus of the thalamus |
| BA | Basal amygdala |
| CA1 | Field CA1 of the hippocampus |
| CA2 | Field CA2 of the hippocampus |
| CA3 | Field CA3 of the hippocampus |
| CB | Cerebellum |
| CC | Corpus callosum |
| CeA | Central amygdala |
| cing | Cingulum bundle |
| CP | Caudatoputamen |
| CTX | Neocortex |
| cu | cuneate fasiculus |
| CUN | Cuneiform nucleus |
| dBNST | Dorsal bed nucleus of the stria terminalis |
| dcs | Dorsal corticospinal tract |
| df | Dorsal fornix |
| DG | Dentate gyrus |
| DH | Dorsal horn of the spinal cord |
| DMSp5 | Dorsomedial spinal trigeminal nucleus |
| DR | Dorsal raphe nucleus |
| DRI | Dorsal raphe nucleus, interfasicular part |
| DTgC | Dorsal tegmental nucleus, central part |
| em | External medullary lamina of the thalamus |
| fr | Fasciculus retroflexus |
| GL | Glomerular layer of the olfactory bulb |
| GPe | Globus pallidus, external segment |
| gr | Granule cell layer of the olfactory bulb |
| HY | Hypothalamus |
| Icc | Inferior colliculus, central nucleus |
| Ice | Inferior colliculus, external nucleus |
| IG | Induseum griseum |
| IML | Intermediolateral column of the spinal cord |
| INL | Inner nuclear layer of the retina |
| int | Internal capsule |
| IO | Inferior olive |
| IPL | Inner plexiform layer of the retina |
| LA | Lateral amygdala |
| LD | Lateral dorsal nucleus of the thalamus |
| lf | Lateral funiculus |
| LH | Lateral habenula |
| LM | Lateral mammillary body of the hypothalamus |
| LPB | Lateral parabrachial nucleus |
| LS | Lateral septum |
| MCL | Mitral cell layer of the olfactory bulb |
| MD | Mediodorsal nucleus of the thalamus |
| ME | Median eminence |
| MH | Medial habenula |
| MM | Medial mammillary body of the hypothalamus |
| mo | Molecular layer of the dentate gyrus |
| MPB | Medial parabrachial nucleus |
| mtg | Mammilotegmental tract |
| Mve | Medial vestibular nucleus |
| NST | Nuclei of the solitary tract |
| ONL | Outer nuclear layer of the retina |
| opl | Outer plexiform layer of the olfactory bulb |
| OPL | Outer plexiform layer of the retina |
| OPN | Olivary pretectal nucleus |
| opt | Optic tract |
| OVLT | Vascular organ of the lamina terminalis |
| PAG | Periaqueductal gray |
| PCRtA | Parvicellular reticular nucleus |
| plac | Posterior limb of the anterior commissure |
| PnR | Pontine raphe nucleus |
| po | Polymorph layer of the dentate gyrus (hilus) |
| PPN | Pedunculopontine nucleus |
| PVN | Paraventricular nucleus of the hypothalamus |
| PVT | Paraventricular nucleus of the thalamus |
| py | Pyramid of the corticospinal tract |
| RGC | Retinal ganglion cell layer |
| RSP | Retrosplenial area |
| RVL | Rostroventrolateral reticular nucleus |
| SC | Superior colliculus |
| SCN | Suprachiasmatic nucleus |
| SFO | Subfornical organ |
| sg | Granule layer of the dentate gyrus |
| slm | Stratum lacunosum-moleculare of the hippocampus |
| so | Stratum oriens of the hippocampus |
| SON | Supraoptic nucleus |
| sp | Pyramidal layer of the hippocampus |
| SP5I | Spinal trigeminal nucleus, interpolar part |
| Sp5O | Spinal nucleus of the trigeminal, oral part |
| sr | Stratum radiatum of the hippocampus |
| TH | Thalamus |
| V3 | Third ventricle |
| V4 | Fourth ventricle |
| VA | Ventral anteriolateral nucleus of the thalamus |
| vBNST | Ventral bed nucleus of the stria terminalis |
| vf | Ventral funiculus |
| vhc | Ventral hippocampal commisure |
| VII | Facial motor nucleus (cranial nerve 7) |
| VMH | Ventromedial hypothalamic nucleus |
| VP | Ventral posterior nucleus of the thalamus |
| VTN | Ventral tegmental nucleus |
OTHER ACKNOWLEDGEMENTS
The authors acknowledge Ivan Garcia and for assistance with the immunohistochemistry assays, and Marita Meyer for assistance with acquiring digital images. We also gratefully acknowledge the support of Dr. Michael B. Gorin (Jules Stein Eye Institute, UCLA). We also thank the anonymous reviewers and editor Prof. Paul Sawchenko for suggestions to improve the original manuscript.
Grant Sponsors: National Institutes of Health (MH09850 and HD04612), National Multiple Sclerosis Society (RG4859), Department of Defense, Congressionally Directed Medical Research (MS120120), Program for Advancing Strategic International Networks to Accelerate the Circulation of Talented Researchers (S2603, Japan), Simons Foundation for Autism Research (296925; YA), an unrestricted grant from the Research to Prevent Blindness, Inc. to the Department of Ophthalmology, Knights Templar Eye Foundation (AM), Harold and Pauline Price Chair in Ophthalmology, The Gerald Oppenheimer Family Foundation Award for the Prevention of Eye Disease.
Footnotes
CONFLICT OF INTEREST
The authors declare no conflicts of interest.
ROLE OF AUTHORS
MCC, AM, and JAW conceived the project. MCC, AM, NNF, SP, BJ, EN and ALD provided the figures for the manuscript. MCC, AM, YA, AKR, EN, BJ, VM and JAW contributed to the analysis and writing of the manuscript, which was supervised by MCC. Funding of this study comes from grants awarded to JAW, VM and HWD.
LITERATURE CITED
- Arimura A, Somogyvari-Vigh A, Miyata A, Mizuno K, Coy DH, Kitada C. Tissue distribution of PACAP as determined by RIA: highly abundant in the rat brain and testes. Endocrinology. 1991;129:2787–2789. doi: 10.1210/endo-129-5-2787. [DOI] [PubMed] [Google Scholar]
- Armstrong BD, Abad C, Chhith S, Cheung-Lau G, Hajji OE, Coûté A-C, Ngo DH, Waschek JA. Impairment of axotomy-induced pituitary adenylyl cyclase-activating peptide gene expression in T helper 2 lymphocyte-deficient mice. Neuroreport. 2006;17:309–312. doi: 10.1097/01.wnr.0000199465.54907.74. [DOI] [PubMed] [Google Scholar]
- Armstrong BD, Hu Z, Abad C, Yamamoto M, Rodriguez WI, Cheng J, Lee M, Chhith S, Gomariz RP, Waschek JA. Induction of neuropeptide gene expression and blockade of retrograde transport in facial motor neurons following local peripheral nerve inflammation in severe combined immunodeficiency and BALB/C mice. Neuroscience. 2004;129:93–99. doi: 10.1016/j.neuroscience.2004.06.085. [DOI] [PubMed] [Google Scholar]
- Bochkov YA, Palmenberg AC. Translational efficiency of EMCV IRES in bicistronic vectors is dependent upon IRES sequence and gene location. BioTechniques. 2006;41:283–292. doi: 10.2144/000112243. [DOI] [PubMed] [Google Scholar]
- Brunjes PC. The mouse olfactory peduncle. 2.The anterior limb of the anterior commissure. Frontiers in Neuroanatomy. 2012;6:51. doi: 10.3389/fnana.2012.00051. [DOI] [PMC free article] [PubMed] [Google Scholar]
- Chan HY, Xing X, Kraus P, Yap SP, Ng P, Lim SL, Lufkin T. Comparison of IRES and F2A-based locus-specific multicistronic expression in stable mouse lines. PLoS ONE. 2011;6:e28885. doi: 10.1371/journal.pone.0028885. V S. [DOI] [PMC free article] [PubMed] [Google Scholar]
- Cortés R, Ceccatelli S, Schalling M, Hökfelt T. Differential effects of intracerebroventricular colchicine administration on the expression of mRNAs for neuropeptides and neurotransmitter enzymes, with special emphasis on galanin: an in situ hybridization study. Synapse. 1990;6:369–391. doi: 10.1002/syn.890060410. [DOI] [PubMed] [Google Scholar]
- Das M, Vihlen CS, Legradi G. Hypothalamic and brainstem sources of pituitary adenylate cyclase-activating polypeptide nerve fibers innervating the hypothalamic paraventricular nucleus in the rat. J Comp Neurol. 2007;500:761–776. doi: 10.1002/cne.21212. [DOI] [PMC free article] [PubMed] [Google Scholar]
- Dejda A, Jolivel V, Bourgault S, Seaborn T, Fournier A, Vaudry H, Vaudry D. Inhibitory effect of PACAP on caspase activity in neuronal apoptosis: a better understanding towards therapeutic applications in neurodegenerative diseases. J Mol Neurosci. 2008;36:26–37. doi: 10.1007/s12031-008-9087-1. [DOI] [PubMed] [Google Scholar]
- Delgado M, Pozo D, Ganea D. The significance of vasoactive intestinal peptide in immunomodulation. Pharmacological Reviews. 2004;56:249–290. doi: 10.1124/pr.56.2.7. [DOI] [PubMed] [Google Scholar]
- Dun EC, Huang RL, Dun SL, Dun NJ. Pituitary adenylate cyclase activating polypeptide-immunoreactivity in human spinal cord and dorsal root ganglia. Brain Res. 1996;721:233–237. doi: 10.1016/0006-8993(96)00139-4. [DOI] [PubMed] [Google Scholar]
- Dürr K, Norsted E, Gömüç B, Suarez E, Hannibal J, Meister B. Presence of pituitary adenylate cyclase-activating polypeptide (PACAP) defines a subpopulation of hypothalamic POMC neurons. Brain Res. 2007;1186:203–211. doi: 10.1016/j.brainres.2007.10.015. [DOI] [PubMed] [Google Scholar]
- Falluel-Morel A, Chafai M, Vaudry D, Basille M, Cazillis M, Aubert N, Louiset E, de Jouffrey S, Le Bigot J-F, Fournier A, Gressens P, Rostène W, Vaudry H, Gonzalez BJ. The neuropeptide pituitary adenylate cyclase-activating polypeptide exerts anti-apoptotic and differentiating effects during neurogenesis: focus on cerebellar granule neurones and embryonic stem cells. J Neuroendocrinol. 2007;19:321–327. doi: 10.1111/j.1365-2826.2007.01537.x. [DOI] [PubMed] [Google Scholar]
- Ghatei MA, Takahashi K, Suzuki Y, Gardiner J, Jones PM, Bloom SR. Distribution, molecular characterization of pituitary adenylate cyclase-activating polypeptide and its precursor encoding messenger RNA in human and rat tissues. J Endocrinol. 1993;136:159–166. doi: 10.1677/joe.0.1360159. [DOI] [PubMed] [Google Scholar]
- Gong S, Kus L, Heintz N. Rapid bacterial artificial chromosome modification for large-scale mouse transgenesis. Nat Protoc. 2010;5:1678–1696. doi: 10.1038/nprot.2010.131. [DOI] [PMC free article] [PubMed] [Google Scholar]
- Gong S, Zheng C, Doughty ML, Losos K, Didkovsky N, Schambra UB, Nowak NJ, Joyner A, Leblanc G, Hatten ME, Heintz N. A gene expression atlas of the central nervous system based on bacterial artificial chromosomes. Nature. 2003;425:917–925. doi: 10.1038/nature02033. [DOI] [PubMed] [Google Scholar]
- Hammack SE, Roman CW, Lezak KR, Kocho-Shellenberg M, Grimmig B, Falls WA, Braas K, May V. Roles for pituitary adenylate cyclase-activating peptide (PACAP) expression and signaling in the bed nucleus of the stria terminalis (BNST) in mediating the behavioral consequences of chronic stress. J Mol Neurosci. 2010;42:327–340. doi: 10.1007/s12031-010-9364-7. [DOI] [PMC free article] [PubMed] [Google Scholar]
- Hannibal J, Ding JM, Chen D, Fahrenkrug J, Larsen PJ, Gillette MU, Mikkelsen JD. Pituitary adenylate cyclase-activating peptide (PACAP) in the retinohypothalamic tract: a potential daytime regulator of the biological clock. J Neurosci. 1997;17:2637–2644. doi: 10.1523/JNEUROSCI.17-07-02637.1997. [DOI] [PMC free article] [PubMed] [Google Scholar]
- Hannibal J, Hindersson P, Knudsen SM, Georg B, Fahrenkrug J. The photopigment melanopsin is exclusively present in pituitary adenylate cyclase-activating polypeptide-containing retinal ganglion cells of the retinohypothalamic tract. J Neurosci. 2002;22:RC191. doi: 10.1523/JNEUROSCI.22-01-j0002.2002. [DOI] [PMC free article] [PubMed] [Google Scholar]
- Hannibal J, Mikkelsen JD, Clausen H, Holst JJ, Wulff BS, Fahrenkrug J. Gene expression of pituitary adenylate cyclase activating polypeptide (PACAP) in the rat hypothalamus. Regulatory Peptides. 1995a;55:133–148. doi: 10.1016/0167-0115(94)00099-j. [DOI] [PubMed] [Google Scholar]
- Hannibal J, Mikkelsen JD, Fahrenkrug J, Larsen PJ. Pituitary adenylate cyclase-activating peptide gene expression in corticotropin-releasing factor-containing parvicellular neurons of the rat hypothalamic paraventricular nucleus is induced by colchicine, but not by adrenalectomy, acute osmotic, ether, or restraint stress. Endocrinology. 1995b;136:4116–4124. doi: 10.1210/endo.136.9.7649120. [DOI] [PubMed] [Google Scholar]
- Hannibal J, Møller M, Ottersen OP, Fahrenkrug J. PACAP and glutamate are co-stored in the retinohypothalamic tract. J Comp Neurol. 2000;418:147–155. [PubMed] [Google Scholar]
- Hannibal J, Vrang N, Card JP, Fahrenkrug J. Light-dependent induction of cFos during subjective day and night in PACAP-containing ganglion cells of the retinohypothalamic tract. J Biol Rhythms. 2001;16:457–470. doi: 10.1177/074873001129002132. [DOI] [PubMed] [Google Scholar]
- Hannibal J. Pituitary adenylate cyclase-activating peptide in the rat central nervous system: an immunohistochemical and in situ hybridization study. J Comp Neurol. 2002;453:389–417. doi: 10.1002/cne.10418. [DOI] [PubMed] [Google Scholar]
- Hashimoto H, Shintani N, Tanida M, Hayata A, Hashimoto R, Baba A. PACAP is implicated in the stress axes. Curr Pharm Des. 2011;17:985–989. doi: 10.2174/138161211795589382. [DOI] [PMC free article] [PubMed] [Google Scholar]
- Hestrin S, Armstrong WE. Morphology and physiology of cortical neurons in layer I. J Neurosci. 1996;16:5290–5300. doi: 10.1523/JNEUROSCI.16-17-05290.1996. [DOI] [PMC free article] [PubMed] [Google Scholar]
- Hu E, Demmou L, Cauli B, Gallopin T, Geoffroy H, Harris-Warrick RM, Paupardin-Tritsch D, Lambolez B, Vincent P, Hepp R. VIP, CRF, and PACAP act at distinct receptors to elicit different cAMP/PKA dynamics in the neocortex. Cereb Cortex. 2011;21:708–718. doi: 10.1093/cercor/bhq143. [DOI] [PMC free article] [PubMed] [Google Scholar]
- Jinno S, Klausberger T, Marton LF, Dalezios Y, Roberts JDB, Fuentealba P, Bushong EA, Henze D, Buzsáki G, Somogyi P. Neuronal diversity in GABAergic long-range projections from the hippocampus. J Neurosci. 2007;27:8790–8804. doi: 10.1523/JNEUROSCI.1847-07.2007. [DOI] [PMC free article] [PubMed] [Google Scholar]
- Kimura S, Ohshige Y, Lin L, Okumura T, Yanaihara C, Yanaihara N, Shiotani Y. Localization of pituitary adenylate cyclase-activating polypeptide (PACAP) in the hypothalamus-pituitary system in rats: light and electron microscopic immunocytochemical studies. J Neuroendocrinol. 1994;6:503–507. doi: 10.1111/j.1365-2826.1994.tb00612.x. [DOI] [PubMed] [Google Scholar]
- Kivipelto L, Absood A, Arimura A, Sundler F, Håkanson R, Panula P. The distribution of pituitary adenylate cyclase-activating polypeptide-like immunoreactivity is distinct from helodermin- and helospectin-like immunoreactivities in the rat brain. J Chem Neuroanat. 1992;5:85–94. doi: 10.1016/0891-0618(92)90036-p. [DOI] [PubMed] [Google Scholar]
- Köves K, Arimura A, Görcs TG, Somogyvari-Vigh A. Comparative distribution of immunoreactive pituitary adenylate cyclase activating polypeptide and vasoactive intestinal polypeptide in rat forebrain. Neuroendocrinology. 1991;54:159–169. doi: 10.1159/000125864. [DOI] [PubMed] [Google Scholar]
- Köves K, Arimura A, Somogyvari-Vigh A, Vigh S, Miller J. Immunohistochemical demonstration of a novel hypothalamic peptide, pituitary adenylate cyclase-activating polypeptide, in the ovine hypothalamus. Endocrinology. 1990;127:264–271. doi: 10.1210/endo-127-1-264. [DOI] [PubMed] [Google Scholar]
- Krashes MJ, Shah BP, Madara JC, Olson DP, Strochlic DE, Garfield AS, Vong L, Pei H, Watabe-Uchida M, Uchida N, Liberles SD, Lowell BB. An excitatory paraventricular nucleus to AgRP neuron circuit that drives hunger. Nature. 2014;507:238–242. doi: 10.1038/nature12956. [DOI] [PMC free article] [PubMed] [Google Scholar]
- Legradi G, Görcs TJ, Arimura A. PACAP-Iike immunoreactivity and binding sites in putative nociceptive pathways of the spinal cord and brainstem. In: Rosselin G, editor. Vasoactive Intestinal Peptide, Pituitary Adenylate Cyclase Activating Polypeptide and Related Regulatory Peptides, from Molecular Biology to Clinical Applications. World Scientific; Singapore: 1994. pp. 283–292. [Google Scholar]
- Lein ES, Hawrylycz MJ, Ao N, Ayres M, Bensinger A, Bernard A, Boe AF, Boguski MS, Brockway KS, Byrnes EJ, Chen L, Chen L, Chen T-M, Chin MC, Chong J, Crook BE, Czaplinska A, Dang CN, Datta S, Dee NR, Desaki AL, Desta T, Diep E, Dolbeare TA, Donelan MJ, Dong H-W, Dougherty JG, Duncan BJ, Ebbert AJ, Eichele G, Estin LK, Faber C, Facer BA, Fields R, Fischer SR, Fliss TP, Frensley C, Gates SN, Glattfelder KJ, Halverson KR, Hart MR, Hohmann JG, Howell MP, Jeung DP, Johnson RA, Karr PT, Kawal R, Kidney JM, Knapik RH, Kuan CL, Lake JH, Laramee AR, Larsen KD, Lau C, Lemon TA, Liang AJ, Liu Y, Luong LT, Michaels J, Morgan JJ, Morgan RJ, Mortrud MT, Mosqueda NF, Ng LL, Ng R, Orta GJ, Overly CC, Pak TH, Parry SE, Pathak SD, Pearson OC, Puchalski RB, Riley ZL, Rockett HR, Rowland SA, Royall JJ, Ruiz MJ, Sarno NR, Schaffnit K, Shapovalova NV, Sivisay T, Slaughterbeck CR, Smith SC, Smith KA, Smith BI, Sodt AJ, Stewart NN, Stumpf K-R, Sunkin SM, Sutram M, Tam A, Teemer CD, Thaller C, Thompson CL, Varnam LR, Visel A, Whitlock RM, Wohnoutka PE, et al. Genome-wide atlas of gene expression in the adult mouse brain. Nature. 2007;445:168–176. doi: 10.1038/nature05453. [DOI] [PubMed] [Google Scholar]
- Légrádi G, Shioda S, Arimura A. Pituitary adenylate cyclase-activating polypeptide-like immunoreactivity in autonomic regulatory areas of the rat medulla oblongata. Neurosci Lett. 1994;176:193–196. doi: 10.1016/0304-3940(94)90080-9. [DOI] [PubMed] [Google Scholar]
- Masuo Y, Matsumoto Y, Tokito F, Tsuda M, Fujino M. Effects of vasoactive intestinal polypeptide (VIP) and pituitary adenylate cyclase activating polypeptide (PACAP) on the spontaneous release of acetylcholine from the rat hippocampus by brain microdialysis. Brain Res. 1993;611:207–215. doi: 10.1016/0006-8993(93)90504-g. [DOI] [PubMed] [Google Scholar]
- Masuo Y, Ohtaki T, Masuda Y, Nagai Y, Suno M, Tsuda M, Fujino M. Autoradiographic distribution of pituitary adenylate cyclase activating polypeptide (PACAP) binding sites in the rat brain. Neurosci Lett. 1991;126:103–106. doi: 10.1016/0304-3940(91)90529-3. [DOI] [PubMed] [Google Scholar]
- Michel S, Itri J, Han JH, Gniotczynski K, Colwell CS. Regulation of glutamatergic signalling by PACAP in the mammalian suprachiasmatic nucleus. BMC Neurosci. 2006;7:15. doi: 10.1186/1471-2202-7-15. [DOI] [PMC free article] [PubMed] [Google Scholar]
- Mikkelsen JD, Hannibal J, Fahrenkrug J, Larsen PJ, Olcese J, McArdle C. Pituitary adenylate cyclase activating peptide-38 (PACAP-38), PACAP-27, and PACAP related peptide (PRP) in the rat median eminence and pituitary. J Neuroendocrinol. 1995;7:47–55. doi: 10.1111/j.1365-2826.1995.tb00666.x. [DOI] [PubMed] [Google Scholar]
- Mikkelsen JD, Hannibal J, Larsen PJ, Fahrenkrug J. Pituitary adenylate cyclase activating peptide (PACAP) mRNA in the rat neocortex. Neurosci Lett. 1994;171:121–124. doi: 10.1016/0304-3940(94)90620-3. [DOI] [PubMed] [Google Scholar]
- Miyata A, Arimura A, Dahl RR, Minamino N, Uehara A, Jiang L, Culler MD, Coy DH. Isolation of a novel 38 residue-hypothalamic polypeptide which stimulates adenylate cyclase in pituitary cells. Biochemical and Biophysical Research Communications. 1989;164:567–574. doi: 10.1016/0006-291x(89)91757-9. [DOI] [PubMed] [Google Scholar]
- Moller K, Zhang YZ, Håkanson R, Luts A, Sjölund B, Uddman R, Sundler F. Pituitary adenylate cyclase activating peptide is a sensory neuropeptide: immunocytochemical and immunochemical evidence. Neuroscience. 1993;57:725–732. doi: 10.1016/0306-4522(93)90018-b. [DOI] [PubMed] [Google Scholar]
- Murase T, Kondo K, Arima H, Iwasaki Y, Ito M, Miura Y, Oiso Y. The expression of pituitary adenylate cyclase-activating polypeptide (PACAP) mRNA in rat brain: possible role of endogenous PACAP in vasopressin release. Neurosci Lett. 1995;185:103–106. doi: 10.1016/0304-3940(94)11235-b. [DOI] [PubMed] [Google Scholar]
- Mustafa T. Pituitary adenylate cyclase-activating polypeptide (PACAP): a master regulator in central and peripheral stress responses. Adv Pharmacol. 2013;68:445–457. doi: 10.1016/B978-0-12-411512-5.00021-X. [DOI] [PubMed] [Google Scholar]
- Nielsen HS, Hannibal J, Fahrenkrug J. Expression of pituitary adenylate cyclase activating polypeptide (PACAP) in the postnatal and adult rat cerebellar cortex. Neuroreport. 1998;9:2639–2642. doi: 10.1097/00001756-199808030-00039. [DOI] [PubMed] [Google Scholar]
- Ohsawa M, Brailoiu GC, Shiraki M, Dun NJ, Paul K, Tseng LF. Modulation of nociceptive transmission by pituitary adenylate cyclase activating polypeptide in the spinal cord of the mouse. Pain. 2002;100:27–34. doi: 10.1016/s0304-3959(02)00207-5. [DOI] [PubMed] [Google Scholar]
- Pettersson LME, Heine T, Verge VMK, Sundler F, Danielsen N. PACAP mRNA is expressed in rat spinal cord neurons. J Comp Neurol. 2004;471:85–96. doi: 10.1002/cne.20015. [DOI] [PubMed] [Google Scholar]
- Piggins HD, Stamp JA, Burns J, Rusak B, Semba K. Distribution of pituitary adenylate cyclase activating polypeptide (PACAP) immunoreactivity in the hypothalamus and extended amygdala of the rat. J Comp Neurol. 1996;376:278–294. doi: 10.1002/(SICI)1096-9861(19961209)376:2<278::AID-CNE9>3.0.CO;2-0. [DOI] [PubMed] [Google Scholar]
- Reglodi D, Kiss P, Lubics A, Tamas A. Review on the protective effects of PACAP in models of neurodegenerative diseases in vitro and in vivo. Curr Pharm Des. 2011;17:962–972. doi: 10.2174/138161211795589355. [DOI] [PubMed] [Google Scholar]
- Rubio-Garrido P, Pérez-de-Manzo F, Porrero C, Galazo MJ, Clascá F. Thalamic input to distal apical dendrites in neocortical layer 1 is massive and highly convergent. Cereb Cortex. 2009;19:2380–2395. doi: 10.1093/cercor/bhn259. [DOI] [PubMed] [Google Scholar]
- Schindelin J, Arganda-Carreras I, Frise E, Kaynig V, Longair M, Pietzsch T, Preibisch S, Rueden C, Saalfeld S, Schmid B, Tinevez J-Y, White DJ, Hartenstein V, Eliceiri K, Tomancak P, Cardona A. Fiji: an open-source platform for biological-image analysis. Nat Meth. 2012;9:676–682. doi: 10.1038/nmeth.2019. [DOI] [PMC free article] [PubMed] [Google Scholar]
- Seaborn T, Masmoudi-Kouli O, Fournier A, Vaudry H, Vaudry D. Protective effects of pituitary adenylate cyclase-activating polypeptide (PACAP) against apoptosis. Curr Pharm Des. 2011;17:204–214. doi: 10.2174/138161211795049679. [DOI] [PubMed] [Google Scholar]
- Shipley MT, Adamek GD. The connections of the mouse olfactory bulb: a study using orthograde and retrograde transport of wheat germ agglutinin conjugated to horseradish peroxidase. Brain Res Bull. 1984;12:669–688. doi: 10.1016/0361-9230(84)90148-5. [DOI] [PubMed] [Google Scholar]
- Skoglösa Y, Takei N, Lindholm D. Distribution of pituitary adenylate cyclase activating polypeptide mRNA in the developing rat brain. Brain Res Mol Brain Res. 1999;65:1–13. doi: 10.1016/s0169-328x(98)00294-0. [DOI] [PubMed] [Google Scholar]
- Stroth N, Holighaus Y, Ait-Ali D, Eiden LE. PACAP: a master regulator of neuroendocrine stress circuits and the cellular stress response. Ann N Y Acad Sci. 2011;1220:49–59. doi: 10.1111/j.1749-6632.2011.05904.x. [DOI] [PMC free article] [PubMed] [Google Scholar]
- Stumm R, Kolodziej A, Prinz V, Endres M, Wu D-F, Höllt V. Pituitary adenylate cyclase-activating polypeptide is up-regulated in cortical pyramidal cells after focal ischemia and protects neurons from mild hypoxic/ischemic damage. J Neurochem. 2007;103:1666–1681. doi: 10.1111/j.1471-4159.2007.04895.x. [DOI] [PubMed] [Google Scholar]
- Tan Y-V, Waschek JA. Targeting VIP and PACAP receptor signalling: new therapeutic strategies in multiple sclerosis. ASN Neuro. 2011:3. doi: 10.1042/AN20110024. [DOI] [PMC free article] [PubMed] [Google Scholar]
- Tubbs RS, Prekupec M, Loukas M, Hattab EM, Cohen-Gadol AA. The indusium griseum: anatomic study with potential application to callosotomy. Neurosurgery. 2013;73:312–5. doi: 10.1227/01.neu.0000430293.39046.59. discussion 316. [DOI] [PubMed] [Google Scholar]
- Vaudry D, Falluel-Morel A, Bourgault S, Basille M, Burel D, Wurtz O, Fournier A, Chow BKC, Hashimoto H, Galas L, Vaudry H. Pituitary Adenylate Cyclase-Activating Polypeptide and Its Receptors: 20 Years after the Discovery. Pharmacological Reviews. 2009;61:283–357. doi: 10.1124/pr.109.001370. [DOI] [PubMed] [Google Scholar]
- Wang C-L, Zhang L, Zhou Y, Zhou J, Yang X-J, Duan S-M, Xiong Z-Q, Ding Y-Q. Activity-dependent development of callosal projections in the somatosensory cortex. J Neurosci. 2007;27:11334–11342. doi: 10.1523/JNEUROSCI.3380-07.2007. [DOI] [PMC free article] [PubMed] [Google Scholar]
- Waschek JA. VIP and PACAP: neuropeptide modulators of CNS inflammation, injury, and repair. Br J Pharmacol. 2013;169:512–523. doi: 10.1111/bph.12181. [DOI] [PMC free article] [PubMed] [Google Scholar]
- Zhang YZ, Hannibal J, Zhao Q, Moller K, Danielsen N, Fahrenkrug J, Sundler F. Pituitary adenylate cyclase activating peptide expression in the rat dorsal root ganglia: up-regulation after peripheral nerve injury. Neuroscience. 1996;74:1099–1110. doi: 10.1016/0306-4522(96)00168-6. [DOI] [PubMed] [Google Scholar]
- Zhou J, Wen Y, She L, Sui Y-N, Liu L, Richards LJ, Poo M-M. Axon position within the corpus callosum determines contralateral cortical projection. Proceedings of the National Academy of Sciences. 2013;110:E2714–23. doi: 10.1073/pnas.1310233110. [DOI] [PMC free article] [PubMed] [Google Scholar]
- Zhou X, Rodriguez WI, Casillas RA, Ma V, Tam J, Hu Z, Lelievre V, Chao A, Waschek JA. Axotomy-induced changes in pituitary adenylate cyclase activating polypeptide (PACAP) and PACAP receptor gene expression in the adult rat facial motor nucleus. J Neurosci Res. 1999;57:953–961. [PubMed] [Google Scholar]