

Abstract
Key points
Evidence indicates an association between hypertension and chronic systemic inflammation in both human hypertension and experimental animal models.
Previous studies in the spontaneously hypertensive rat (SHR) support a role for leukotriene B4 (LTB4), a potent chemoattractant involved in the inflammatory response, but its mode of action is poorly understood.
In the SHR, we observed an increase in T cells and macrophages in the brainstem; in addition, gene expression profiling data showed that LTB4 production, degradation and downstream signalling in the brainstem of the SHR are dynamically regulated during hypertension.
When LTB4 receptor 1 (BLT1) receptors were blocked with CP‐105,696, arterial pressure was reduced in the SHR compared to the normotensive control and this reduction was associated with a significant decrease in systolic blood pressure (BP) indicators.
These data provide new evidence for the role of LTB4 as an important neuro‐immune pathway in the development of hypertension and therefore may serve as a novel therapeutic target for the treatment of neurogenic hypertension.
Abstract
Accumulating evidence indicates an association between hypertension and chronic systemic inflammation in both human hypertension and experimental animal models. Previous studies in the spontaneously hypertensive rat (SHR) support a role for leukotriene B4 (LTB4), a potent chemoattractant involved in the inflammatory response. However, the mechanism for LTB4‐mediated inflammation in hypertension is poorly understood. Here we report in the SHR, increased brainstem infiltration of T cells and macrophages plus gene expression profiling data showing that LTB4 production, degradation and downstream signalling in the brainstem of the SHR are dynamically regulated during hypertension. Chronic blockade of the LTB4 receptor 1 (BLT1) receptor with CP‐105,696, reduced arterial pressure in the SHR compared to the normotensive control and this reduction was associated with a significant decrease in low and high frequency spectra of systolic blood pressure, and an increase in spontaneous baroreceptor reflex gain (sBRG). These data provide new evidence for the role of LTB4 as an important neuro‐immune pathway in the development of hypertension and therefore may serve as a novel therapeutic target for the treatment of neurogenic hypertension.
Key points
Evidence indicates an association between hypertension and chronic systemic inflammation in both human hypertension and experimental animal models.
Previous studies in the spontaneously hypertensive rat (SHR) support a role for leukotriene B4 (LTB4), a potent chemoattractant involved in the inflammatory response, but its mode of action is poorly understood.
In the SHR, we observed an increase in T cells and macrophages in the brainstem; in addition, gene expression profiling data showed that LTB4 production, degradation and downstream signalling in the brainstem of the SHR are dynamically regulated during hypertension.
When LTB4 receptor 1 (BLT1) receptors were blocked with CP‐105,696, arterial pressure was reduced in the SHR compared to the normotensive control and this reduction was associated with a significant decrease in systolic blood pressure (BP) indicators.
These data provide new evidence for the role of LTB4 as an important neuro‐immune pathway in the development of hypertension and therefore may serve as a novel therapeutic target for the treatment of neurogenic hypertension.
Abbreviations
- 5‐LO
5‐lipoxygenase
- BLT1
LTB4 receptor 1
- BP
blood pressure
- LTB4
leukotriene B4
- HF
high frequency
- HR
heart rate
- LF
low frequency
- NTS
nucleus tractus solitarii
- PLA2
cytosolic phospholipase A2
- PVN
paraventricular nucleus
- sBRG
spontaneous baroreceptor reflex gain
- SHR
spontaneously hypertensive rat
Introduction
Hypertension has been linked with chronic inflammation in pre‐clinical (Rodríguez‐Iturbe et al. 2005; Guzik et al. 2007; Harrison et al. 2010; Marvar et al. 2010; Barhoumi et al. 2011; Mattson et al. 2013; Singh et al. 2015) and clinical studies, (Dalekos et al. 1997; Chae et al. 2001; Bautista et al. 2005). However, whether inflammation and sources of inflammation are a cause or consequence is much debated. The spontaneously hypertensive rat (SHR) is known to have an activated inflammatory system (Schmid‐Schonbein et al. 1991; Harwani et al. 2012; Dange, 2015; H.‐B. Li et al. 2015) and we have shown that there is enhanced leukocyte and adhesion molecule accumulation in the brainstem microvasculature (Waki et al. 2007, 2008, 2010; Xu et al. 2012). Leukocytes release cytokines and chemokines that affect neuronal activity (D'Arcangelo et al. 2000; Gosselin & Rivest, 2007; Jun et al. 2012) and have effects on arterial pressure regulation at the level of the nucleus tractus solitarii (NTS) (Takagishi et al. 2010; Gouraud et al. 2011) and the paraventricular nucleus (PVN) (Kang et al. 2009; Colombari et al. 2010; Shi et al. 2010; Sriramula et al. 2013). At present, however, the mechanism for how immune cells infiltrate the brainstem and impact on cardiovascular autonomic control is unknown.
Leukotriene B4 (LTB4) is a metabolic product of arachidonic acid synthesis via the actions of cytosolic phospholipase A2 (PLA2), 5‐lipoxygenase (5‐LO), and LTA4 hydrolase (Yokomizo et al. 2001). LTB4 is been shown to be associated with various cardiovascular disease related pathologies including atherosclerosis (Aiello, 2002), obesity (P. Li et al. 2015), ischaemic stroke (Bevan et al. 2008) and pulmonary hypertension (Tian et al. 2013). In addition, auto‐immune diseases such as multiple sclerosis, (Kihara et al. 2010) rheumatoid arthritis (Alten et al. 2004) and asthma (Busse & Kraft, 2005) have demonstrated LTB4‐dependent pathology. In the SHR, we have previously shown that LTB4 levels are increased in the NTS, a major brainstem region that governs both the sensitivity of the baroreceptor reflex and the set point of arterial pressure and that acute blockade of LTB4 receptors in the NTS lowers blood pressure (Waki et al. 2010, 2013).
LTB4 is a known major inflammatory mediator and potent chemoattractant for leukocytes, enhancing their interaction with endothelial cells (Murray et al. 2003; Yokomizo, 2011). Traditionally, LTB4 is considered to be one of the most potent chemotactic and activating factors for neutrophils (Saiwai et al. 2010). As a chemoattractant for inflammatory cells, LTB4 triggers adherence and aggregation of leukocytes to the endothelium and recruits granulocytes and macrophages to the site of inflammation. LTB4 can also be released by brain microglial cells (Matsuo et al. 1995), which have been shown to be important for the neurogenic component of experimental hypertension. Moreover, LTB4 can also act as a strong chemoattractant for T cells (Goodarzi et al. 2003; Tager & Luster, 2003; Medoff et al. 2005; Lone & Taskén, 2013), which are implicated in the pathogenesis of experimental and human hypertension (Waki et al. 2013; Trott & Harrison, 2014).
The effects of LTB4 are mediated by binding to high‐affinity LTB4 receptors, which are expressed on inflammatory cells such as neutrophils, eosinophils, and macrophages, and more recently have been found on T cells (Tager & Luster, 2003). LTB4 has two receptors, the high affinity BLT1 receptor and the lower affinity BLT2 receptor (Tager & Luster, 2003). BLT1 receptors mediate leukocyte chemotaxis whereas BLT2 receptors mediate neutrophil secretion (Showell et al. 1996). These are both G‐protein coupled receptors. Here, we have focused on BLT1 receptors because of their higher affinity for LTB4 and association with inflammatory diseases. BLT1 receptors are expressed primarily by neutrophils and vascular smooth muscle cells (Back et al. 2005), but have also been found on endothelial cells (Qiu et al. 2006), dorsal root ganglion (Andoh & Kuraishi, 2005) and, most recently, in the NTS (E. Hendy, H. Waki & J. F. R. Paton, unpublished observations). Thus, antagonizing BLT1 receptors would be expected to reduce the pro‐inflammatory effects of LTB4. Moreover, in preclinical disease models, LTB4 receptor antagonists have been shown to inhibit the recruitment of immune cells to sites of inflammation (Aiello, 2002; Medoff et al. 2005; Spite et al. 2011; Tian et al. 2013) and BLT1 antagonists are continuing to be evaluated in clinical studies for the treatment of inflammatory diseases (Díaz‐González et al. 2007). Therefore, the primary aim of the current study was to determine whether chronic systemic inhibition of BLT1 receptors reduces blood pressure and restores autonomic balance in the SHR.
Methods
Procedures were carried out according to the UK Home Office guidelines on animals (Scientific Procedures) Act 1986 and approved by the University of Bristol's Animal Ethics Committee. The Thomas Jefferson University Institutional Animal Care and Use Committee approved procedures for studies conducted at Thomas Jefferson University.
Procedures for real‐time PCR
Methods previously used for sample acquisition were followed (DeCicco et al. 2015). Briefly, male, Wistar Kyoto (WKY/NHsd) rats and spontaneous hypertensive rats (SHR/NHsd) obtained from Harlan Laboratories were housed one per cage in the Thomas Jefferson University (TJU) animal facility. Facilities were maintained at constant temperature and humidity with 12–12 h light–dark cycles. The three time points of interest, prehypertension, hypertension onset, and chronic hypertension, correspond to rat ages 6–7 weeks, 10–12 weeks and 16 weeks, respectively. At each time point rats were killed and brainstems were removed and sectioned into 275 μm transverse sections. Bilateral microdissected punches of the NTS from one animal were combined into a single sample. Total RNA was extracted with the miRNeasy extraction kit (Qiagen, Valencia, CA, USA). A standard BioMark protocol was used to pre‐amplify cDNA samples for 12 cycles using TaqMan PreAmp Master Mix per the manufacturer's protocol (Applied Biosystems, Foster City, CA, USA). qPCR reactions were performed using a 48.48 BioMark Dynamic Array (Fluidigm, South San Francisco, CA, USA) enabling quantitative measurement of multiple genes with assay replicates and samples under identical reaction conditions. Each mRNA level was measured in multiple reaction chambers on a single BioMark array (n = 6 or 7 technical replicates). The PCR was performed for 30 cycles (15 s at 95°C, 5 s at 70°C, 60 s at 60°C). The primers are listed in Table 1. C t values were calculated using the Real‐Time PCR Analysis Software (Fluidigm). Software‐designated failed reactions, as well as reactions with melt curves not at the appropriate temperature, were discarded from subsequent analysis.
Table 1.
Mean basal cardiovascular and autonomic values for all groups
| SHR + CP105,696 | SHR + vehicle | WKY + CP105,696 | ||||
|---|---|---|---|---|---|---|
| Variable | Light phase | Dark phase | Light phase | Dark phase | Light phase | Dark phase |
| SBP (mmHg) | 181 ± 2 | 187 ± 2 | 183 ± 2 | 191 ± 2 | 120 ± 2 | 123 ± 2 |
| MBP (mmHg) | 143 ± 1 | 148 ± 2 | 143 ± 2 | 149 ± 2 | 93 ± 1 | 97 ± 1 |
| DBP (mmHg) | 125 ± 1 | 129 ± 2 | 124 ± 2 | 129 ± 2 | 80 ± 2 | 83 ± 2 |
| HR (beats min−1) | 296 ± 2 | 339 ± 5 | 290 ± 5 | 330 ± 3 | 304 ± 5 | 352 ± 6 |
| Respiratory frequency (breaths min−1) | 67 ± 1.5 | 74 ± 2.1 | 60 ± 1.4 | 70 ± 1.5 | 90 ± 1.1 | 98 ± 1.7 |
| sBRG (ms mmHg−1) | 0.8 ± 0.04 | 0.7 ± 0.02 | 0.8 ± 0.04 | 0.6 ± 0.03 | 1.2 ± 0.05 | 0.9 ± 0.04 |
| HF(PI) (ms2) | 19.6 ± 1.1 | 18.9 ± 0.6 | 17.6 ± 0.5 | 17.9 ± 0.5 | 17 ± 0.7 | 16 ± 0.9 |
| LF/HF | 0.6 ± 0.01 | 0.7 ± 0.02 | 0.6 ± 0.02 | 0.7 ± 0.02 | 0.6 ± 0.01 | 0.6 ± 0.01 |
| LF(SBP) (mmHg Hz−2) | 3.1 ± 0.1 | 3.9 ± 0.1 | 3.0 ± 0.2 | 3.6 ± 0.1 | 2.7 ± 0.1 | 3.1 ± 0.1 |
| VLF(SBP) (mmHg Hz−2) | 6.4 ± 0.1 | 7.1 ± 0.2 | 6.7 ± 0.2 | 7.3 ± 0.2 | 6.0 ± 0.2 | 6.4 ± 0.3 |
| HF(SBP) (mmHg Hz−2) | 5.0 ± 0.2 | 5.6 ± 0.1 | 5.2 ± 0.2 | 5.7 ± 0.1 | 4.7 ± 0.2 | 5.0 ± 0.2 |
Real‐time PCR data analysis
The gene expression data was normalized relative to the expression of Eif4e within sample as a reference (ΔC t). The reference‐normalized data were analysed using a two‐way ANOVA considering strain and stage as two independent factors (Strain: SHR and WKY; Stage: prehypertension, onset and chronic hypertension). For visualization, the reference‐normalized gene expression data were further normalized to the WKY data at the onset time point (ΔΔC t).
Flow cytometric analysis of circulating immune cells
Circulating inflammatory cells were analysed using flow cytometry as previously described (Marvar et al. 2010; Marvar & Harrison, 2012; McBryde et al. 2013). Antibodies (BD Biosciences) used for staining were as follows: FITC anti‐CD45 (30‐F11); APC anti‐CD4 (GK1.5); PerCP anti‐CD8 (53–6.7) and APC anti‐CD3e (145‐2C11) and eflour‐660 anti‐CD11b/c. All antibodies were diluted (1.5 μl (100 μl)−1) in FACS buffer (0.5 % bovine serum albumin in PBS). After immunostaining, cells were resuspended in FACS buffer and analysed immediately on a LSR‐II flow cytometer with DIVA software (Becton Dickinson). Data were analysed with FlowJo software (Tree Star, Inc.). All samples were normalized to 1 × 10⁶ cells and the percentage of the total events collected out of the 1 × 10⁶ cells was analysed.
Flow cytometric analysis of tissue‐infiltrating immune cells
FACS analysis of T cells in brainstem homogenates was performed as previously described (McBryde et al. 2009). To analyse leukocytes in the brainstem, tissue was digested using collagenase type IX (125 U ml−1); collagenase type IS (450 U ml−1) and hyaluronidase IS (60 U ml−1) dissolved in 20 mm Hepes–PBS buffer for 30 min at 37°C, while constantly agitated. The dissolved tissue was then passed through a 70 m sterile filter (Falcon, BD), yielding a single cell suspension. An additional step was applied for brain tissue using a 30%/70% Percoll gradient to separate out the mononuclear cell layer. Cells were then washed twice with FACS buffer then counted. 1 × 10⁶ cells were stained and analysed using multicolour flow cytometry. Antibodies (BD Biosciences) were then used for staining as described above. After immunostaining, cells were re‐suspended in FACS buffer and analysed immediately on a LSR‐II flow cytometer with DIVA software (Becton Dickinson). Data were analysed with FlowJo software (Tree Star Inc., Ashland, OR, USA) and an initial gate was applied to exclude cell debris from analysis and CD45 positive cells were identified as leukocytes within the tissue cell suspension and T cells were identified with anti‐CD3 antibodies and the HIS36 monoclonal antibody, which reacts with a molecule expressed on the surface of rat macrophages.
Drug administration
CP‐105,696 a specific high affinity antagonist for BLT1 receptors in rat (Souza et al. 2000) was kindly provided by Pfizer Inc. (Groton, CT, USA). Previous studies have shown that CP‐105,696 reduced inflammation, vascular permeability, neutrophil and monocyte accumulation in the rat (Souza et al. 2000; Aiello, 2002). Based on pilot studies, we determined an effective dose of CP‐105,696 of 74 mg kg−1 day−1, which is comparable to a previous study where up to 100 mg kg−1 day−1 was used in mice to reduce atherosclerotic disease (Aiello, 2002). CP‐105,696 was prepared in dimethyl sulfoxide (DMSO) with a final concentration of 0.8% and well below concentrations used in other studies (15–20 %) where no changes in cardiovascular variables were reported (Pĭtre et al. 1999; Sampey et al. 1999). CP‐105,696 was administered in the drinking water over a 21 day period. Vehicle control consisted of 0.8% DMSO in the drinking water. Subgroups of rats were treated with CP‐105,696 for a shorter period (5 days) for evaluation of effects on acute changes in circulating leukocytes and related surface expression markers. However, we excluded the inclusion of a Wistar‐vehicle group from analysis because we saw no change in blood pressure in the Wistar‐CP‐105,696 group. Blood pressure was our primary endpoint and therefore we did not consider additional interrogation of these variables.
Radio‐telemetry recordings
All animals (24–26 weeks of age) were housed individually, allowed normal rat chow and drinking water ad libitum, and kept on a 12–12 h light–dark cycle. Age‐matched male SHR and Wistar rats (24–26 weeks old) were allowed to adapt for 1 week (standard laboratory rat chow with water ad libitum) before implantation of a radio‐telemetry device for recording of arterial pressure (Data Sciences International, Arden Hills, MN, USA) as previously described (Waki et al. 2007). The blood pressure of each rat was recorded for a 3‐day baseline period prior to CP‐105,696 administration. CP‐105,696, or vehicle control (0.8 % DMSO was given in the drinking water for 21 days. The three groups of rats were studied: (i) SHR + CP‐105,696 (ii) SHR + vehicle; (iii) Wistar rats + CP‐105,696. Telemetry data were acquired and both the spectra of systolic blood pressure and inert‐pulse interval and spontaneous cardiac baroreceptor reflex gain (sBRG) analysed using Hey‐Presto software as previously described (Waki et al. 2006). Arterial blood pressure was recorded for a minute interval every hour for 24 h during the entire experimental period; 24 h, plus separate light (12 h) and dark phase (12 h) telemetry data were analysed.
Autonomic and cardiovascular function analysis
Our analysis program contained a fast Fourier transform (FFT) function for power spectral analysis of inert‐pulse interval (PI) and BP variability and a function for spontaneous baroreflex gain (sBRG) based on a time‐series technique (Waki et al. 2006). The magnitude of power was integrated in the very low‐frequency (VLF) band (0–0.27 Hz), the low‐frequency (LF) band (0.27–0.75 Hz) and the high‐frequency (HF) band (0.75–‐3.3 Hz). Cardiovascular data including systolic blood pressure and heart rate (HR) were expressed either as a change from baseline or peak change, which was defined as the peak change value from baseline.
Statistical analysis
Statistical analysis was performed using Graphpad Prism v4.02. Data are expressed as means ± SEM and values of P < 0.05 were considered statistically significant. Statistical tests were performed using two‐way ANOVA with repeated measures and Bonferroni post hoc test. Significance of the peak difference in systolic blood pressure between groups, as well as flow cytometry analysis, was determined by Students unpaired two‐tailed t test. Two‐factor ANOVA was used for qPCR statistical analysis. For qPCR analysis, significance of gene expression differences between SHR and WKY at each time point was evaluated by a Tukey's post hoc honest significant difference approach using aov and Tukey HSD functions in the core statistical package of the R platform (DeCicco et al. 2015; R Core Team, 2015).
Results
Leukotriene B4‐associated gene expression levels in the nucleus tractus solitarii (NTS) during hypertension development in the SHR
The expression levels of six genes involved in synthesis and metabolism of LTB4, as well as two LTB4 receptors, were evaluated at different phases of hypertension development (Fig. 1 A). As shown in Fig. 1 B, at the onset and chronic phase of hypertension, two genes involved in the upstream steps of LTB4 production, arachidonate 5‐lipoxygenase (Alox5) and arachidonate 5‐lipoxygenase‐activating protein (Alox5ap) showed a trend towards higher mRNA transcript levels in SHR compared to WKY rats. However, this failed to achieve statistical significance. In addition, leukotriene A4 hydrolase (Lta4h), which is responsible for the conversion of LTA4 into LTB4, showed a trend towards a reduction at the onset and chronic phases compared to the WKY rats (Fig. 1 C). The expression levels of prostaglandin reductase 1 (Ptgr1) enzyme, which is responsible for the degradation of LTB4, was significantly reduced at the onset stage of hypertension and a significant overall strain difference across all three time points was determined by two‐way ANOVA (Fig. 1 C). Finally, there were no statistical differences in expression of leukotriene B4 receptors 1 and 2 (Ltb4r and Ltb4r2, respectively) over time (Fig. 1 D).
Figure 1. Dynamic changes in expression of LTB4 related genes over time during the development of hypertension .

A, summary of genes measured as they relate to arachidonic acid metabolism. Evaluation of six genes affecting LTB4 production (B and C, left panel), degradation (C, right panel) and signalling receptors (D) with reference to housekeeping gene Eif4e and WKY onset time point. * P < 0.05, #strain difference significant, two‐factor ANOVA, Tukey's post hoc, P < 0.05. Of note for strain significant difference: AloxAP, P value = 0.076; Lta4h, P value = 0.077. Und, undetermined expression, n = 3–4 per gene.
Enhanced immune cell infiltrates in the brainstem of the SHR and increased surface expression of BLTR1 on circulating lymphocytes
Prior evidence supports a pro‐inflammatory phenotype in the SHR, in particular excessive inflammation of the brainstem, and evidence suggests that LTB4 may contribute to the hypertensive phenotype (Waki et al. 2013). Moreover, the adaptive immune response has been shown to play a significant role in other models of experimental hypertension (Trott & Harrison, 2014). We therefore assessed brainstem infiltrates of adaptive (CD3+) and innate immune cells (macrophages) in the SHR and Wistar rats. As shown in Fig. 2 B–E, the percentage of CD3+ cells (t 22 = 4.6, P < 0.01) and macrophages (t 22 = 3.1, P < 0.01) in the brainstem of the SHR are significantly greater than Wistar rats. Because BLT1 receptors are present on some lymphocytes, these cells may be a major target for LTB4 and our previous evidence demonstrates that within the NTS there are increased CD4+ cells in the SHR (Waki et al. 2007; Xu et al. 2012).
Figure 2. Increased lymphocyte brainstem infiltrates and increased expression circulating CD4+BLTR1 cells in the SHR .

A, Gating Strategy for FACS Analysis B, percentage total CD45+ macrophages (HIS36) in the brainstem of SHR and Wistar rats C, representative flow cytometry cell scatter plot D, percentage total infiltrating CD45+CD3+ in the brainstem of SHR and Wistar E, representative flow cytometry cell scatter plot F, increased percentage of circulating lymphocytes expressing the LTB4 receptor BLTR1 G, and corresponding representative flow cytometry cell scatter plot.
We next evaluated the surface expression levels of BLTR1 on circulating CD4+ lymphocytes. As shown in Fig. 2 F–G, the hypertensive group had a significantly greater percentage of CD4+ cells expressing the BLTR1. These data provide further evidence that increased brainstem inflammatory cells and BLTR1 expressing lymphocytes may contribute to the brainstem inflammatory phenotype in the SHR and associated autonomic dysfunction. Therefore, we next evaluated the in vivo anti‐inflammatory effects of systemic blockade of the LTB4 receptor BLT1.
BLT1 receptor antagonism (CP‐105‐696) reduces increased circulating levels of CD11b+ cells in the SHR
Through binding of the BLT1 receptor, LTB4 can induce the expression of adhesion molecules such as CD11b+ on polymorphonuclear leukocytes that can contribute to leukocyte adherence to endothelial cells. LTB4 can exert these effects primarily in neutrophils but also on T lymphocytes and macrophages, which ultimately promote accumulation of these cells at sites of inflammation, such as the brainstem. Previous studies have shown that the BLT1 receptor antagonist CP‐105,696 inhibits the LTB4‐mediated upregulation of CD11b+ on neutrophils and monocytes (Aiello, 2002). In additional groups of rats, we therefore examined the short‐term effects of CP‐105,696 on monocyte CD11b+ cell surface expression as well as the tissue homing marker CD44+ (Salmi et al. 2013) to determine whether the dose we administered was effective in reducing LTB4‐mediated immune affects. As shown in Fig. 3 A, following 5 days of CP‐105,696 treatment, the percentage of CD11b+ cells in both SHR and Wistar was significantly reduced in addition to the expression levels of the tissue homing marker CD44+ (Fig. 3 C). Notably, CP‐105,696 did not affect other peripheral blood leukocyte populations including CD4+ and CD8+ populations of T cells, suggesting that this treatment was specific to monocytes (data not shown). Moreover, at baseline, CD11b+ expressing leukocytes were significantly greater in the SHR compared to Wistar controls (Fig. 3 A and B), which may contribute to the dysregulation of the LTB4 system in the SHR. Therefore, we next sought to determine whether systemic blockade of the LTB4 receptor‐BLT1 axis improves blood pressure and autonomic function in the SHR.
Figure 3. Increased circulating levels of CD11b+ cells in the SHR are reduced with CP‐105,696 .
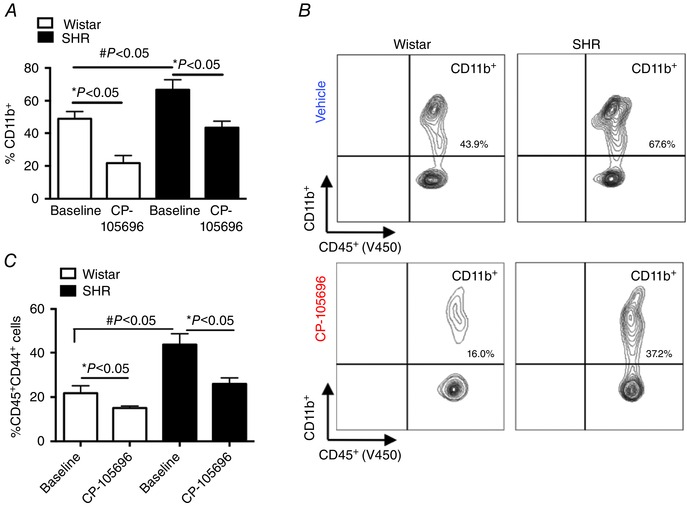
Percentage total circulating CD11b+ cells in SHR and Wistar groups at baseline and following 5 days of CP‐105,696 (A), representative flow cytometry contour plot showing reduced circulating CD11b+ following CP‐105,696 (B), percentage total circulating CD44+ leukocytes before and after CP‐105‐696 (C) in SHR and Wistar groups; n = 5–6 per group; Data are presented as means ± SEM, * P < 0.05, # P < 0.05, baseline Wistar vs. baseline SHR.
BLT1 receptor antagonism with CP‐105,696 reduces blood pressure and heart rate in the SHR
Baseline cardiovascular, autonomic and respiratory measures in all animals prior to receiving CP‐105,696 are described in Table 1. The temporal profiles for average change in systolic blood (SBP) pressure and heart rate (HR) over the treatment period are shown in Fig. 4 A and C. In rats receiving CP‐105,696, there was a significant 24‐h mean decrease in change in SBP and HR starting on day 8 and this was well maintained until the end of the study (21 days). A significant peak reduction in HR from 296 ± 2 to 269 ± 9 beats min− was observed on day 19 (Fig. 4 C). Peak delta responses in HR for all groups are shown in Fig. 4 B and D. The blood pressure and heart rate effects of CP‐105,696 were greatest during the light phase, and therefore this was the focus of our autonomic activity analysis (see below). There were no sustained changes in SBP or HR in SHR‐vehicle and Wistar‐CP‐105,696 rat groups.
Figure 4. Chronic administration of CP‐105,696 reduces blood pressure and heart rate in the SHR .

Decreased change in systolic blood pressure (SBP) and heart rate from baseline in the SHR‐CP‐105,696 group with no change in SHR vehicle and Wistar CP‐105,696 and vehicle (A and C). Peak change in SBP and heart rate in SBP SHR‐CP‐105,696 (n = 5), SHR‐vehicle (n = 5) and WKY‐CP‐105,696 (n = 5) groups are shown in panels B and D. n = 5–6 per group; Data are presented as means ± SEM, * P < 0.05 overall main effect; post hoc analysis # P < 0.05 SHR‐vehicle vs. SHR‐CP‐105,696.
Improved autonomic function in the SHR following BLT1 receptor antagonism with CP‐105696
To determine the effects of CP‐105,696 on autonomic function in the SHR, we next analysed the spectra of SBP and inter‐pulse interval and spontaneous cardiac baroreceptor reflex gain (sBRG). As shown in Fig. 5 A, the temporal profile in, sBRG(PI) in the SHR‐CP105,696 group increased in the light phase from day 3 and remained significantly higher throughout the drug administration period (from 0.8 ± 0.04 to 1.1 ± 0.1 ms mmHg−1). Peak response in sBRG(PI) is shown in Fig. 5 B. There was no change in the dark phase or in SHR‐vehicle and Wistar‐CP‐105,696 rat groups for either light or dark phases (Table 1).
Figure 5. Improved autonomic function in the SHR following BLT1 receptor antagonism with CP‐105696 .
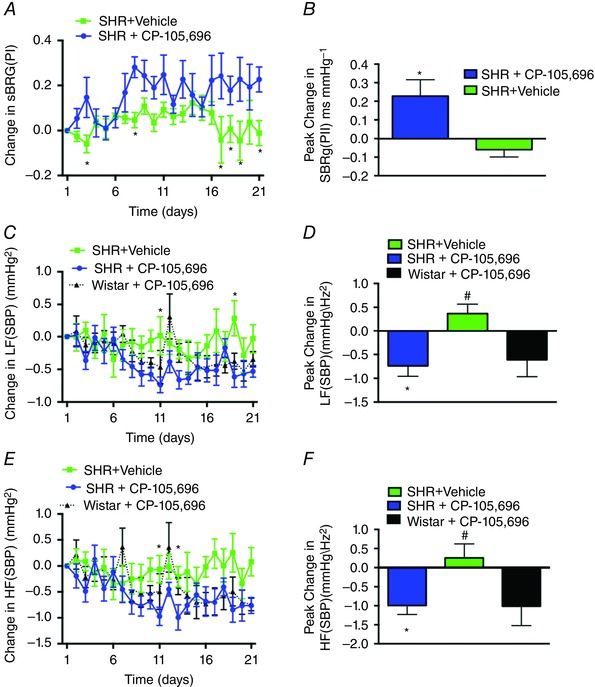
Increased change in spontaneous baroreceptor gain (sBRG) in the light phase of SHR‐CP‐105,696 vs. SHR‐vehicle groups (A), and peak changes in sBRG between groups (B), Decreased LF(SBP) and HF(SBP) in the light phase of the SHR‐CP‐105,696 and Wistar‐CP‐105,696 and ‐vehicle groups (C and E), and peak changes in LF(SBP) and HF(SBP) (D and F). n = 5–6 per group; Data are presented as means ± SEM, * P < 0.05; Wistar vs. SHR‐vehicle.
As shown in the temporal profile in Fig. 5 C, the low and high frequency (HF/LF) SBP was significantly reduced in the SHRs receiving CP‐105,696 from day 11 onwards. This timing coincided with the fall in systolic blood pressure (Fig. 4 A). The decrease in LF SBP was intermittent in both the light and dark phases, while the SHR‐vehicle showed no persistent changes (Fig. 5 C). The peak reduction in LF SBP is represented in Fig. 5 D.
A significant reduction in HF SBP was observed in the SHRs that received CP‐105,696. In the light phase, this persisted from day 11 to the end of the experiment (from 5.0 ± 0.2 mmHg Hz−½ to 4.0 ± 0.2 mmHg Hz−½; Fig. 5 E) and a similar reduction in HF (SBP) was observed in the dark phase (from 5.6 ± 0.1 mmHg Hz−½ to 4.7 ± 0.1 mmHg Hz−½; P < 0.01). The peak changes are represented in Fig. 5 F. However, in the Wistar‐CP‐105,696 group, HF(SBP) decreased in the light phase, but not dark phase, becoming significantly lower than baseline from days 14–21 (from 4.7 ± 0.2 mmHg Hz−½ to 3.7 ± 0.2 mmHg Hz−½; P < 0.01). Moreover, consistent with the SHR‐CP‐105,696 exhibiting a prolonged reduction of HF (SBP), a persistent change in respiratory rate was observed in SHR‐CP‐105,696 group during the light phase (from 67 ± 1.5 to 54 ± 0.7 breaths min−1; data not shown).
Discussion
For the first time we have shown that mRNA expression levels of enzymes responsible for the production, degradation and downstream signalling of LTB4 demonstrates that some enzymes maybe dynamically regulated over the course of the development of hypertension in the SHR. Moreover, compared to normotensive controls, the SHR exhibits enhanced levels of infiltrating macrophages and T lymphocytes in brainstem homogenates and increased circulating BLTR1 expressing lymphocytes. Importantly, chronic treatment with the BLT1 receptor antagonist CP‐105,696 improved cardiovascular and autonomic measures in the SHR and reduced circulating inflammatory‐like cells. Overall these data support our previous findings (Waki et al. 2011, 2013) and provide new genomic and in vivo physiological evidence for the involvement of the LTB4–BLT1 axis as an important neuro‐immune pathway in the development and maintenance of hypertension.
LTB4 has been previously shown to be elevated in the NTS in both young (age 3 weeks) and adult (aged 15 weeks) SHRs (Waki et al. 2013). To further understand the dynamic changes in the metabolic production of LTB4 from arachidonic acid, we evaluated the expression of the transcripts of key synthesis and degradation enzymes responsible for its production across stages of hypertension development in the SHR. The three time points of interest: prehypertension, hypertension onset, and chronic hypertension, correspond to rat ages 6–7 weeks, 10–12 weeks and 16 weeks of age, respectively. The trend in Alox5 and Alox5ap levels suggests an increase in production of LTA4 in the first step of production of LTA4 from 5‐HETEs in the SHR. Typically, LTA4 and 5‐HETEs exist in much higher amounts than LTB4 (Jakschik & Kuo, 1983). Our data demonstrate a trend for LKHA4 (Lta4h), the enzyme that converts LTA4 into LTB4 to be lower in SHR both at the hypertension onset and chronic hypertension stages. LKHA4 has been shown to be the rate‐limiting enzyme in the production of LTB4 (Jakschik & Kuo, 1983). Interestingly, in both SHR and WKY at the prehypertension age the Lta4h levels were not significantly different even though SHR showed marginally lower levels than in WKY. We note that the mRNA expression levels may not be fully indicative of the enzymatic activity of LKHA4 as there are additional posttranscriptional regulators of this pathway. For example, LKHA4 enzymatic activity is known to be inactivated by excess incubation with arachidonic acid and peroxy fatty acids (Jakschik & Kuo, 1983). It has previously been shown that oxidative stress precedes peroxy fatty acid formation in SHRs (Purushothaman et al. 2011) and that oxidative stress is increased in the NTS of SHRs (Nozoe et al. 2007).
LTB4 degradation is controlled primarily through LTB4‐12‐HD/PTGR1 (Jakschik & Kuo, 1983; Vitturi et al. 2013). As shown in Fig. 1 C, Ptgr1 expression is lower in SHR at the onset stages compared to WKY rats. This would suggest that the increase in LTB4 levels previously described by Waki et al. (2013) is primarily due to low levels of its negative regulator, Ptgr1. It is also interesting to note that in the WKY rat at the hypertension onset and chronic hypertension stage, there is a trend for mRNA levels to be increased compared to SHR. Although speculative, this may suggest that WKY rats can metabolize LTB4 better than SHRs, thus reducing their inflammatory state to maintain a normotensive state. Finally, despite the trend towards a lower transcript expression levels, there were no statistical differences in the LTB4 receptors, BLTR1 and BLTR2. However, we acknowledge the limitation of qPCR analysis for our study, as relative expression does not necessarily predict changed activity of an enzyme. Future enzymatic assay studies are now required to more definitively determine dynamic changes in LTB4 enzyme activity over the course of hypertension. We speculate that, in conjunction with the previously reported increase in LTB4 in NTS (Waki et al. 2013), a desensitization effect maybe occurring at the LTB4 receptor in the NTS. Desensitization upon excess agonist exposure has been shown in many G‐protein‐coupled receptors, and specifically in the case of BLT1 (Gaudreau et al. 2002; Chen et al. 2004). LTB4 primarily exerts its inflammatory effects by interacting with its high‐affinity receptor BLT1 receptor that is predominantly expressed on immune cells, including neutrophils, macrophages and effector T cells. (Goodarzi et al. 2003; Tager & Luster, 2003).
Our previous immunocytochemistry evidence demonstrated increased CD4+ T cells within the NTS that may be accumulating due to the chemotactic actions of LTB4 (Waki et al. 2007; Xu et al. 2012). CD4+ T cells may serve as an important immune cell type for the enhanced LTB4 activity in the SHR. In support of these data, and in further quantifying brainstem immune infiltrates, our new data herein indicate that the SHR exhibits enhanced total CD3+ T cells and macrophages; both these cell types are involved in the LTB4 chemotactic inflammatory response. Moreover, we have shown that the SHR has an increased percentage of CD4+ cells expressing BLT1 receptor. Thus, a possibility is that hypertension promotes the expression of BLT1 receptor on T cells which leads to increased LTB4–T cell‐mediated inflammation in the brainstem. The mechanisms for this are unknown but highlight the complexity and specificity of the inflammatory state of the SHR (Waki et al. 2008; DeCicco et al. 2015). Despite these data, further immune cell phenotype analysis is required to determine the LTB4‐mediated immune cell interactions and associated inflammatory signals and adhesion molecules in tissue inflammation. In particular, additional investigation of BLTRs on subsets of T cells, such as CD8+ cells and their potential role in antigen presentation in hypertension needs further investigation.
We have previously shown that a localized injection of LTB4 in the NTS evoked a pressor response and that BLT1 receptor antagonism within the NTS significantly lowers blood pressure as well as LF and VLF spectra of systolic blood pressure and these effects persisted for 6 days (Waki et al. 2013). These data suggest a causal relationship for the LTB4–BLT1 pathway within the NTS in modulating cardiovascular autonomic control. However, the peripheral effects of LTB4 were not examined in this study. LTB4 is a potent chemoattractant for circulating neutrophils (Canetti et al. 2003; Grespan et al. 2008) and these cells can also synthesize and secrete LTB4, which plays an important role in their proliferative and migratory capacity (Afonso et al. 2012). Previous studies have shown that the BLT1 receptor antagonist CP‐105,696 inhibits the LTB4‐mediated upregulation of CD11b+ on neutrophils and monocytes (Aiello, 2002). Similarly, here we demonstrate that in the presence of the BLT1 antagonist (CP‐105,696), CD11b+ expression on leukocytes is significantly reduced. These data support the findings from Aiello et al. (2002), who demonstrated that CP‐105,696 decreased CD11b+ expression in ApoE−/− mice and subsequently reduced atherosclerotic lesions. Moreover, CP‐105,696‐treated rats had a significant reduction in the tissue homing marker CD44+ cells expressed on leukocytes (Salmi et al. 2013). Therefore, we next sought to evaluate the effects of systemic treatment of CP‐105,696 on autonomic and cardiovascular indices in the SHR.
Following CP‐105,696 administration there was a significant reduction in 24 h mean arterial pressure in the SHR compared to the normotensive Wistar rat. However, reductions in blood pressure and autonomic measures were greatest during the light phase, which suggests that CP‐105,696 affected the modulation of the diurnal rhythm. Moreover, reductions in blood pressure in the SHR treated with CP‐105696 coincided with significant reductions in the LF and HF power of SBP in both light and dark phases. Mechanistically, these data are suggestive of a possible decline in vasomotor sympathetic activity occurring at the time when blood pressure became reduced. Interestingly, the reduction in HF(SBP) was most pronounced and indicates a reduction in either the mechanical effect of respiration on SBP, which may be associated with the reduction in respiration rate seen in the SHR‐CP‐105,696 group, or reduced respiratory modulation of sympathetic activity, which significantly contributes to vasomotor tone in the SHR (Simms et al. 2009; Moraes et al. 2014; Briant et al. 2015). Notably, the timing of this fall in arterial pressure also coincided with the effects of CP‐105,696 on reducing the levels of circulating CD11b+ expression after 5 days. Given these neuro‐immune effects of CP‐105,696, it is also possible that this drug maybe affecting the bone marrow, which has been recently implicated in the development of neurogenic hypertension (Zubcevic et al. 2011; Jun et al. 2012). Overall, these data support the hypothesis that CP‐105,696 is anti‐hypertensive and this effect is mediated, in part, by the autonomic nervous system.
From these data it is unclear whether the effects are due to changes in peripheral afferent sensory mechanisms that control arterial pressure, or are an effect on the brain and central control or at the level of the target organ per se or a combination of different sites. However, given that the depressor response was associated with reductions in LF(SBP) and increase in cardiac baroreceptor reflex gain it appears that part of the hypotensive response was mediated by an action on cardiovascular autonomic activity. Moreover, based on its structure (CP‐105,696 or (+)‐1‐(3S,4R)‐[3‐(4‐phenylbenzyl)‐4‐hydroxy‐chroman‐7‐yl] cyclopropane carboxylic acid), we cannot rule out CNS penetrance and the effects we have seen on the autonomic nervous support this contention. Therefore, we proposed that the build‐up of adhered leukocytes in small microvessels of the brainstem may obstruct blood flow and cause focal ischaemia, providing a driver for enhanced sympathetic nerve activity (Paton & Waki, 2009); whether these are cleared by CP‐105,696 remains an open question.
Alternatively, cytokines being released by the adhered and activated leukocytes can result in increased neuronal stimulation, acting as neurotransmitters within the brain.(Rostène et al. 2007) Interestingly, LTB4 has been associated with increased pro‐inflammatory cytokine release, namely IL‐6 and IL‐1ß, and positively correlated with blood pressure in man (Dalekos et al. 1997; Chae et al. 2001; Taniyama & Griendling, 2003; Bautista et al. 2005; Kim & Vaziri, 2005; Peterson et al. 2006). NF‐κB, a transcription factor involved in the upregulation of several genes including chemokines and cytokines is responsive to both LTB4, (Brach et al. 1992; Huang et al. 2004; Serezani et al. 2011), angiotensin II (Hardy et al. 2001; Virdis & Schiffrin, 2003) and reactive oxygen species (ROS) (Elks et al. 2009). Moreover, LTB4 can stimulate the release of IL‐6 (Brach et al. 1992) and MCP‐1 (Huang et al. 2004) via the NF‐κB pathway and BLT1 receptor expression has been shown to be upregulated in response to IL‐1ß (Bäck et al. 2005), thus indicating a positive feedback loop. Chronic pharmacological inhibition of the NF‐κB pathway in young SHRs prevented the onset of hypertension and blunted renal inflammation (Rodríguez‐Iturbe et al. 2005). Whether the hypotensive effect of antagonizing the BLT1 receptors in the present study is due to reduced NF‐κB activity or other pro‐inflammatory cytokine‐mediated events remains to be determined. It is also interesting to speculate that dysregulation of the LTB4 system in the SHR could contribute to excessive isoketal (F2–isoprostane pathway intermediates) formation, which plays a role in mediating the inflammatory response in experimental and human hypertension (Kirabo et al. 2014).
In summary, these data demonstrate that at the level of gene expression within the NTS, the metabolic regulation of LTB4 changes dynamically during the development of hypertension and systemic BLT1 receptor inhibition effectively reduces blood pressure which includes a central action on autonomic activity. Overall, these data provide new evidence for the role of LTB4 as an important neuro‐immune pathway in the development and maintenance of hypertension and therefore may serve as an important biomarker and therapeutic target for the treatment of neurogenic hypertension.
Additional information
Competing interests
None declared.
Author contributions
All authors have approved the final version of the manuscript and agree to be accountable for all aspects of the work. All persons designated as authors qualify for authorship, and all those who qualify for authorship are listed. JFRP, EBH, HW, PJM contributed to the conception and design of the work, DD, RV, JSS, TDC, DW, PJM, EBH ‐ acquisition, analysis and DM ‐interpretation of data for the work and drafting the work.
Funding
The study was financially supported by the British Heart Foundation (RG/12/6/29670), National Institutes of Health (R01 NS069220‐01A1), British Heart Foundation (RG/11/28714) and European Commission Research Executive Agency Marie Curie International Incoming Fellowship (P.J.M) (MC‐IIF – 276147); NIH R00 HL107675‐03 (P.J.M); American Heart Association 15CSA24340001 (P.J.M).
Acknowledgements
J.F.R.P. received a Royal Society Wolfson Research Merit Award and is funded by the British Heart Foundation.
P. J. Marvar and E. B. Hendy contributed equally to this work and this is a joint first authorship paper.
This is an Editor's Choice article from the 15 October 2016 issue.
References
- Afonso PV, Janka‐Junttila M, Lee YJ, McCann CP, Oliver CM, Aamer KA, Losert W, Cicerone MT & Parent CA (2012). LTB4 is a signal‐relay molecule during neutrophil chemotaxis. Dev Cell 22, 1079–1091. [DOI] [PMC free article] [PubMed] [Google Scholar]
- Andoh T & Kuraishi Y (2005). Expression of BLT1 leukotriene B4 receptor on the dorsal root ganglion neurons in mice. Brain Res Mol Brain Res 137, 263–266. [DOI] [PubMed] [Google Scholar]
- Aiello RJ (2002). Leukotriene B4 receptor antagonism reduces monocytic foam cells in mice. Arterioscle Thromb Vasc Biol 22, 443–449. [DOI] [PubMed] [Google Scholar]
- Alten R, Gromnica‐Ihle E, Pohl C, Emmerich J, Steffgen J, Roscher R, Sigmund R, Schmolke B & Steinmann G (2004). Inhibition of leukotriene B4‐induced CD11B/CD18 (Mac‐1) expression by BIIL 284, a new long acting LTB4 receptor antagonist, in patients with rheumatoid arthritis. Ann Rheum Dis 63, 170–176. [DOI] [PMC free article] [PubMed] [Google Scholar]
- Barhoumi T, Kasal DA, Li MW, Shbat L, Laurant P, Neves MF, Paradis P & Schiffrin EL (2011). T regulatory lymphocytes prevent angiotensin II‐induced hypertension and vascular injury. Hypertension 57, 469–476. [DOI] [PubMed] [Google Scholar]
- Bautista LE, Vera LM, Arenas IA & Gamarra G (2005). Independent association between inflammatory markers (C‐reactive protein, interleukin‐6, and TNF‐alpha) and essential hypertension. J Hum Hypertens 19, 149–154. [DOI] [PubMed] [Google Scholar]
- Bäck M, Bu D‐X, Bränström R, Sheikine Y, Yan Z‐Q & Hansson GK (2005). Leukotriene B4 signalling through NF‐kappaB‐dependent BLT1 receptors on vascular smooth muscle cells in atherosclerosis and intimal hyperplasia. Proc Natl Acad Sci USA 102, 17501–17506. [DOI] [PMC free article] [PubMed] [Google Scholar]
- Bevan S, Dichgans M, Wiechmann HE, Gschwendtner A, Meitinger T & Markus HS (2008). Genetic variation in members of the leukotriene biosynthesis pathway confer an increased risk of ischemic stroke: a replication study in two independent populations. Stroke 39, 1109–1114. [DOI] [PubMed] [Google Scholar]
- Brach MA, de Vos S, Arnold C, Gruss HJ, Mertelsmann R & Herrmann F (1992). Leukotriene B4 transcriptionally activates interleukin‐6 expression involving NK‐chi B and NF‐IL6. Eur J Immunol 22, 2705–2711. [DOI] [PubMed] [Google Scholar]
- Briant LJB, O'Callaghan EL, Champneys AR & Paton JFR (2015). Respiratory modulated sympathetic activity: a putative mechanism for developing vascular resistance? J Physiol 593, 5341–5360. [DOI] [PMC free article] [PubMed] [Google Scholar]
- Busse W & Kraft M (2005). Cysteinyl leukotrienes in allergic inflammation: strategic target for therapy. Chest 127, 1312–1326. [DOI] [PubMed] [Google Scholar]
- Canetti CA, Leung BP, Culshaw S, McInnes IB, Cunha FQ, Liew FY & Cannetti CA (2003). IL‐18 enhances collagen‐induced arthritis by recruiting neutrophils via TNF‐alpha and leukotriene B4 . J Immunol 171, 1009–1015. [DOI] [PubMed] [Google Scholar]
- Chae CU, Lee RT, Rifai N & Ridker PM (2001). Blood pressure and inflammation in apparently healthy men. Hypertension 38, 399–403. [DOI] [PubMed] [Google Scholar]
- Chen Z, Gaudreau R, Le Gouill C, Rola‐Pleszczynski M & Stanková J (2004). Agonist‐induced internalization of leukotriene B4 receptor 1 requires G‐protein‐coupled receptor kinase 2 but not arrestins. Mol Pharmacol 66, 377–386. [DOI] [PubMed] [Google Scholar]
- Colombari E, Colombari DSA, Li H, Shi P, Dong Y, Jiang N, Raizada MK, Sumners C, Murphy D & Paton JFR (2010). Macrophage migration inhibitory factor in the paraventricular nucleus plays a major role in the sympathoexcitatory response to salt. Hypertension 56, 956–963. [DOI] [PMC free article] [PubMed] [Google Scholar]
- D'Arcangelo G, Tancredi V, Onofri F, D'Antuono M, Giovedì S & Benfenati F (2000). Interleukin‐6 inhibits neurotransmitter release and the spread of excitation in the rat cerebral cortex. Eur J Neurosci 12, 1241–1252. [DOI] [PubMed] [Google Scholar]
- Dalekos GN, Elisaf M, Bairaktari E, Tsolas O & Siamopoulos KC (1997). Increased serum levels of interleukin‐1beta in the systemic circulation of patients with essential hypertension: additional risk factor for atherogenesis in hypertensive patients? J Lab Clin Med 129, 300–308. [DOI] [PubMed] [Google Scholar]
- Dange RB, Agarwal D, Teruyama R & Francis J (2015). Toll‐like receptor 4 inhibition within the paraventricular nucleus attenuates blood pressure and inflammatory response in a genetic model of hypertension. J Neuroinflammation 12, 31. [DOI] [PMC free article] [PubMed] [Google Scholar]
- DeCicco D, Zhu H, Brureau A, Schwaber JS & Vadigepalli R (2015). microRNA network changes in the brainstem underlie the development of hypertension. Physiol Genomics 47, 388–399. [DOI] [PMC free article] [PubMed] [Google Scholar]
- Díaz‐González F, Alten RHE, Bensen WG, Brown JP, Sibley JT, Dougados M, Bombardieri S, Durez P, Ortiz P, de‐Miquel G, Staab A, Sigmund R, Salin L, Leledy C & Polmar SH (2007). Clinical trial of a leucotriene B4 receptor antagonist, BIIL 284, in patients with rheumatoid arthritis. Ann Rheum Dis 66, 628–632. [DOI] [PMC free article] [PubMed] [Google Scholar]
- Elks CM, Mariappan N, Haque M, Guggilam A, Majid DSA & Francis J (2009). Chronic NF‐{kappa}B blockade reduces cytosolic and mitochondrial oxidative stress and attenuates renal injury and hypertension in SHR. Am J Physiol Renal Physiol 296, F298–F305. [DOI] [PMC free article] [PubMed] [Google Scholar]
- Gaudreau R, Le Gouill C, Venne M‐H, Stanková J & Rola‐Pleszczynski M (2002). Threonine 308 within a putative casein kinase 2 site of the cytoplasmic tail of leukotriene B4 receptor (BLT1) is crucial for ligand‐induced, G‐protein‐coupled receptor‐specific kinase 6‐mediated desenositization. J Biol Chem 277, 31567–31576. [DOI] [PubMed] [Google Scholar]
- Goodarzi K, Goodarzi M, Tager AM, Luster AD & Andrianvon UH (2003). Leukotriene B4 and BLT1 control cytotoxic effector T cell recruitment to inflamed tissues. Nat Immunol 4, 965–973. [DOI] [PubMed] [Google Scholar]
- Gosselin D & Rivest S (2007). Role of IL‐1 and TNF in the brain: twenty years of progress on a Dr. Jekyll/Mr. Hyde duality of the innate immune system. Brain Behav Immun 21, 281–289. [DOI] [PubMed] [Google Scholar]
- Gouraud SS, Waki H, Bhuiyan MER, Takagishi M, Cui H, Kohsaka A, Paton JFR & Maeda M (2011). Down‐regulation of chemokine Ccl5 gene expression in the NTS of SHR may be pro‐hypertensive. J Hypertens 29, 732–740. [DOI] [PubMed] [Google Scholar]
- Grespan R, Fukada SY, Lemos HP, Vieira SM, Napimoga MH, Teixeira MM, Fraser AR, Liew FY, McInnes IB & Cunha FQ (2008). CXCR2‐specific chemokines mediate leukotriene B4‐dependent recruitment of neutrophils to inflamed joints in mice with antigen‐induced arthritis. Arthritis Rheum 58, 2030–2040. [DOI] [PubMed] [Google Scholar]
- Guzik TJ, Hoch NE, Brown KA, McCann LA, Rahman A, Dikalov S, Goronzy J, Weyand C & Harrison DG (2007). Role of the T cell in the genesis of angiotensin II induced hypertension and vascular dysfunction. J Exp Med 204, 2449–2460. [DOI] [PMC free article] [PubMed] [Google Scholar]
- Hardy G, Stanke‐Labesque F, Peoc'h M, Hakim A, Devillier P, Caron F, Morel S, Faure P, Halimi S & Bessard G (2001). Cysteinyl leukotrienes modulate angiotensin II constrictor effects on aortas from streptozotocin‐induced diabetic rats. Arterioscler Thromb Vasc Biol 21, 1751–1758. [DOI] [PubMed] [Google Scholar]
- Harrison DG, Vinh A, Lob H & Madhur MS (2010). Role of the adaptive immune system in hypertension. Curr Opin Pharmacol 10, 203–207. [DOI] [PMC free article] [PubMed] [Google Scholar]
- Harwani SC, Chapleau MW, Legge KL, Ballas ZK & Abboud FM (2012). Neurohormonal modulation of the innate immune system is proinflammatory in the prehypertensive spontaneously hypertensive rat, a genetic model of essential hypertension. Circ Res 111, 1190–1197. [DOI] [PMC free article] [PubMed] [Google Scholar]
- Huang L, Zhao A, Wong F, Ayala JM, Struthers M, Ujjainwalla F, Wright SD, Springer MS, Evans J & Cui J (2004). Leukotriene B4 strongly increases monocyte chemoattractant protein‐1 in human monocytes. Arterioscler Thromb Vasc Biol 24, 1783–1788. [DOI] [PubMed] [Google Scholar]
- Jakschik BA & Kuo CG (1983). Characterization of leukotriene A4 and B4 biosynthesis. Prostaglandins 25, 767–782. [DOI] [PubMed] [Google Scholar]
- Jun JY, Zubcevic J, Qi Y, Afzal A, Carvajal JM, Thinschmidt JS, Grant MB, Mocco J & Raizada MK (2012). Brain‐mediated dysregulation of the bone marrow activity in angiotensin II‐induced hypertension. Hypertension 60, 1316–1323. [DOI] [PMC free article] [PubMed] [Google Scholar]
- Kang Y‐M, He R‐L, Yang L‐M, Qin D‐N, Guggilam A, Elks C, Yan N, Guo Z & Francis J (2009). Brain tumour necrosis factor‐alpha modulates neurotransmitters in hypothalamic paraventricular nucleus in heart failure. Cardiovasc Res 83, 737–746. [DOI] [PMC free article] [PubMed] [Google Scholar]
- Kihara Y, Yokomizo T, Kunita A, Morishita Y, Fukayama M, Ishii S & Shimizu T (2010). The leukotriene B4 receptor, BLT1, is required for the induction of experimental autoimmune encephalomyelitis. Biochem Biophys Res Commun 394, 673–678. [DOI] [PubMed] [Google Scholar]
- Kim CH & Vaziri ND (2005). Hypertension promotes integrin expression and reactive oxygen species generation by circulating leukocytes. Kidney Int 67, 1462–1470. [DOI] [PubMed] [Google Scholar]
- Kirabo A, Fontana V, de Faria AP, Loperena R, Galindo CL, Wu J, Bikineyeva AT, Dikalov S, Xiao L, Chen W et al (2014). DC isoketal‐modified proteins activate T cells and promote hypertension. J Clin Invest 124, 4642–4656. [DOI] [PMC free article] [PubMed] [Google Scholar]
- Li H‐B, Qin D‐N, Cheng K, Su Q, Miao Y‐W, Guo J, Zhang M, Zhu G‐Q & Kang Y‐M (2015). Central blockade of salusin β attenuates hypertension and hypothalamic inflammation in spontaneously hypertensive rats. Sci Rep 5, 11162. [DOI] [PMC free article] [PubMed] [Google Scholar]
- Li P, Oh DY, Bandyopadhyay G, Lagakos WS, Talukdar S, Osborn O, Johnson A, Chung H, Mayoral R, Maris M, Ofrecio JM, Taguchi S, Lu M & Olefsky JM (2015). LTB4 promotes insulin resistance in obese mice by acting on macrophages, hepatocytes and myocytes. Nat Med 21, 239–247. [DOI] [PMC free article] [PubMed] [Google Scholar]
- Lone AM & Taskén K (2013). Proinflammatory and immunoregulatory roles of eicosanoids in T cells. Front Immunol 4, 130. [DOI] [PMC free article] [PubMed] [Google Scholar]
- McBryde FD, Abdala AP, Hendy EB, Pijacka W, Marvar P, Moraes DJA, Sobotka PA & Paton JFR (2013). The carotid body as a putative therapeutic target for the treatment of neurogenic hypertension. Nat Communt 4, 1–11. [DOI] [PubMed] [Google Scholar]
- McBryde FD, Malpas SC, Guild SJ & Barrett CJ (2009). A high‐salt diet does not influence renal sympathetic nerve activity: a direct telemetric investigation. Am J Physiol Regul Integr Comp Physiol 297, R396–R402. [DOI] [PubMed] [Google Scholar]
- Marvar PJ & Harrison DG (2012). Stress‐dependent hypertension and the role of T lymphocytes. Exp Physiol 97, 1161–1167. [DOI] [PMC free article] [PubMed] [Google Scholar]
- Marvar PJ, Thabet SR, Guzik TJ, Lob HE, McCann LA, Weyand C, Gordon FJ & Harrison DG (2010). Central and peripheral mechanisms of T‐lymphocyte activation and vascular inflammation produced by angiotensin II‐induced hypertension. Circ Res 107, 263–270. [DOI] [PMC free article] [PubMed] [Google Scholar]
- Matsuo M, Hamasaki Y, Fujiyama F & Miyazaki S (1995). Eicosanoids are produced by microglia, not by astrocytes, in rat glial cell cultures. Brain Res 685, 201–204. [DOI] [PubMed] [Google Scholar]
- Mattson DL, Lund H, Guo C, Rudemiller N, Geurts AM & Jacob H (2013). Genetic mutation of recombination activating gene 1 in Dahl salt‐sensitive rats attenuates hypertension and renal damage. Am J Physiol Regul Integr Comp Physiol 304, R407–R414. [DOI] [PMC free article] [PubMed] [Google Scholar]
- Medoff BD, Seung E, Wain JC, Means TK, Campanella GSV, Islam SA, Thomas SY, Ginns LC, Grabie N, Lichtman AH, Tager AM & Luster AD (2005). BLT1‐mediated T cell trafficking is critical for rejection and obliterative bronchiolitis after lung transplantation. J Exp Med 202, 97–110. [DOI] [PMC free article] [PubMed] [Google Scholar]
- Moraes DJA, Machado BH & Paton JFR (2014). Specific respiratory neuron types have increased excitability that drive presympathetic neurones in neurogenic hypertension. Hypertension 63, 1309–1318. [DOI] [PubMed] [Google Scholar]
- Murray J, Ward C, O'Flaherty JT, Dransfield I, Haslett C, Chilvers ER & Rossi AG (2003). Role of leukotrienes in the regulation of human granulocyte behaviour: dissociation between agonist‐induced activation and retardation of apoptosis. Br J Pharmacol 139, 388–398. [DOI] [PMC free article] [PubMed] [Google Scholar]
- Nozoe M, Hirooka Y, Koga Y, Sagara Y, Kishi T, Engelhardt JF & Sunagawa K (2007). Inhibition of Rac1‐derived reactive oxygen species in nucleus tractus solitarius decreases blood pressure and heart rate in stroke‐prone spontaneously hypertensive rats. Hypertension 50, 62–68. [DOI] [PubMed] [Google Scholar]
- Paton JFR & Waki H (2009). Is neurogenic hypertension related to vascular inflammation of the brainstem? Neurosci Biobehav Rev 33, 89–94. [DOI] [PubMed] [Google Scholar]
- Peterson JR, Sharma RV & Davisson RL (2006). Reactive oxygen species in the neuropathogenesis of hypertension. Curr Hypertens Rep 8, 232–241. [DOI] [PubMed] [Google Scholar]
- Pĭtre M, Gaudreault N, Santuré M, Nadeau A & Bachelard H (1999). Isradipine and insulin sensitivity in hypertensive rats. Am J Physiol Endocrinol Metab 276, E1038–E1048. [DOI] [PubMed] [Google Scholar]
- Purushothaman S, Renuka Nair R, Harikrishnan VS & Fernandez AC (2011). Temporal relation of cardiac hypertrophy, oxidative stress, and fatty acid metabolism in spontaneously hypertensive rat. Mol Cell Biochem 351, 59–64. [DOI] [PubMed] [Google Scholar]
- Qiu H, Johansson A‐S, Sjöström M, Wan M, Schröder O, Palmblad J & Haeggström JZ (2006). Differential induction of BLT receptor expression on human endothelial cells by lipopolysaccharide, cytokines, and leukotriene B4. Proc Natl Acad Sci USA 103, 6913–6916. [DOI] [PMC free article] [PubMed] [Google Scholar]
- R Core Team (2015). R: A language and environment for statistical computing. R Foundation for Statistical Computing, Vienna, Austria. URL http://www.R-project.org/.
- Rodríguez‐Iturbe B, Ferrebuz A, Vanegas V, Quiroz Y, Mezzano S & Vaziri ND (2005). Early and sustained inhibition of nuclear factor‐kappaB prevents hypertension in spontaneously hypertensive rats. J Pharmacol Exp Ther 315, 51–57. [DOI] [PubMed] [Google Scholar]
- Rostène W, Kitabgi P & Parsadaniantz SM (2007). Chemokines: a new class of neuromodulator? Nat Rev Neurosci 8, 895–903. [DOI] [PubMed] [Google Scholar]
- Saiwai H, Ohkawa Y, Yamada H, Kumamaru H, Harada A, Okano H, Yokomizo T, Iwamoto Y & Okada S (2010). The LTB4–BLT1 axis mediates neutrophil infiltration and secondary injury in experimental spinal cord injury. Am J Pathol 176, 2352–2366. [DOI] [PMC free article] [PubMed] [Google Scholar]
- Salmi M, Karikoski M, Elima K, Rantakari P & Jalkanen S (2013). CD44 binds to macrophage mannose receptor on lymphatic endothelium and supports lymphocyte migration via afferent lymphatics. Circ Res 112, 1577–1582. [DOI] [PubMed] [Google Scholar]
- Sampey DB, Burrell LM & Widdop RE (1999). Vasopressin V2 receptor enhances gain of baroreflex in conscious spontaneously hypertensive rats. Am J Physiol Regul Integr Comp Physiol 276, R872–R879. [DOI] [PubMed] [Google Scholar]
- Schmid‐Schonbein GW, Seiffge D, DeLano FA, Shen K & Zweifach BW (1991). Leukocyte counts and activation in spontaneously hypertensive and normotensive rats. Hypertension 17, 323–330. [DOI] [PubMed] [Google Scholar]
- Serezani CH, Lewis C, Jancar S & Peters‐Golden M (2011). Leukotriene B4 amplifies NF‐κB activation in mouse macrophages by reducing SOCS1 inhibition of MyD88 expression. J Clin Invest 121, 671–682. [DOI] [PMC free article] [PubMed] [Google Scholar]
- Shi P, Diez‐Freire C, Jun JY, Qi Y, Katovich MJ, Li Q, Sriramula S, Francis J, Sumners C & Raizada MK (2010). Brain microglial cytokines in neurogenic hypertension. Hypertension 56, 297–303. [DOI] [PMC free article] [PubMed] [Google Scholar]
- Showell HJ, Breslow R, Conklyn MJ, Hingorani GP & Koch K (1996). Characterization of the pharmacological profile of the potent LTB4 antagonist CP‐105,696 on murine LTB4 receptors in vitro . British Journal of Pharmacology 117, 1127–1132. [DOI] [PMC free article] [PubMed] [Google Scholar]
- Simms AE, Paton JFR, Pickering AE & Allen AM (2009). Amplified respiratory‐sympathetic coupling in the spontaneously hypertensive rat: does it contribute to hypertension? J Physiol 587, 597–610. [DOI] [PMC free article] [PubMed] [Google Scholar]
- Singh MV, Cicha MZ, Meyerholz DK, Chapleau MW & Abboud FM (2015). Dual activation of TRIF and MyD88 adaptor proteins by angiotensin II evokes opposing effects on pressure, cardiac hypertrophy, and inflammatory gene expression. Hypertension 66, 647–656. [DOI] [PMC free article] [PubMed] [Google Scholar]
- Souza DG, Coutinho SF, Silveira MR, Cara DC & Teixeira MM (2000). Effects of a BLT receptor antagonist on local and remote reperfusion injuries after transient ischemia of the superior mesenteric artery in rats. Eur J Pharmacol 403, 121–128. [DOI] [PubMed] [Google Scholar]
- Spite M, Hellmann J, Tang Y, Mathis SP, Kosuri M, Bhatnagar A, Jala VR & Haribabu B (2011). Deficiency of the leukotriene B4 receptor, BLT‐1, protects against systemic insulin resistance in diet‐induced obesity. J Immunol 187, 1942–1949. [DOI] [PMC free article] [PubMed] [Google Scholar]
- Sriramula S, Cardinale JP & Francis J (2013). Inhibition of TNF in the brain reverses alterations in RAS components and attenuates angiotensin II‐induced hypertension. PLoS One 8, e63847. [DOI] [PMC free article] [PubMed] [Google Scholar]
- Tager AM & Luster AD (2003). BLT1 and BLT2: the leukotriene B4 receptors. Prostaglandins Leukot Essent Fatty Acids 69, 123–134. [DOI] [PubMed] [Google Scholar]
- Takagishi M, Waki H, Bhuiyan MER, Gouraud SS, Kohsaka A, Cui H, Yamazaki T, Paton JFR & Maeda M (2010). IL‐6 microinjected in the nucleus tractus solitarii attenuates cardiac baroreceptor reflex function in rats. Am J Physiol Regul Integr Comp Physiol 298, R183–R190. [DOI] [PubMed] [Google Scholar]
- Taniyama Y & Griendling KK (2003). Reactive oxygen species in the vasculature: molecular and cellular mechanisms. Hypertension 42, 1075–1081. [DOI] [PubMed] [Google Scholar]
- Tian W, Jiang X, Tamosiuniene R, Sung YK, Qian J, Dhillon G, Gera L, Farkas L, Rabinovitch M, Zamanian RT, Inayathullah M, Fridlib M, Rajadas J, Peters‐Golden M, Voelkel NF & Nicolls MR (2013). Blocking macrophage leukotriene b4 prevents endothelial injury and reverses pulmonary hypertension. Sci Transl Med 5, 200ra117. [DOI] [PMC free article] [PubMed] [Google Scholar]
- Trott DW & Harrison DG (2014). The immune system in hypertension. Adv Physiol Educ 38, 20–24. [DOI] [PMC free article] [PubMed] [Google Scholar]
- Virdis A & Schiffrin EL (2003). Vascular inflammation: a role in vascular disease in hypertension? Curr Opin Nephrol Hypertens 12, 181–187. [DOI] [PubMed] [Google Scholar]
- Vitturi DA, Chen C‐S, Woodcock SR, Salvatore SR, Bonacci G, Koenitzer JR, Stewart NA, Wakabayashi N, Kensler TW, Freeman BA & Schopfer FJ (2013). Modulation of nitro‐fatty acid signalling: prostaglandin reductase‐1 is a nitroalkene reductase. J Biol Chem 288, 25626–25637. [DOI] [PMC free article] [PubMed] [Google Scholar]
- Waki H, Gouraud SS, Maeda M & Paton JFR (2008). Gene expression profiles of major cytokines in the nucleus tractus solitarii of the spontaneously hypertensive rat. Auton Neurosci 142, 40–44. [DOI] [PubMed] [Google Scholar]
- Waki H, Gouraud SS, Maeda M & Paton JFR (2010). Evidence of specific inflammatory condition in nucleus tractus solitarii of spontaneously hypertensive rats. Exp Physiol 95, 595–600. [DOI] [PubMed] [Google Scholar]
- Waki H, Gouraud SS, Maeda M, Raizada MK & Paton JFR (2011). Contributions of vascular inflammation in the brainstem for neurogenic hypertension. Resp Physiol Neurobiol 178, 422–428. [DOI] [PubMed] [Google Scholar]
- Waki H, Hendy EB, Hindmarch CCT, Gouraud S, Toward M, Kasparov S, Murphy D & Paton JFR (2013). Excessive leukotriene B4 in nucleus tractus solitarii is prohypertensive in spontaneously hypertensive rats. Hypertension 61, 194–201. [DOI] [PMC free article] [PubMed] [Google Scholar]
- Waki H, Katahira K, Polson JW, Kasparov S, Murphy D & Paton JFR (2006). Automation of analysis of cardiovascular autonomic function from chronic measurements of arterial pressure in conscious rats. Exp Physiol 91, 201–213. [DOI] [PubMed] [Google Scholar]
- Waki H, Liu B, Miyake M, Katahira K, Murphy D, Kasparov S & Paton JFR (2007). Junctional adhesion molecule‐1 is upregulated in spontaneously hypertensive rats: evidence for a prohypertensive role within the brain stem. Hypertension 49, 1321–1327. [DOI] [PubMed] [Google Scholar]
- Xu H, Oliveira‐Sales EB, McBride F, Liu B, Hewinson J, Toward M, Hendy EB, Graham D, Dominiczak AF, Giannotta M, Waki H, Ascione R, Paton JFR & Kasparov S (2012). Upregulation of junctional adhesion molecule‐A is a putative prognostic marker of hypertension. Cardiovasc Res 96, 552–560. [DOI] [PMC free article] [PubMed] [Google Scholar]
- Yokomizo T (2011). Leukotriene B4 receptors: Novel roles in immunological regulations. Adv Enzyme Regul 51, 59–64. [DOI] [PubMed] [Google Scholar]
- Yokomizo T, Izumi T & Shimizu T (2001). Leukotriene B4: metabolism and signal transduction. Arch Biochem Biophys 385, 231–241. [DOI] [PubMed] [Google Scholar]
- Zubcevic J, Waki H, Raizada MK & Paton JFR (2011). Autonomic‐Immune‐vascular interaction: an emerging concept for neurogenic hypertension. Hypertension 57, 1026–1033. [DOI] [PMC free article] [PubMed] [Google Scholar]