Abstract
AIM
To investigate the hypothesis that exposure to guanidinoacetate (GAA, a potent methyl-group consumer) either alone or combined with ethanol intake for a prolonged period of time would cause more advanced liver pathology thus identifying methylation defects as the initiator and stimulator for progressive liver damage.
METHODS
Adult male Wistar rats were fed the control or ethanol Lieber DeCarli diet in the absence or presence of GAA supplementation. At the end of 6 wk of the feeding regimen, various biochemical and histological analyses were conducted.
RESULTS
Contrary to our expectations, we observed that GAA treatment alone resulted in a histologically normal liver without evidence of hepatosteatosis despite persistence of some abnormal biochemical parameters. This protection could result from the generation of creatine from the ingested GAA. Ethanol treatment for 6 wk exhibited changes in liver methionine metabolism and persistence of histological and biochemical defects as reported before. Further, when the rats were fed the GAA-supplemented ethanol diet, similar histological and biochemical changes as observed after 2 wk of combined treatment, including inflammation, macro- and micro-vesicular steatosis and a marked decrease in the methylation index were noted. In addition, rats on the combined treatment exhibited increased liver toxicity and even early fibrotic changes in a subset of animals in this group. The worsening liver pathology could be related to the profound reduction in the hepatic methylation index, an increased accumulation of GAA and the inability of creatine generated to exert its hepato-protective effects in the setting of ethanol.
CONCLUSION
To conclude, prolonged exposure to a methyl consumer superimposed on chronic ethanol consumption causes persistent and pronounced liver damage.
Keywords: Methyl balance, S-adenosylmethionine, S-adenosylhomocysteine, Guanidinoacetate, Alcohol
Core tip: We examined the role of a combined exposure to ethanol and guanidinoacetate (GAA) in the pathogenesis of liver injury. Exposure to either treatment lowers the hepatic methylation index which is defined as the ratio of the methyl donor, S-adenosylmethionine to its product S-adenosylhomocysteine. We observed a worsening of liver pathology with prolonged GAA and ethanol treatment compared to either treatment alone. These detrimental consequences were related to the profound reduction in the hepatic methylation index, an increased accumulation of GAA and the inability of creatine generated to exert its hepato-protective effects in the setting of ethanol.
INTRODUCTION
Alcoholic liver disease is one of the most serious medical consequences of chronic ethanol use[1,2]. Investigations into the mechanisms of ethanol-induced liver injury have revealed that chronic ethanol abuse causes alterations in the methionine metabolism[3-5]. In particular, ethanol primarily impairs the activity of a vital enzyme, methionine synthase[6,7]. This reduction increases homocysteine secretion[8], promotes hepatic S-adenosylhomocysteine (SAH) accumulation[7,9] and causes a significant lowering in the hepatocellular S-adenosylmethionine (SAM, a methyl donor) to SAH ratio[7,9]. The resulting impairments in several transmethylation reactions have been shown to play a causal role in the generation of many hallmark features of alcoholic liver injury including steatosis, apoptosis, accumulation of damaged proteins and proteasome inhibition[3-5,7,10-14].
The above mentioned changes in methionine metabolism and significant hepatic steatosis are also evident as early as 2 wk of ethanol feeding[15]. Further, feeding rats a diet containing guanidinoacetate (GAA, a potent methyl group consumer) for only 2 wk depleted hepatic SAM levels and lowered SAM:SAH ratio resulting in macrovesicular steatosis[15]. This methylation stress occurs due to the increased utilization of SAM by the enzyme, guanidinoacetate methyltransferase (GAMT) that converts the administered GAA to form the methylated product, creatine[12,15-20]. Additionally, GAA and ethanol appeared to exert synergistic stress following 2 wk of feeding[15]. These GAA-supplemented ethanol diet-fed rats displayed marked decrease in the methylation index (i.e., SAM:SAH ratio), significantly increased triglyceride accumulation, inflammatory changes and liver toxicity compared to the GAA or ethanol-fed rats[15].
Based on the above considerations, we hypothesized that feeding a methyl group consumer in conjunction with ethanol for a longer period than 2 wk will stimulate the progression of disease to produce more serious liver damage. To test this premise, we again chose GAA as a surrogate for methyl group consumers whose ingestion has considerably increased in the last decade[21]. We planned the study exactly as our previous 2-wk study[15] except the time of exposure to GAA, ethanol or combined treatment was extended to 6 wk.
We report the tremendous resilience and adaptation of the liver to continuous insult by the methylation stressor, GAA. However, rats exposed to the ethanol and GAA-treatment combined displayed persistence of liver injury that appeared more pronounced at 6 wk compared to the other groups in this study and to the pathology seen at 2 wk of the combined regimen.
MATERIALS AND METHODS
Feeding procedure
Lieber-DeCarli control and ethanol liquid diets[22] were purchased from Dyets, Inc. (Bethlehem, PA). Male Wistar rats weighing 180 to 200 g purchased from Charles River Laboratories, Wilmington, MA) were weight-matched and divided into four groups. Each group consisted of 5 rats that were fed the control diet (Group 1), control diet supplemented with 0.36% GAA (w/v) (Group 2), ethanol diet consisting of 36% of total energy (Group 3) or ethanol diet supplemented with 0.36% GAA (Group 4) for a 6 wk period. Rats in Groups 1-3 were fed the amount of diet consumed by rats in Group 4. The care, use and procedures performed on these rats complied with NIH guidelines and all procedures were approved by the Institutional Animal Care and Use Committee at the Omaha Veterans Affairs Medical Center.
At sacrifice, the following tissues were collected and processed as indicated. Serum was prepared by centrifuging the serum separator tube containing the collected blood at 13000 × g for 5 min. A portion of the liver was processed for the preparation of a deproteinized extract using perchloric acid as previously described[7]. Another portion of the liver was immediately fixed in formalin for histology. A third portion of the liver was used to prepare the cytosol fraction as detailed[11] on the day of sacrifice. The remainder of the liver was freeze-clamped and stored at -70 °C for subsequent biochemical assays.
Histopathological evaluation
Hematoxylin and eosin stained liver sections slides were independently evaluated (by Orlicky DJ and French SW) using published criteria[23,24] in a blinded fashion.
Mallory trichrome staining was performed as detailed before. Briefly, the sections were treated with 1% fuchsin acid solution for 2 min, washed and stained with 1% phosphomolybdic acid solution. The sections were washed again and then incubated in a solution containing Methyl Blue (0.5%), Orange G (2%) and oxalic acid (2%) for 15 min. Slides were then washed thoroughly, dehydrated with ethanol, cleared with xylenes and mounted.
Olympus BX51 microscope equipped with a 4 megapixel Macrofire© digital camera (Optronics, Goleta, CA) was used to capture the images using the PictureFrame© Application 2.3 (Optronics). All images in each composite were processed by Photoshop© (Adobe Systems Inc., Mountain View, CA) and handled identically.
Hepatic SAM, SAH, GAA, creatine, triglycerides, cholesterol and non-essential fatty acid levels
High-performance liquid chromatography (HPLC) analysis was performed on the perchloric acid extract of total liver for determining SAM, SAH, creatine and GAA levels as detailed previously[7,12]. We also calculated the hepatic methylation index which is defined as the ratio of SAM to SAH.
The triglyceride, cholesterol and non-essential fatty acid (NEFA) content in the liver lipid extract was quantified using the diagnostics kits (Thermo Electron Clinical Chemistry, Louisville, CO and Wako Diagnostics, Richmond, VA) as detailed previously following the manufacturer’s instructions[7].
Serum homocysteine, aspartate transaminase, alanine transaminase, GAA, insulin, NEFA and ethanol levels
HPLC analysis was conducted to determine serum homocysteine and GAA levels as detailed in our previous publications[8,12]. Serum alanine transaminase (ALT)/aspartate transaminase (AST) levels were determined using the VITROS 5.1 FS Chemistry System (Ortho Clinical Diagnostics, Raritan, NJ). Commercially available ELISA kits from EMD Millipore (Billerica, MA) and Wako Diagnostics (Richmond, VA) were used to determine serum Insulin (and NEFA levels, respectively. Ethanol levels were quantified by gas chromatography using a Perkin-Elmer system[25].
GAMT and L-arginine:glycine amidinotransferase activity measurements
Liver cytosols were used for determining hepatic GAMT activity as detailed in our publication[12]. L-arginine:glycine amidinotransferase (AGAT) activity was assayed in kidney homogenates as detailed[12].
Proteasome activity
Trypsin-like (Suc-LSTR-AMC hydrolysis) and Chymotrypsin-like (Suc-LLVY-AMC hydrolysis) activity was determined as previously described[13,14] using liver cytosol fractions. Protein concentration were measured by the Bradford dye-binding procedure[26] and the specific enzyme activities were expressed as nanomoles of 4-amino, 7-methyl coumarin formed per mg protein per hour.
Statistical analysis
Data were analyzed by ANOVA followed by Tukey test for specific comparisons between means. A P value < 0.05 was regarded as statistically significant.
RESULTS
The body weights of the GAA-treated and their pair-fed controls were comparable. However, an approximately 10% to 20% lower body weight was noted for the ethanol-alone and the GAA-supplemented ethanol-fed rats despite the fact that all rats had identical caloric intake (Table 1). The liver weight and the percent liver-to-body weight ratio of GAA-treated and their pair-fed controls were similar at the end of 6-wk of the feeding regimen. Ethanol treatment for 6 wk increased the liver weight and percent liver-to-body ratio which was further augmented in the group of rats fed the GAA-supplemented ethanol diet (Table 1).
Table 1.
Effect of dietary ethanol or/and guanidinoacetate ingestion on pathology
| Control | Control + GAA | Ethanol | Ethanol + GAA | |
| Body weight (gm) | 366.71 ± 20.26a | 345.93 ± 12.30a | 301.00 ± 12.49b | 323.90 ± 12.89a |
| Liver weight (gm) | 9.82 ± 0.44a | 9.47 ± 0.44a | 11.70 ± 0.36b | 15.05 ± 0.71c |
| Liver-to body ratio (%) | 2.67 ± 0.07a | 2.74 ± 0.10a | 3.88 ± 0.25b | 4.64 ± 0.06c |
| Serum ALT (U/L) | 54.43 ± 1.65a | 56.57 ± 3.96a | 120.00 ± 15.59b | 222.00 ± 50.52b |
| Serum AST (U/L) | 63.00 ± 3.95a | 68.40 ± 10.79a | 135.23 ± 13.86b | 252.60 ± 54.19b |
| Serum GAA (μmol/L) | 1.92 ± 0.31a | 60.60 ± 6.73b | 2.97 ± 1.05a | 23.63 ± 1.32c |
| Serum ethanol levels (mmol/L) | 0 ± 0.00a | 0 ± 0.00a | 51.10 ± 4.346b | 44.94 ± 6.28b |
| Hepatic GAMT activity | 247.58 ± 22.31a | 412.13 ± 24.92c | 207.19 ± 22.32b | 445.198 ± 23.19c |
| (pmol Creatine synthesized/min/mg protein) | ||||
| Kidney AGAT activity | 10.03 ± 1.17a | 2.30 ± 0.177b | 10.39 ± 1.07a | 2.882 ± 0.44b |
| (nmol GAA synthesized/min/mg protein) |
Data represent mean ± SEM. of n = 5 animals/group. Values not sharing a common subscript letter are statistically different, P < 0.05. AGAT: L-arginine:glycine amidinotransferase; GAA: Guanidinoacetate; AST: Aspartate transaminase; ALT: Alanine transaminase.
GAA enhances ethanol-induced steatosis
We observed that 6 wk of ethanol administration increased hepatic triglyceride and cholesterol accumulation by approximately 6- and 3-fold, respectively compared with the pair-fed controls (Figure 1A and B). There was no change in the triglyceride or cholesterol content in liver of GAA-fed rats compared to controls. However, a approximately 11- and 7-fold increase in triglyceride and cholesterol accumulation, respectively, was observed in livers of rats fed the GAA-supplemented ethanol diet compared with the pair-fed controls (Figure 1A and B).
Figure 1.
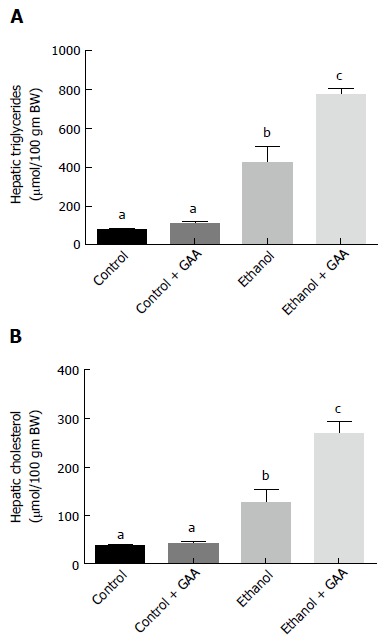
Effect of dietary ethanol or/and guanidinoacetate ingestion on hepatic triglycerides and cholesterol levels. Male Wistar rats were fed the control or ethanol Lieber DeCarli diet with or without 0.36% GAA. After 6 wk of feeding, triglyceride (A) and cholesterol (B) content in the liver lipid extract was determined using the diagnostics kit (Thermo Electron Clinical Chemistry, Louisville, CO). The data shown are mean ± SEM of 5 determinations. Values not sharing a common subscript letter are statistically different, P < 0.05 vs control. GAA: Guanidinoacetate.
Histological evaluation
The livers of the rats fed the control diet showed no macro- or microvesicular steatosis and the total percent of hepatocytes possessing lipid vesicles was less than 10% in all animals. There was no fibrosis present or inflammation (small foci of inflammatory cells, lipogranulomas, or portal triad inflammation). Furthermore no hepatocyte cell injury, sinusoidal dilatation or congestion was observed in any animal in this group (Figure 2A).
Figure 2.
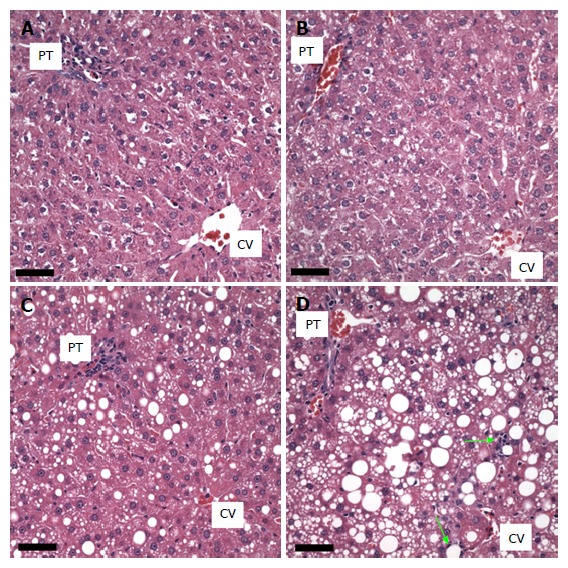
Effect of dietary ethanol or/and guanidinoacetate ingestion on liver histology. Hematoxylin-eosin stained images of livers from animals fed the following diets are shown: Pair-fed control (A); 0.36% guanidinoacetate (GAA) (B); ethanol (C); ethanol + 0.36% GAA (D). Scale bars = 50 microns. Limited macrosteatosis was observed following the ethanol diet while much more extensive macrosteatosis with a limited number of cells exhibiting microsteatosis and a couple of small lipogranulomas (arrows) are seen in the livers of animals on the ethanol + 0.36% GAA diet. The livers of the animals on the 0.36% GAA diet are similar to the control livers. PT: Portal triad; CV: Central vein.
The histology of the GAA treated group (n = 5) was similar to the control group. None of the animals presented with either macro- or microsteatosis. There also was no evidence of fibrosis, inflammatory changes or hepatocyte cell injury in this group of animals (Figure 2B).
In the ethanol-treated group (n = 5), all rats exhibited a panlobular microvesicular pattern of steatosis and low levels of macrosteatosis in zones 2 and 3. No fibrosis, inflammatory changes or hepatocyte cell injury was seen in this group of animals (Figure 2C and 3A).
In the ethanol plus GAA- treated group (n = 5) there appeared to be some synergy between the treatments. All 5 animals had macrosteatosis in 10%-66% of their hepatocytes which was present in a panlobular pattern, although there was more macrosteatosis in zones 2 and 3. Microsteatosis was also present in all 5 animals and it too was found in a panlobular pattern (Figure 2D).
Further, all rats in the ethanol + GAA-treated group exhibited small foci of inflammatory cells per 200 × field and the presence of lipogranulomas (Figure 3B). Analysis of the Mallory trichrome stained slides revealed a very small amount of fibrosis in 2 of the 5 animals in this treatment group and only one of these two exhibited small amount of sinusoidal fibrosis (Figure 4). One animal showed a few hepatocytes with cell injury while another exhibited slightly dilated sinusoids in the centrilobular region.
Figure 3.
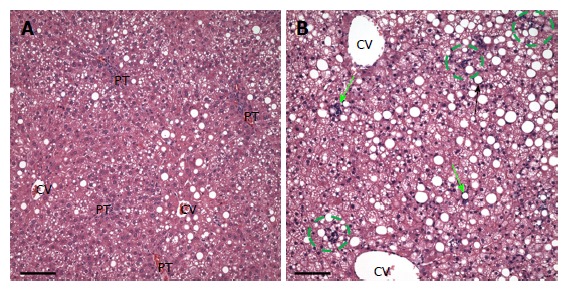
Hematoxylin-eosin staining of liver sections from rats fed ethanol (A) or ethanol + 0.36% guanidinoacetate (B) for 6-wk. There is a diffuse inflammatory infiltrate in the liver from the rat fed ethanol plus guanidinoacetate. Green arrows indicate lipogranulomas, green circle indicates an inflammatory cell foci, Scale bar = 100 microns. PT: Portal triad, CV: Central vein.
Figure 4.
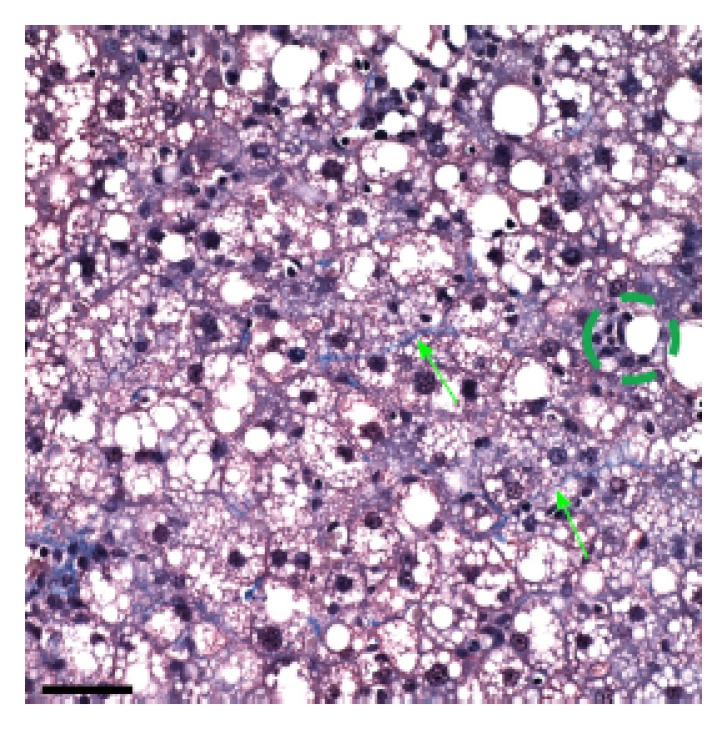
Higher magnified image from a Mallory trichrome stained liver section from a rat fed the ethanol + 0.36% guanidinoacetate for 6 wk. Green arrows point to delicate trichrome collagen fiber and green circle surrounds small inflammatory cell foci. Note the presence of many macro- and micro-steatotic hepatocytes Scale bar = 50 microns.
No ballooning of hepatocytes, significant numbers of acidophil bodies, pigmented macrophages, megamitochondria, Mallory Bodies, glycogenated nuclei, significant numbers of mitotic figures, or hyalinized and thickened portal veins or hepatic arteries were present in any of the groups in this experiment.
Hepatocellular levels of SAM, SAH, SAM:SAH Ratio, GAA and creatine
Hepatic SAM levels were similar between the control and ethanol-fed rats. This was in accordance with our previously published results[7,12]. However, SAM level was decreased in the GAA-treated rats, which was more pronounced in the rats fed the GAA-supplemented ethanol diet (Figure 5A).
Figure 5.
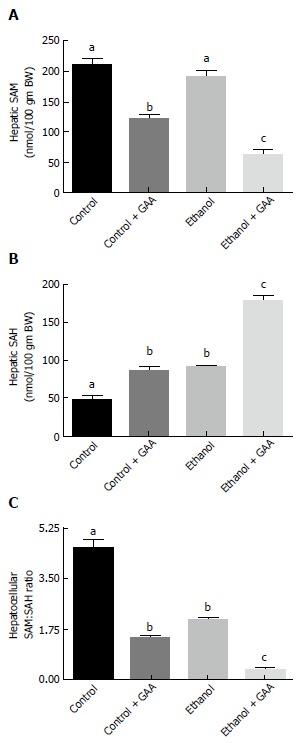
Effect of dietary ethanol and/or guanidinoacetate ingestion on hepatic S-adenosylmethionine, S-adenosylhomocysteine and S-adenosylmethionine: S-adenosylhomocysteine ratio. Rats were fed the Lieber DeCarli control or ethanol diet with or without 0.36% GAA supplementation. After 6 wk of feeding, Hepatocellular SAM (A) and SAH (B) levels were determined by HPLC analysis as detailed in the “MATERIALS AND METHODS” section and (C) SAM:SAH ratio calculated. The data shown are mean ± SEM of 5 determinations. Values not sharing a common subscript letter are statistically different, P < 0.05 vs control. GAA: Guanidinoacetate; SAM: S-adenosylmethionine; SAH: S-adenosylhomocysteine.
In regards to hepatic SAH levels, comparable increases in the level of this metabolite compared to controls were observed in GAA or ethanol treated rats. However, markedly increased hepatic SAH levels was noted in the group of rats fed the GAA-supplemented ethanol diet compared to other treatment groups (Figure 5B).
Since the SAM:SAH ratio is an important factor regulating cellular methylation reactions, calculation of this ratio revealed a lower SAM:SAH ratio in the ethanol-fed and the GAA-alone treated groups compared with the controls. A dramatic decrease in hepatocellular SAM:SAH ratio was seen in rats fed the GAA-supplemented ethanol diet in comparison with the other treatment groups (Figure 5C).
Regarding hepatic creatine and GAA levels after 6 wk of the dietary regimens, we observed a 60% decrease in hepatic creatine and a approximately 2-fold increase in GAA accumulation in rats exposed to ethanol as compared with the pair-fed controls (Figure 6A and B). This was in accordance with our published data obtained on feeding rats a control or ethanol diet for 4-5 wk[12]. However, GAA ingestion either alone or in combination with ethanol treatment elevated hepatic creatine and GAA levels, as expected. While the combined GAA + ethanol treatment had a significantly higher hepatic creatine content than the GAA-alone treatment, a statistically similar increase in hepatic GAA level was noted in these two groups of animals, showing almost 20-fold increased levels as compared with the control diet-fed rats (Figure 6B).
Figure 6.
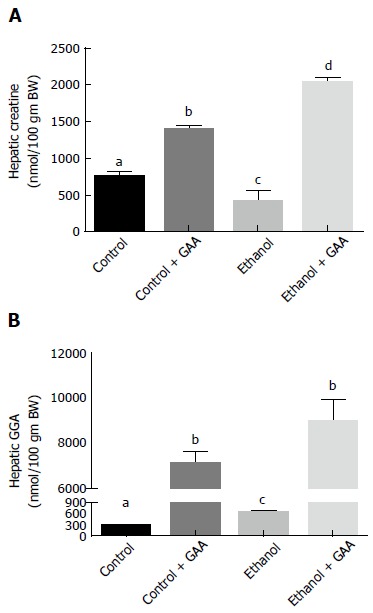
Effect of dietary ethanol and/or guanidinoacetate ingestion on hepatic creatine and guanidinoacetate levels. Rats were fed the Lieber DeCarli control or ethanol diet with or without 0.36% GAA supplementation. After 6 wk of feeding, liver Creatine (A) and GAA (B) levels were determined by HPLC analysis as detailed in the “MATERIALS AND METHODS” section. The data shown are mean ± SEM of 5 determinations. Values not sharing a common subscript letter are statistically different, P < 0.05 vs control. GAA: Guanidinoacetate.
Serum levels of homocysteine, GAA, insulin, NEFA, AST and ALT
Similar serum homocysteine levels were observed in the rats fed the control or ethanol diets for 6 wk. However feeding rats a GAA-supplemented diet increased circulating homocysteine level which was further dramatically increased in in the GAA-supplemented ethanol treated group (Figure 7A).
Figure 7.
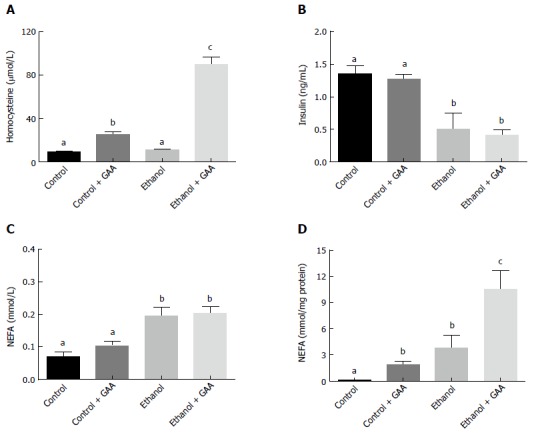
Effect of dietary ethanol and/or guanidinoacetate ingestion on serum homocysteine, insulin, non-essential fatty acid and hepatic non-essential fatty acid levels. Rats were fed the Lieber DeCarli control or ethanol diet with or without 0.36% GAA supplementation. After 6 wk of feeding, serum homocysteine (A) insulin (B) NEFA (C) and hepatic NEFA (Dlevels were determined by HPLC or biochemical analysis as detailed in the Materials and Methods section. The data shown are means ± SEM of 5 determinations. Values not sharing a common subscript letter are statistically different, P < 0.05 vs control. GAA: Guanidinoacetate; NEFA: Non-essential fatty acid.
GAA alone had no effect on circulating insulin or NEFA level (Figure 7B and C). On the other hand, ethanol administration decreased serum insulin levels and increased circulating NEFA levels, while GAA co-treatment had no further effect on these parameters (Figure 7B and C). All treatments produced a much higher hepatic NEFA compared with controls, although maximum elevation was seen in the combined treatment group (Figure 7D).
As expected, both the GAA-alone and combined ethanol and GAA treatment groups exhibited elevated serum GAA levels in comparison with the controls. However, the circulating GAA level in the combined treatment group was significantly lower than the level observed in the GAA-alone treatment group (Table 1).
Regarding liver toxicity, the serum levels of AST and ALT in the GAA-treated rats were similar to controls. Ethanol treatment significantly elevated serum AST and ALT levels, which were further enhanced approximately 2-fold in the combined GAA and ethanol treatment group (Table 1).
The blood ethanol levels were comparable in the ethanol-alone and combined ethanol and GAA treatment group despite dramatic differences in many metabolite levels and indices of liver toxicity between the two treatment groups (Table 1).
Hepatic GAMT and kidney AGAT activity
Ethanol administration for 6 wk resulted in a small (20%), but significant, decrease in hepatic GAMT activity compared to controls (Table 1). A approximately 1.7-fold increase in hepatic GAMT activity was observed in both GAA treatment groups (either alone or supplemented in the ethanol diet) (Table 1).
Kidney AGAT activity was unaffected after 6 wk of ethanol treatment (Table 1). A substantially suppressed kidney AGAT activity was observed after GAA administration for 6 wk which was comparable in the combined GAA-ethanol treatment group (Table 1).
Liver proteasome activity
A significant decline in trypsin- and chymotrypsin-like specific activities of the proteasome was noted in the rats fed ethanol for 6 wk which further decreased in the combined GAA and ethanol treatment group (Figure 8). Liver proteasome activity was unaffected by GAA-alone treatment (Figure 8).
Figure 8.
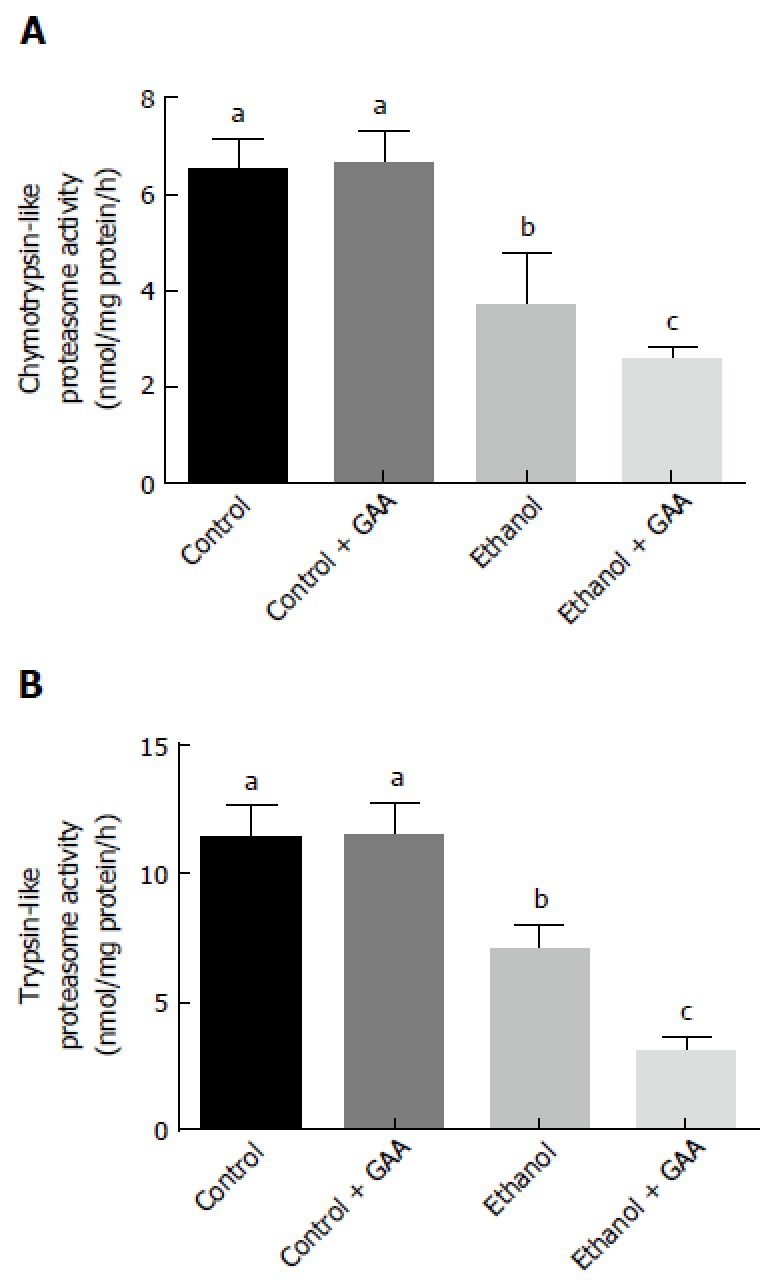
Effect of dietary ethanol and/or guanidinoacetate on peptidase specific activities of the proteasome. Rats were fed the Lieber DeCarli control or ethanol diet with or without 0.36% GAA supplementation. After 6 wk of feeding, liver cytosols were prepared and assayed for the chymotrypsin- (A) and trypsin-like (B) specific activities of the proteasome as detailed in the “MATERIALS AND METHODS” section. The results are mean ± SEM of 8-10 determinations from each group and activities are expressed as nmol AFC generated/mg protein/h. Values not sharing a common subscript letter are statistically different, P < 0.05 vs control. GAA: Guanidinoacetate.
DISCUSSION
Our findings indicate that the longer period of 6 wk of feeding GAA (a methyl group consumer) along with ethanol (a metabolic stressor) imposes a substantial burden on the cellular methylation index, which results in increased liver toxicity in comparison to our recently published 2-wk study[15]. However, some unexpected results were obtained on analyzing liver damage upon feeding GAA alone. While 2 wk of GAA treatment generated hepatic steatosis[15], this pathology was surprisingly absent at 6 wk of administration of this agent.
Our laboratory has been examining the consequences of the alcohol-induced changes in the methionine metabolism and have made a seminal contribution in identifying the causal role of the reduction in the hepatocellular SAM:SAH ratio in the pathogenesis of alcoholic liver injury[3,4,7-12,15,27-34]. In a recent study, we reported that 2 wk of ethanol feeding promoted hepatic SAH accumulation and caused a significant reduction in hepatocellular SAM:SAH ratio[15]. The consequent reduction in the hepatic methylation capacity resulted in hepatic steatosis and proteasome inhibition, the two examined functional consequences of low SAM:SAH ratio[15]. We also showed that feeding a methylation stressor, GAA, for 2 wk also perturbed the methionine metabolic pathway that caused a reduction in the hepatic SAM:SAH ratio. This ultimately resulted in similar histopathology as seen after ethanol exposure[15]. More importantly, we showed that the combined treatment with GAA and ethanol treatment further lowered the SAM:SAH causing even more profound pathological changes than either treatment alone[15].
To further investigate whether prolonged treatment with the combined exposure could worsen liver pathology, we observed that indeed 6 wk of treatment led to persistent and more pronounced liver toxicity. Several biochemical changes identified at 2 wk of combined exposure were also noted at 6 wk of treatment[15]. At both 2 and 6 wk of the combined treatment, we observed hyperhomocysteinemia, significantly lower hepatocellular SAM:SAH ratio, panlobular macro- and microvesicular hepatic steatosis, accumulation of cholesterol, triglyceride and NEFA in the liver and decreased hepatic proteasome activity as compared to the rest of the groups. The combined treatment group exhibited the lowest SAM:SAH ratio and the highest homocysteine serum levels that have been causally linked with hepatic lipid accumulation, reduced proteasome function and increased adipose tissue lipolysis[3-5,7,12-14,35,36]. The only significant differences between the 2 and 6 wk of combined exposure was an approximately 8-fold increased GAA accumulation, much higher homocysteinemia and approximately 2-fold increased serum AST and ALT levels at the latter time-point[15]. Overall, all these biochemical and pathological changes seen after 6 wk of combined exposure were as we had predicted.
However, some novel observations were made when the various parameters were analyzed in rats fed only GAA for 6 wk. Increases in serum homocysteine level and lowering of the hepatocellular SAM:SAH ratio noted at 6 wk were similar to our previous observations at the end of 2 wk of GAA treatment[15]. The only biochemical difference identified was a approximately 8-fold higher GAA accumulation at week 6 compared to the earlier time period[15]. However, despite the increased GAA and persistence of biochemical abnormalities that are known to reduce methylation capacity, there was no evidence of hepatic steatosis after 6 wk of GAA treatment. This was in contrast to our previous 2-wk study where we noted the development of hepatic steatosis with GAA treatment[15]. We believe that the significant elevation in the liver creatine level seen after prolonged GAA administration may be hepato-protective since such effects of creatine have been reported in both in vivo and in vitro injury models unrelated to ethanol exposure[12,37-43]. Mechanistic studies have indeed revealed that creatine supplementation prevents hepatic triglyceride accumulation by promoting hepatocellular β-oxidation via upregulating PPARα and its targets[38,42,43], inhibiting triglyceride synthesis and increasing its efflux[43]. These effects of creatine on lipid metabolism are considered to be independent of methylation and phosphatidylcholine synthesis via phosphatidylethanolamine methyltransferase-catalyzed pathway[43].
We were also surprised to find that hepatic creatine level was higher in rats administered the combined treatment compared with the GAA treatment group. Yet, this accumulated creatine was unable to exert its known protective effect when alcohol was present suggesting that creatine cannot prevent the well-documented ethanol-induced aberrations in several metabolic pathways of fat metabolism involving triglyceride efflux and fatty acid synthesis and oxidation. These findings are intriguing and mechanistic studies are underway to explain our findings. However, similar results that support our data were also obtained by us in a recent study that revealed an inability of oral creatine supplementation to prevent alcoholic steatosis[44].
We also examined two enzymes that are involved in GAA synthesis (AGAT) and utilization (GAMT). We observed that 6 wk of exposure to ethanol lowered the GAMT enzyme activity by approximately 20%, while GAA-alone treatment increased GAMT activity possibly to accelerate the utilization and removal of its substrate, GAA. Similar increases in GAMT activity were also noted in the combined GAA + ethanol treatment group. With regards to AGAT, in accordance with reports showing that GAA feeding represses the enzyme activity[45], we observed that 6 wk of GAA treatment either alone or combined with ethanol decreased AGAT activity by approximately 75%. It appears that a longer period of GAA administration represses GAA activity even more since approximately 50% repression was noted in the GAA-treated groups in our previous 2-wk study[15]. Overall, these two enzymes showed comparable changes as those reported after 2 wk of the different treatment regimens[15] and therefore, could not account for the differences in the hepatic steatosis seen in the GAA-fed rats at 6 wk vs 2 wk of treatment.
Another parameter to discuss is the loss of body weight in the rats fed ethanol either alone or in combination with GAA. Such decreases in body weight may be attributed to the ethanol-induced lipolysis of the adipose tissue triglyceride store with a concomitant increase in circulating and hepatic NEFA[46,47]. Clinical studies have also demonstrated that alcoholics have significantly lower body weight and lower fat mass than controls[48,49].
Further, a decrease in serum insulin level observed in ethanol-fed rats was also not surprising given that such a decrease has been reported before[46,50,51]. Furthermore, a recent preliminary study revealed that indeed it is the alcohol-induced increase in the serum ghrelin level and decrease in the pancreatic Rab3D content that both contribute to impaired insulin secretion from pancreatic β-cells, thereby causing a low serum insulin level in alcoholic rats[52].
To summarize, increased methylation demand by GAA treatment superimposed on the ethanol-induced stress on the methionine metabolic pathway results in steatohepatitis, proteasome inhibition and more pronounced indices of liver injury. These biochemical and pathological changes could be attributed to profoundly reduced hepatic SAM:SAH ratio, hyperhomocysteinemia, increased accumulation of GAA in the liver and the inability of creatine to protect the liver in the setting of ethanol abuse. Another important point that should be stressed is that while the prolonged administration of GAA alone did not produce any evidence of liver injury in the present study, sustained use of a different methyl group consumer that does not generate a protective agent such as creatine could have an entirely different (adverse) outcome. Thus, ingesting large amounts of methyl group consuming compounds either alone or in combination with ethanol is not recommended.
COMMENTS
Background
The authors have recently reported that rats exposed to guanidinoacetate (GAA, a potent methyl-group consumer) for 2 wk results in hepatic steatosis. They further showed that a combined exposure to GAA and ethanol (a cellular methylation stressor) for 2 wk caused more hepatosteatosis and inflammatory changes as compared to either treatment alone. Therefore, they investigated the hypothesis that exposure to GAA either alone or combined with ethanol intake for a prolonged period of time would cause more advanced liver pathology thus identifying methylation defects as the initiator and stimulator for progressive liver damage.
Research frontier
There are many endogenous and exogenous compounds that consume labile methyl groups during metabolism. The consumption of such compounds has increased in the last decade which puts a substantial burden on the cellular methylation index. The prevalence of binge and heavy alcohol drinking is growing. Thus, this area of research is extremely important to understand the effects of prolonged exposure to two different methylation stressors.
Innovations and breakthroughs
Prolonged treatment with both ethanol and a methyl consumer such as GAA causes worsening of liver pathology compared to either treatment alone. These detrimental consequences were related to the profound reduction in the hepatic methylation index, an increased accumulation of GAA and the inability of creatine generated to exert its hepato-protective effects in the setting of ethanol. Thus, ingesting large amounts of methyl group consuming compounds either alone or in combination with ethanol is not recommended.
Applications
This model of the combined treatment with a methyl consumer and ethanol for a prolonged duration could be used for better understanding of the role of severe impairments in critical methylation reaction to promote progressive liver injury including fibrosis, cirrhosis and hepatocellular carcinoma.
Terminology
Hepatic methylation index is defined as the ratio of the methyl donor, S-adenosylmethionine to its product S-adenosylhomocysteine. This ratio controls the biochemical transmethylation reactions.
Peer-review
An important point is to know whether prolonged administration of both GAA and ethanol would lead to hepatocellular carcinoma development and whether the observations are species-specific (rats, mice). Thus, this novel synergy could replace the current experimental models of ASH lacking the NASH component as observed after Lieber DeCarli feeding and represent an alternative to this diet alone. Moreover, if HCC development exists in the chronic situation this would a very valuable experimental tool for the study of ASH.
Footnotes
Manuscript source: Invited manuscript
Specialty type: Gastroenterology and hepatology
Country of origin: United States
Peer-review report classification
Grade A (Excellent): A
Grade B (Very good): B
Grade C (Good): 0
Grade D (Fair): 0
Grade E (Poor): 0
Conflict-of-interest statement: No potential conflicts of interest.
Peer-review started: June 24, 2016
First decision: August 22, 2016
Article in press: September 8, 2016
P- Reviewer: Cubero FJ, Strom SC S- Editor: Yu J L- Editor: A E- Editor: Zhang FF
References
- 1.Farooq MO, Bataller R. Pathogenesis and Management of Alcoholic Liver Disease. Dig Dis. 2016;34:347–355. doi: 10.1159/000444545. [DOI] [PMC free article] [PubMed] [Google Scholar]
- 2.Lívero FA, Acco A. Molecular basis of alcoholic fatty liver disease: From incidence to treatment. Hepatol Res. 2016;46:111–123. doi: 10.1111/hepr.12594. [DOI] [PubMed] [Google Scholar]
- 3.Kharbanda KK. Alcoholic liver disease and methionine metabolism. Semin Liver Dis. 2009;29:155–165. doi: 10.1055/s-0029-1214371. [DOI] [PubMed] [Google Scholar]
- 4.Kharbanda KK. Methionine metabolic pathway in alcoholic liver injury. Curr Opin Clin Nutr Metab Care. 2013;16:89–95. doi: 10.1097/MCO.0b013e32835a892a. [DOI] [PubMed] [Google Scholar]
- 5.Kharbanda KK, Bardag-Gorce F, Barve S, Molina PE, Osna NA. Impact of altered methylation in cytokine signaling and proteasome function in alcohol and viral-mediated diseases. Alcohol Clin Exp Res. 2013;37:1–7. doi: 10.1111/j.1530-0277.2012.01840.x. [DOI] [PMC free article] [PubMed] [Google Scholar]
- 6.Barak AJ, Beckenhauer HC, Tuma DJ, Badakhsh S. Effects of prolonged ethanol feeding on methionine metabolism in rat liver. Biochem Cell Biol. 1987;65:230–233. doi: 10.1139/o87-029. [DOI] [PubMed] [Google Scholar]
- 7.Kharbanda KK, Mailliard ME, Baldwin CR, Beckenhauer HC, Sorrell MF, Tuma DJ. Betaine attenuates alcoholic steatosis by restoring phosphatidylcholine generation via the phosphatidylethanolamine methyltransferase pathway. J Hepatol. 2007;46:314–321. doi: 10.1016/j.jhep.2006.08.024. [DOI] [PubMed] [Google Scholar]
- 8.Barak AJ, Beckenhauer HC, Kharbanda KK, Tuma DJ. Chronic ethanol consumption increases homocysteine accumulation in hepatocytes. Alcohol. 2001;25:77–81. doi: 10.1016/s0741-8329(01)00168-9. [DOI] [PubMed] [Google Scholar]
- 9.Barak AJ, Beckenhauer HC, Mailliard ME, Kharbanda KK, Tuma DJ. Betaine lowers elevated s-adenosylhomocysteine levels in hepatocytes from ethanol-fed rats. J Nutr. 2003;133:2845–2848. doi: 10.1093/jn/133.9.2845. [DOI] [PubMed] [Google Scholar]
- 10.Kharbanda KK, Rogers DD, Mailliard ME, Siford GL, Barak AJ, Beckenhauer HC, Sorrell MF, Tuma DJ. Role of elevated S-adenosylhomocysteine in rat hepatocyte apoptosis: protection by betaine. Biochem Pharmacol. 2005;70:1883–1890. doi: 10.1016/j.bcp.2005.09.021. [DOI] [PubMed] [Google Scholar]
- 11.Kharbanda KK, Mailliard ME, Baldwin CR, Sorrell MF, Tuma DJ. Accumulation of proteins bearing atypical isoaspartyl residues in livers of alcohol-fed rats is prevented by betaine administration: effects on protein-L-isoaspartyl methyltransferase activity. J Hepatol. 2007;46:1119–1125. doi: 10.1016/j.jhep.2007.01.026. [DOI] [PubMed] [Google Scholar]
- 12.Kharbanda KK, Todero SL, Moats JC, Harris RM, Osna NA, Thomes PG, Tuma DJ. Alcohol consumption decreases rat hepatic creatine biosynthesis via altered guanidinoacetate methyltransferase activity. Alcohol Clin Exp Res. 2014;38:641–648. doi: 10.1111/acer.12306. [DOI] [PubMed] [Google Scholar]
- 13.Osna NA, White RL, Donohue TM, Beard MR, Tuma DJ, Kharbanda KK. Impaired methylation as a novel mechanism for proteasome suppression in liver cells. Biochem Biophys Res Commun. 2010;391:1291–1296. doi: 10.1016/j.bbrc.2009.12.074. [DOI] [PMC free article] [PubMed] [Google Scholar]
- 14.Osna NA, White RL, Krutik VM, Wang T, Weinman SA, Donohue TM. Proteasome activation by hepatitis C core protein is reversed by ethanol-induced oxidative stress. Gastroenterology. 2008;134:2144–2152. doi: 10.1053/j.gastro.2008.02.063. [DOI] [PMC free article] [PubMed] [Google Scholar]
- 15.Kharbanda KK, Todero SL, Thomes PG, Orlicky DJ, Osna NA, French SW, Tuma DJ. Increased methylation demand exacerbates ethanol-induced liver injury. Exp Mol Pathol. 2014;97:49–56. doi: 10.1016/j.yexmp.2014.05.006. [DOI] [PubMed] [Google Scholar]
- 16.Mudd SH, Brosnan JT, Brosnan ME, Jacobs RL, Stabler SP, Allen RH, Vance DE, Wagner C. Methyl balance and transmethylation fluxes in humans. Am J Clin Nutr. 2007;85:19–25. doi: 10.1093/ajcn/85.1.19. [DOI] [PubMed] [Google Scholar]
- 17.Stead LM, Au KP, Jacobs RL, Brosnan ME, Brosnan JT. Methylation demand and homocysteine metabolism: effects of dietary provision of creatine and guanidinoacetate. Am J Physiol Endocrinol Metab. 2001;281:E1095–E1100. doi: 10.1152/ajpendo.2001.281.5.E1095. [DOI] [PubMed] [Google Scholar]
- 18.Fukada S, Setoue M, Morita T, Sugiyama K. Dietary eritadenine suppresses guanidinoacetic Acid-induced hyperhomocysteinemia in rats. J Nutr. 2006;136:2797–2802. doi: 10.1093/jn/136.11.2797. [DOI] [PubMed] [Google Scholar]
- 19.Setoue M, Ohuchi S, Morita T, Sugiyama K. Hyperhomocysteinemia induced by guanidinoacetic acid is effectively suppressed by choline and betaine in rats. Biosci Biotechnol Biochem. 2008;72:1696–1703. doi: 10.1271/bbb.70791. [DOI] [PubMed] [Google Scholar]
- 20.Ohuchi S, Matsumoto Y, Morita T, Sugiyama K. High-casein diet suppresses guanidinoacetic acid-induced hyperhomocysteinemia and potentiates the hypohomocysteinemic effect of serine in rats. Biosci Biotechnol Biochem. 2008;72:3258–3264. doi: 10.1271/bbb.80543. [DOI] [PubMed] [Google Scholar]
- 21.Zhou SS, Zhou YM, Li D, Lun YZ. Dietary methyl-consuming compounds and metabolic syndrome. Hypertens Res. 2011;34:1239–1245. doi: 10.1038/hr.2011.133. [DOI] [PubMed] [Google Scholar]
- 22.Lieber CS, DeCarli LM. Liquid diet technique of ethanol administration: 1989 update. Alcohol Alcohol. 1989;24:197–211. [PubMed] [Google Scholar]
- 23.French SW, Nash J, Shitabata P, Kachi K, Hara C, Chedid A, Mendenhall CL. Pathology of alcoholic liver disease. VA Cooperative Study Group 119. Semin Liver Dis. 1993;13:154–169. doi: 10.1055/s-2007-1007346. [DOI] [PubMed] [Google Scholar]
- 24.Kleiner DE, Brunt EM, Van Natta M, Behling C, Contos MJ, Cummings OW, Ferrell LD, Liu YC, Torbenson MS, Unalp-Arida A, et al. Design and validation of a histological scoring system for nonalcoholic fatty liver disease. Hepatology. 2005;41:1313–1321. doi: 10.1002/hep.20701. [DOI] [PubMed] [Google Scholar]
- 25.Donohue TM, Curry-McCoy TV, Todero SL, White RL, Kharbanda KK, Nanji AA, Osna NA. L-Buthionine (S,R) sulfoximine depletes hepatic glutathione but protects against ethanol-induced liver injury. Alcohol Clin Exp Res. 2007;31:1053–1060. doi: 10.1111/j.1530-0277.2007.00393.x. [DOI] [PubMed] [Google Scholar]
- 26.Bradford MM. A rapid and sensitive method for the quantitation of microgram quantities of protein utilizing the principle of protein-dye binding. Anal Biochem. 1976;72:248–254. doi: 10.1016/0003-2697(76)90527-3. [DOI] [PubMed] [Google Scholar]
- 27.Kharbanda KK. Role of transmethylation reactions in alcoholic liver disease. World J Gastroenterol. 2007;13:4947–4954. doi: 10.3748/wjg.v13.i37.4947. [DOI] [PMC free article] [PubMed] [Google Scholar]
- 28.Kharbanda KK, Barak AJ. Defects in methionine metabolism: Its role in ethanol-induced liver injury. In: Preedy VR, Watson RR, editors. Comprehensive handbook of alcohol-related pathology. San Diego, CA: Elsevier Academic Press, 2005: 735-747 In: Preedy VR, Watson RR, editors. [Google Scholar]
- 29.Kharbanda KK, Rogers DD, 2nd, Beckenhauer HC, Siford GL, Barak AJ, Mailliard ME, Sorrell MF, Tuma DJ. Adenosine-induced apoptosis mediated via increased hepatocellular levels of S-adenosylhomocysteine is attenuated by betaine administration. Hepatology. 2004;40:572A. [Google Scholar]
- 30.Kharbanda KK, Rogers DD, 2nd, Beckenhauer HC, Siford GL, Barak AJ, Mailliard ME, Sorrell MF, Tuma DJ. Tubercidin-induced apoptosis via increased hepatocellular levels of S-adenosylhomocysteine is attenuated by betaine administration. Alcohol Clin Exp Res. 2005;29:182A. [Google Scholar]
- 31.Kharbanda KK, Rogers DD, Mailliard ME, Siford GL, Barak AJ, Beckenhauer HC, Sorrell MF, Tuma DJ. A comparison of the effects of betaine and S-adenosylmethionine on ethanol-induced changes in methionine metabolism and steatosis in rat hepatocytes. J Nutr. 2005;135:519–524. doi: 10.1093/jn/135.3.519. [DOI] [PubMed] [Google Scholar]
- 32.Kharbanda KK, Todero SL, King AL, Osna NA, McVicker BL, Tuma DJ, Wisecarver JL, Bailey SM. Betaine treatment attenuates chronic ethanol-induced hepatic steatosis and alterations to the mitochondrial respiratory chain proteome. Int J Hepatol. 2012;2012:962183. doi: 10.1155/2012/962183. [DOI] [PMC free article] [PubMed] [Google Scholar]
- 33.Kharbanda KK, Todero SL, Ward BW, Cannella JJ, Tuma DJ. Betaine administration corrects ethanol-induced defective VLDL secretion. Mol Cell Biochem. 2009;327:75–78. doi: 10.1007/s11010-009-0044-2. [DOI] [PubMed] [Google Scholar]
- 34.Kharbanda KK, Vigneswara V, McVicker BL, Newlaczyl AU, Bailey K, Tuma D, Ray DE, Carter WG. Proteomics reveal a concerted upregulation of methionine metabolic pathway enzymes, and downregulation of carbonic anhydrase-III, in betaine supplemented ethanol-fed rats. Biochem Biophys Res Commun. 2009;381:523–527. doi: 10.1016/j.bbrc.2009.02.082. [DOI] [PMC free article] [PubMed] [Google Scholar]
- 35.Ji C, Kaplowitz N. Betaine decreases hyperhomocysteinemia, endoplasmic reticulum stress, and liver injury in alcohol-fed mice. Gastroenterology. 2003;124:1488–1499. doi: 10.1016/s0016-5085(03)00276-2. [DOI] [PubMed] [Google Scholar]
- 36.Dou X, Xia Y, Chen J, Qian Y, Li S, Zhang X, Song Z. Rectification of impaired adipose tissue methylation status and lipolytic response contributes to hepatoprotective effect of betaine in a mouse model of alcoholic liver disease. Br J Pharmacol. 2014;171:4073–4086. doi: 10.1111/bph.12765. [DOI] [PMC free article] [PubMed] [Google Scholar]
- 37.Deminice R, Portari GV, Vannucchi H, Jordao AA. Effects of creatine supplementation on homocysteine levels and lipid peroxidation in rats. Br J Nutr. 2009;102:110–116. doi: 10.1017/S0007114508162985. [DOI] [PubMed] [Google Scholar]
- 38.Deminice R, da Silva RP, Lamarre SG, Brown C, Furey GN, McCarter SA, Jordao AA, Kelly KB, King-Jones K, Jacobs RL, et al. Creatine supplementation prevents the accumulation of fat in the livers of rats fed a high-fat diet. J Nutr. 2011;141:1799–1804. doi: 10.3945/jn.111.144857. [DOI] [PubMed] [Google Scholar]
- 39.Deminice R, Vannucchi H, Simões-Ambrosio LM, Jordao AA. Creatine supplementation reduces increased homocysteine concentration induced by acute exercise in rats. Eur J Appl Physiol. 2011;111:2663–2670. doi: 10.1007/s00421-011-1891-6. [DOI] [PubMed] [Google Scholar]
- 40.Deminice R, Jordao AA. Creatine supplementation reduces oxidative stress biomarkers after acute exercise in rats. Amino Acids. 2012;43:709–715. doi: 10.1007/s00726-011-1121-x. [DOI] [PubMed] [Google Scholar]
- 41.Deminice R, Rosa FT, Franco GS, Jordao AA, de Freitas EC. Effects of creatine supplementation on oxidative stress and inflammatory markers after repeated-sprint exercise in humans. Nutrition. 2013;29:1127–1132. doi: 10.1016/j.nut.2013.03.003. [DOI] [PubMed] [Google Scholar]
- 42.Deminice R, de Castro GS, Francisco LV, da Silva LE, Cardoso JF, Frajacomo FT, Teodoro BG, Dos Reis Silveira L, Jordao AA. Creatine supplementation prevents fatty liver in rats fed choline-deficient diet: a burden of one-carbon and fatty acid metabolism. J Nutr Biochem. 2015;26:391–397. doi: 10.1016/j.jnutbio.2014.11.014. [DOI] [PubMed] [Google Scholar]
- 43.da Silva RP, Kelly KB, Leonard KA, Jacobs RL. Creatine reduces hepatic TG accumulation in hepatocytes by stimulating fatty acid oxidation. Biochim Biophys Acta. 2014;1841:1639–1646. doi: 10.1016/j.bbalip.2014.09.001. [DOI] [PubMed] [Google Scholar]
- 44.Ganesan M, Feng D, Barton RW, Thomes PG, McVicker BL, Tuma DJ, Osna NA, Kharbanda KK. Creatine supplementation does not prevent the development of alcoholic steatosis. Alcohol Clin Exp Res. 2016:In Press. doi: 10.1111/acer.13214. [DOI] [PubMed] [Google Scholar]
- 45.Wyss M, Kaddurah-Daouk R. Creatine and creatinine metabolism. Physiol Rev. 2000;80:1107–1213. doi: 10.1152/physrev.2000.80.3.1107. [DOI] [PubMed] [Google Scholar]
- 46.Kang L, Chen X, Sebastian BM, Pratt BT, Bederman IR, Alexander JC, Previs SF, Nagy LE. Chronic ethanol and triglyceride turnover in white adipose tissue in rats: inhibition of the anti-lipolytic action of insulin after chronic ethanol contributes to increased triglyceride degradation. J Biol Chem. 2007;282:28465–28473. doi: 10.1074/jbc.M705503200. [DOI] [PubMed] [Google Scholar]
- 47.Wei X, Shi X, Zhong W, Zhao Y, Tang Y, Sun W, Yin X, Bogdanov B, Kim S, McClain C, et al. Chronic alcohol exposure disturbs lipid homeostasis at the adipose tissue-liver axis in mice: analysis of triacylglycerols using high-resolution mass spectrometry in combination with in vivo metabolite deuterium labeling. PLoS One. 2013;8:e55382. doi: 10.1371/journal.pone.0055382. [DOI] [PMC free article] [PubMed] [Google Scholar]
- 48.Addolorato G, Capristo E, Greco AV, Stefanini GF, Gasbarrini G. Energy expenditure, substrate oxidation, and body composition in subjects with chronic alcoholism: new findings from metabolic assessment. Alcohol Clin Exp Res. 1997;21:962–967. [PubMed] [Google Scholar]
- 49.Addolorato G, Capristo E, Greco AV, Stefanini GF, Gasbarrini G. Influence of chronic alcohol abuse on body weight and energy metabolism: is excess ethanol consumption a risk factor for obesity or malnutrition? J Intern Med. 1998;244:387–395. doi: 10.1046/j.1365-2796.1998.00381.x. [DOI] [PubMed] [Google Scholar]
- 50.Kim JY, Hwang JY, Lee DY, Song EH, Park KJ, Kim GH, Jeong EA, Lee YJ, Go MJ, Kim DJ, et al. Chronic ethanol consumption inhibits glucokinase transcriptional activity by Atf3 and triggers metabolic syndrome in vivo. J Biol Chem. 2014;289:27065–27079. doi: 10.1074/jbc.M114.585653. [DOI] [PMC free article] [PubMed] [Google Scholar]
- 51.Kim JY, Song EH, Lee HJ, Oh YK, Park YS, Park JW, Kim BJ, Kim DJ, Lee I, Song J, et al. Chronic ethanol consumption-induced pancreatic {beta}-cell dysfunction and apoptosis through glucokinase nitration and its down-regulation. J Biol Chem. 2010;285:37251–37262. doi: 10.1074/jbc.M110.142315. [DOI] [PMC free article] [PubMed] [Google Scholar]
- 52.Rasineni K, K K, E. H, Casey C. Pancreas-adipose-liver axis: Role of Ghrelin and insulin in alcoholic fatty liver. Alcohol Clin Exp Res. 2015;39:51A. [Google Scholar]


