

Abstract
We found variants from the Angiotensinogen‐Converting Enzyme (ACE), Angiotensin Type 1 Receptor (AGTR1), Aldosterone Synthase (CYP11B2), and Adducin (ADD1) genes exhibited intensity‐dependent associations with the ambulatory blood pressure (BP) response following acute exercise, or postexercise hypotension (PEH). In a validation cohort, we sequenced exons from these genes for their associations with PEH. Obese (30.9 ± 3.6 kg m−2) adults (n = 23; 61% African Americans [AF], 39% Caucasian) 42.0 ± 9.8 years with hypertension (139.8 ± 10.4/84.6 ± 6.2 mmHg) completed three random experiments: bouts of vigorous and moderate intensity cycling and control. Subjects wore an ambulatory BP monitor for 19 h. We performed deep‐targeted exon sequencing using the Illumina TruSeq Custom Amplicon kit. Variant genotypes were coded as number of minor alleles (#MA) and selected for further statistical analysis based upon Bonferonni or Benjamini–Yekutieli multiple testing corrected p‐values under time adjusted linear models for 19 hourly BP measurements per subject. After vigorous intensity over 19 h among ACE,AGTR1,CYP11B2, and ADD1 variants passing multiple testing thresholds, as the #MA increased, systolic (SBP) and/or diastolic BP decreased 12 mmHg (P = 4.5E‐05) to 30 mmHg (P = 6.4E‐04) among AF only. In contrast, after moderate intensity over 19 h among ACE and CYP11B2 variants passing multiple testing thresholds, as the #MA increased, SBP increased 21 mmHg (P = 8.0E‐04) to 22 mmHg (P = 8.2E‐04) among AF only. In this replication study, ACE,AGTR1,CYP11B2, and ADD1 variants exhibited associations with PEH after vigorous, but not moderate intensity exercise among AF only. Renal variants should be explored further with a multi‐level “omics” approach for associations with PEH among a large, ethnically diverse sample of adults with hypertension.
Keywords: Blood pressure, exercise, hypertension, polymorphism
Introduction
High blood pressure (BP) is the leading risk factor for global disease burden (GBD 2013 Risk Factors Collaborators et al. 2015). The inherited tendency towards hypertension predominately resides in the kidneys via the regulation of fluid and electrolyte balance (Arnett et al. 2007; Padmanabhan et al. 2012; Basson et al. 2014; Reiter et al. 2015). Pharmacogenetic studies have identified variants in the renin‐angiotensin system (RAS) and other renal functional variants to alter the BP response to antihypertensive drug treatment (Maitland‐van der Zee et al. 2005; Su et al. 2007; Bozkurt et al. 2008; Konoshita and Genomic Disease Outcome Consortium (G‐DOC) Study Investigators 2011; Turner et al. 2012; Do et al. 2016). Aerobic exercise training lowers BP 5–7 mmHg among those with high BP, reductions that rival those with many first‐line antihypertensive medications (ALLHAT Officers and Coordinators for the ALLHAT Collaborative Research Group. The Antihypertensive and Lipid‐Lowering Treatment to Prevent Heart Attack Trial 2002, Brown et al. 2013). Thus, regular exercise participation is universally recommended as first‐line antihypertensive lifestyle therapy (Pescatello et al. 2015a,b).
We and others have proposed that the BP reductions attributed to aerobic exercise training are largely the result of the BP response to acute aerobic exercise, or postexercise hypotension (PEH) (Fitzgerald 1981; Wilcox et al. 1982; Pescatello et al. 1991, 2004a; Haskell 1994; Halliwill 2001; Pescatello and Kulikowich 2001; Thompson et al. 2001; Collier et al. 2008). PEH is the immediate reduction in BP that occurs after an isolated exercise session and persists for up to 24 h after exercise (Kenney and Seals 1993; Pescatello et al. 2004a, 2015b). Postexercise hypotension is of similar magnitude to the BP reductions that result from exercise training (Meredith et al. 1990; Jennings et al. 1991; Pescatello and Kulikowich 2001; Murray et al. 2006; Moker et al. 2014), and strongly correlated with the BP response to exercise training (Liu et al. 2012; Hecksteden et al. 2013; Tibana et al. 2015). Due to their biological, functional, and clinical relevance, genetic variants that associate with hypertension, renal function, and the BP response to pharmacotherapy and/or exercise training are logical candidates to explore for their associations with PEH (Bouchard 2011; Ash et al. 2013a).
We completed a series of studies investigating the role of renal polymorphisms reported to be associated with hypertension (Arnett et al. 2007; Padmanabhan et al. 2012; Basson et al. 2014; Reiter et al. 2015) and the BP response to pharmacotherapy (Maitland‐van der Zee et al. 2005; Su et al. 2007; Bozkurt et al. 2008; Konoshita and Genomic Disease Outcome Consortium (G‐DOC) Study Investigators 2011; Turner et al. 2012; Do et al. 2016) and/or exercise training (Kohno et al. 1997; Krizanova et al. 1998; Hagberg et al. 1999; Rankinen et al. 2000; Jones et al. 2006, 2007) for their associations with PEH (Blanchard et al. 2006; Pescatello et al. 2007, 2008; Ash et al. 2013a). In these candidate gene association studies, we found that Angiotensin 1 Converting Enzyme (ACE) rs4646994, Angiotensin II Type 1 Receptor (AGTR1) rs5186, and Aldosterone Synthase (CYP11B2) rs1799998 from the RAS, and Adducin 1 (ADD1) rs4961, a renal structural variant, exhibited intensity‐dependent associations with PEH among 50 Caucasian men with pre‐ to Stage 1 hypertension. We recently conducted a meta‐analysis of candidate gene association studies examining the BP response to acute (i.e., PEH) and chronic (i.e., training) aerobic exercise and found that Angiotensiogen (AGT) rs699 emerged as the only promising variant to explore further (Bruneau et al. 2015). This finding substantiates a major concern of candidate gene association studies that examine the response of health‐related phenotypes to exercise; that is, most statistically significant findings fail to replicate due to a variety of factors that include the lack of standardized protocols, statistical adjustments for multiple comparisons, and adequately powered samples (Bouchard 2011; Bouchard et al. 2012; Ash et al. 2013a; Bruneau et al. 2015; Mattsson et al. 2016).
Utilizing advances in genomic technology that emerged since undertaking our discovery phase PEH candidate gene association studies, we performed deep‐targeted exon sequencing of ACE, AGT, AGTR1, CYP11B2, and ADD1 to determine if they harbored polymorphisms associated with PEH in a validation cohort.
Materials and Methods
Overview
We employed the identical study design used in our discovery phase PEH studies that is overviewed in Figure 1 (Pescatello et al. 1991, 2004b, 2007, 2008; Blanchard et al. 2006; Eicher et al. 2010). At an orientation session, subjects (n = 23) provided a blood sample for deep‐targeted exon sequencing and a fasting cardiometabolic health profile. They left the laboratory wearing an ambulatory BP monitor until the next morning to acquaint them with wearing the technology (Ash et al. 2013b). Subjects then completed three randomly assigned acute experiments: a cardiopulmonary graded exercise test (GEST) on a cycle ergometer to obtain peak oxygen consumption (VO2peak) (VIGOROUS); 30 min of cycling at 60% VO2peak (MODERATE); and a 30 min control session of seated rest (CONTROL). We measured BP for 20 min before and 45 min after the acute experiments. Subjects then left the laboratory wearing an ambulatory BP monitor over 19 h until the next morning.
Figure 1.

Study design overview. ABP, ambulatory blood pressure worn until the next morning; VO 2peak, peak oxygen consumption as determined on the peak cardiopulmonary graded exercise stress test.
Subjects
Sedentary, defined as exercising ≤2 days per week, who were 18–55 years with pre‐ to stage 1 hypertension and a body mass index (BMI) ≥25 to <40 kg·m−2 were enrolled. Any medications that could potentially influence BP including inhaled or oral steroids, nonsteroidal anti‐inflammatory agents, aspirin, antihypertensive and hyperlipidemic medications, nutritional supplements besides one‐a‐day vitamin, cold medications, hormone‐altering contraception, or herbal supplements were stopped at least 4 weeks prior to testing. Subjects with osteoarthritis and orthopedic problems were not recruited if these conditions compromised their ability to complete the acute exercise experiments. Two participants with mild hypertension discontinued their antihypertensive medications with physician permission ≥6 weeks prior to study participation. Women were premenopausal and regularly menstruating. Subjects remained weight stable throughout study participation, defined as gaining or losing <2.25 kg of orientation body weight. Participants completed an informed consent approved by the Institutional Review Boards of the two participating sites.
Body composition
Body mass index (kg·m−2) was calculated from body weight and height using a calibrated balance beam scale. Waist circumference was measured at the narrowest part of the torso using a nondistensible Guilick tape measure (Pescatello et al. 2013).
Blood pressure
Blood pressure (BP) was measured using an automated BPTRU monitor (BPTRU Medical Devices; Coquitlam, Canada) according to American Heart Association standards (Pickering et al. 2005) at the orientation session to determine BP status. BP was also measured before the acute experiments every 2 min for 20 min in the nondominant arm with the automated BPTRU monitor and averaged as baseline BP. After the orientation session and the three experiments (i.e., CONTROL, MODERATE, VIGOROUS) using our standardized protocols (Pescatello et al. 1991, 2004b, 2007, 2008; Blanchard et al. 2006; Eicher et al. 2010), subjects were attached to the same Oscar2 ambulatory BP monitor (Oscar2 automatic noninvasive ambulatory BP monitor, Suntech Medical Instruments Inc., Raleigh, NC) calibrated to a mercury sphygmomanometer.
Subjects proceeded with normal daily activities and no formal exercise while the monitor recorded three ambulatory BP assessments per waking hour and two per sleep over 19 h. Subjects carried a journal, recording activities performed during each measurement, any unusual physical or emotional events, and their awake and sleep hours. We omitted ambulatory BP readings of systolic BP (SBP) >220 or <80 mmHg, or diastolic BP (DBP) >130 or <40 mmHg according to the manufacturer's exclusion criteria. Computerized ambulatory BP reports were acceptable if at least 80% of the potential BP readings were obtained. Ambulatory arterial stiffness index was calculated after CONTROL as 1 − (slope of DBP vs. SBP over 19 h) (Dolan et al. 2006).
Acute experiments
Participants completed three randomly assigned acute experiments: a nonexercise control session of seated rest (CONTROL) and two cycle exercise bouts on an upright cycle ergometer (Monarch 839E Digital Cycle Ergometer, Stockholm, Sweden) at 60% VO2peak (MODERATE) and 100% VO2peak (VIGOROUS) (Fig. 1). All experiments were conducted at the same time of day to account for diurnal variation in BP, separated by a minimum of 48 h to avoid acute exercise effects, and completed within 1 month of beginning study participation. The same investigator measured heart rate (HR), SBP, and DBP for each subject and experiment. Subjects sat quietly for a 20 min baseline period at the start of each experimental session. During the baseline period, HR was recorded using a HR monitor (Polar Electro Inc., Port Washington, NY) every 2 min, whereas SBP and DBP were measured every other minute by auscultation. Each experiment was followed by a 45 min recovery period in the seated position with BP and HR measured every 2 min. Subjects were attached to the ambulatory BP monitor after the experiments until waking the next morning.
VIGOROUS (100% VO2peak) consisted of a peak cardiopulmonary GEST. VO2peak was determined by breath‐by‐breath analysis of expired gases (ParvoMedicsTrueOne® 2400 Metabolic Measurement System, ParvoMedics Inc., Sandy, UT). The GEST began with a resistance of 0.5 kp (30 W) and consisted of continuous cycling at a constant cadence (60 rev·min−1) with the resistance increased 0.5 kp every 2 min until volitional exhaustion. During the GEST, HR was recorded continuously with a 12‐lead electrocardiograph system (Marquette Case 8000, Jupiter, FL), and BP was measured every 2 min by auscultation. Results of the peak cardiopulmonary GEST (VIGOROUS) were used to calculate the workload of the other acute exercise experiment (MODERATE). Each volunteer performed the two remaining experiments in random order: nonexercise control and MODERATE (60% VO2peak). CONTROL was a 30 min session of seated rest. MODERATE consisted of a 5 min warm‐up of free‐wheeling with no resistance, 20 min of cycling at 60% VO2peak, and a 5 min cool down period to total 30 min. HR, SBP, and DBP were measured every 5 min during nonexercise control and MODERATE.
Blood sampling and analysis
During the orientation session, fasting blood samples were drawn without stasis from an antecubital vein and centrifuged at 3400 × g at 23°C for 10–15 min. Serum and plasma samples were drawn in red top and EDTA vacutainer tubes, respectively. Serum and plasma samples were aliquoted into separate 1.8 mL nonpyrogenic storage tubes and frozen at −80°C until analysis. Glucose and insulin were determined by enzymatic/spectrophotometric methods. Homeostatsis model assessment, an indicator of insulin resistance, was then calculated (Matthews et al. 1985). Total cholesterol, triglycerides, and high‐density lipoprotein cholesterol were determined by enzymatic/spectrophometric assays, and low‐density lipoprotein cholesterol calculated with the Friedewald equation (Friedewald et al. 1972). Nitrite (NO2 −)/Nitrate (NO3 −), high sensitivity C‐reactive protein (CRP), endothelin 1–21, and plasma renin activity (PRA) were detected by enzymatic/spectrophotometric methods. Analyses were performed with two levels of quality control material. A blood sample for DNA was drawn in an EDTA purple top vacutainer tube that was centrifuged for white cell isolation and frozen at −80°C until DNA extraction.
Targeted sequencing and variant calling
We then performed deep‐targeted exon sequencing of a prioritized panel of 41 genes that harbored polymorphisms reported to be associated with hypertension, the BP response to pharmacotherapy, and/or the BP response to PEH and exercise training (Ash et al. 2013a; Bruneau et al. 2015) using the Illumina TruSeq Custom Amplicon kit (Catalog# FC‐130‐1001, Illumina, San Diego, CA) (see Supplement Material for the prioritized panel of genes). The Illumina DesignStudio software was used to create probes for the generation of 1214 amplicons with a size range 225–275 bp. The TruSeq Custom Amplicon manifest file associated with this panel included Target ID, region, chromosome, and start and end hg19 reference coordinate positions. Sequencing libraries were prepared following the TruSeq Custom Amplicon Library Preparation Guide. DNA input mass for all libraries was 250 ng of DNA. Libraries were generated with dual indices (23 PCR cycles), followed by normalization and pooling. The library amplicon pool was sequenced using Illumina MiSeq version 2 reagents (250 paired‐end reads). 7.1 million pair‐end reads (6.8 million passing quality filter) were produced from the library amplicon pool. MiSeq Reporter Software (version 2.3.32), using the TruSeq Amplicon workflow was used to generate Fastq files and align reads to the hg19 human reference sequence using the Smith‐Waterman algorithm. Genome Analysis Toolkit (GATK) was use for variant calling (single‐nucleotide polymorphisms and small insertion/deletions) and the generation of variant calling files (VCF). For all further downstream analysis, a merged VCF was generated using VCFtools v 0.1.12b (Danecek et al. 2011) and custom R scripts (R v3.2.0). Only variants with FILTER = PASS were retained. For each defined amplicon target region, we calculated the total number of variants present per subject and each polymorphism's major and minor allele frequency for each subject.
Statistical analysis
Descriptive statistics (Mean ± SD) were generated on study variables for the total sample and by ethnic group. Independent t‐tests determined if there were differences in subject descriptive characteristics between ethnic groups. Repeated measures analysis of covariance compared the BP response, defined as the change from baseline following exercise – change from baseline following control, at hourly intervals under ambulatory conditions with age and BMI as covariates and gender and ethnicity as fixed factors over 19 h. These statistical analyses were performed with SPSS 14.0 (Chicago, IL).
Renal variant screening
Variant genotypic values were coded as the number of minor alleles (#MA). Genotypic values for 645 variants from the 41 genes were analyzed (see Supplemental Material for the prioritized gene panel and variants that were exon sequenced). For each polymorphism, we fit a linear model for each race/ethnicity separately that included polynomial time (order 3), polymorphism under an additive model, and polymorphism x time interactions as covariates; the dependent variable, BP response, was defined as the change from baseline following exercise – change from baseline following control. Since there are 19 observations per subject (i.e., n = 9 Caucasians × 19 h = 171 observations; n = 14 African Americans [AF] × 19 h = 266 observations), we assumed a first‐order autoregressive (AR1) correlation structure. Residual errors within each subject are therefore correlated, but were independent across subjects. Bonferroni and Benjamini–Yekutieli (BY) (Benjamini and Yekutieli 2005) adjusted p‐values were calculated for each polymorphism, correcting for the total number of unique polymorphism profiles among the corresponding racial/ethnic group resulting in 300 polymorphisms for AF and 146 for Caucasians. Polymorphisms with Bonferroni adjusted P‐values <0.05 and/or BY adjusted P‐values <0.20 were identified; renal polymorphisms from our discovery phase PEH candidate gene association studies achieving these multiple testing thresholds were then considered for further statistical modeling and analysis. Renal genotype‐BP differences by the #MA after VIGOROUS and MODERATE compared to CONTROL are reported as the average change over 19 h with the associated p value resulting from the screening model that accounted for repeated measures over time.
Final multivariable regression models
For each renal polymorphism passing the multiple testing threshold, we selected model effects (i.e., covariates, order of time polynomial, additive versus dominant/recessive genetic models) and within‐subject correlation structure based on models fit with maximum likelihood (ML) using Akaike Information Criteria and likelihood ratio tests (LRT). Covariates that were marginally associated (P < 0.05) with the BP response were eligible to be included in the final models. Possible within subject correlation structures included compound symmetry, AR1, and independent structures, however, AR1 provided the best fit in all cases. On the basis of ML estimation using AR1 within‐subject correlation structure, we report the LRT p‐values and pseudopartial R‐squared measures (i.e., the partial proportion of variation explained [PVE]) for the polymorphism effects. We defined the PVE for a given model using the pseudo‐R‐squared measure R 2 m = 1 − (L R/L U)2/n, where L R is the restricted maximized likelihood from a model containing only an intercept, L U is the unrestricted maximized likelihood for the given model, and n is the number of subjects (Maddala 1983; Magee 1990). The partial PVE for each polymorphism was the difference between R 2 m for the final model (including the covariate and polymorphism effects) and R 2 m for a model with polymorphism effect(s) excluded (Schemper 1993). We also report the parameter estimates for the final models, obtained using the restricted maximum likelihood (REML) method. Statistical analysis was performed in R (screening) and SAS version 9.4 (final models).
Combined annotation‐dependent depletion
For each polymorphism that passed the multiple testing threshold, we determined the combined annotation‐dependent depletion (CADD) score from www.cadd.gs.washington.edu (Kircher et al. 2014). CADD scores quantitatively prioritize functional, deleterious, and disease causal variants across a wide range of functional categories, effect sizes, and genetic architectures. The higher the CADD score, the more severe is the allelic substitution in terms of its causal variation and regulatory effects. CADD scores of ≥10 indicate that substitutions in a given polymorphism are predicted to be the 10% most deleterious substitutions in the human genome.
Results
Subjects
Subjects (n = 23) were middle‐aged, obese Caucasian men (39%) and AF (61%) men (n = 10) and women (n = 4) with hypertension (Table 1). Only 22.2% of the Caucasians reported a family history of hypertension, whereas 64.3% of the AF did (P = 0.049). The overall cardiometabolic health profile of the AF was more favorable than the Caucasians; however, only waist circumference (P = 0.015), total cholesterol (P = 0.027), and triglycerides (P = 0.003) achieved statistical significance between ethnic groups. Reference ranges indicated that on average NO2 −/NO3 − (Ghasemi et al. 2010) were low among AF and normal‐high among Caucasians; CRP was high among AF and Caucasians (http://lsplinks.net/QUESTCRP); and endothelin (http://lsplinks.net/ALPCOBig) and PRA (Brossaud and Corcuff 2009) were normal among AF and Caucasians.
Table 1.
Subject characteristics (X ± SD)
| Variable | Caucasians (n = 9) | African Americans (n = 14) |
|---|---|---|
| Age (year) | 45.1 ± 7.8 | 39.9 ± 10.6 |
| Body mass index (kg·m−2) | 30.5 ± 1.8 | 31.1 ± 4.5 |
| Waist circumference (cm) | 98.0 ± 7.2 | 88.3 ± 9.4* |
| Relative peak oxygen consumption (mL·kg−1·min−1) | 29.7 ± 6.4 | 25.3 ± 5.7 |
| Awake systolic blood pressure (mmHg) | 139.3 ± 7.0 | 140.2 ± 12.3 |
| Awake diastolic blood pressure (mmHg) | 85.0 ± 5.1 | 84.3 ± 6.9 |
| Glucose (mg·dL−1) | 96.4 ± 12.2 | 97.2 ± 10.3 |
| Ambulatory arterial stiffness index | 0.415 + 0.930 | 0.391 + 0.143 |
| Insulin (μIU·mL−1) | 13.1 ± 10.1 | 9.4 ± 6.0 |
| Homeostatic model of assessment | 3.1 ± 2.2 | 2.3 ± 1.5 |
| Total cholesterol (mg·dL−1) | 207.8 ± 31.3 | 178.5 ± 27.3* |
| Low‐density lipoproteins (mg·dL−1) | 129.4 ± 20.3 | 108.3 ± 32.7 |
| High‐density lipoproteins (mg·dL−1) | 44.1 ± 10.9 | 53.9 ± 14.8 |
| Triglycerides (mg·dL−1) | 170.8 ± 88.8 | 83.7 ± 35.8** |
| Nitrite (NO2 −)/Nitrate (NO3 −) (μmol·L−1) | 23.3 ± 37.0 | 10.9 ± 13.1 |
| C‐reactive protein (mg·dL−1) | 1.1 ± 1.0 | 2.8 ± 3.5 |
| Endothelin (pmol·L−1) | 0.222 ± 0.213 | 0.378 ± 0.663 |
| Plasma renin activity (ng·mL−1·h−1) | 1.7 ± 1.1 (n = 2) | 0.946 ± 0.840 (n = 8) |
*P < 0.05; **P < 0.01.
Blood pressure response
Overall
Among the total sample, the SBP and DBP responses over 19 h were not different after VIGOROUS (SBP/DBP, −0.7 ± 13.4/−0.6 ± 7.7 mmHg) or MODERATE (−3.1 ± 8.0/−2.5 ± 5.7 mmHg) compared to control (P > 0.05) (Fig. 2). Furthermore, the SBP and DBP responses over 19 h were not different between Caucasians versus AF after VIGOROUS (SBP/DBP, 0.6 ± 10.1/−0.2 ± 5.3 mmHg versus −1.5 ± 15.5/−0.9 ± 9.1 mmHg) or MODERATE (−3.0 ± 6.6/−1.6 ± 5.2 mmHg versus −3.2 ± 9.0/−3.0 ± 6.1 mmHg), respectively, (P > 0.05).
Figure 2.
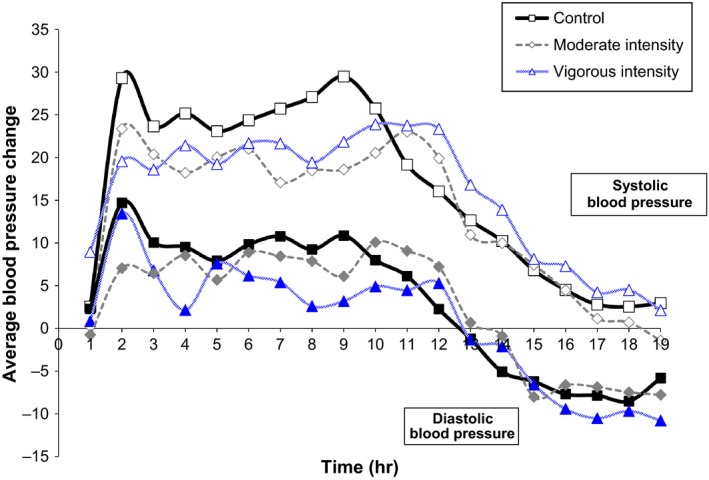
The average change in ambulatory systolic and diastolic blood pressure from baseline after aerobic exercise versus control at hourly intervals over 19 h. CONTROL, nonexercise session of seated rest; MODERATE, 60% VO 2peak; VIGOROUS, VO 2peak; P > 0.05 exercise versus nonexercise control.
By number of renal variant minor alleles
When the SBP and DBP responses over 19 h after VIGOROUS and MODERATE compared to control were examined by renal variant #MA, a very different scenario emerged regarding the BP response between the ethnic groups versus the overall BP response. After VIGOROUS, as the #MA increased from 0 to 1 or 2 depending on the variant, systolic (SBP) and/or diastolic (DBP) BP decreased after exercise versus control over 19 h (Table 2). For, ACE rs1055086, SBP decreased by −24.5 mmHg (P = 3.98E‐06) and DBP decreased by −16.3 mmHg (P = 1.04E‐07); AGTR1 rs74662294, SBP decreased by −30.4 mmHg (P = 6.4E‐04) and DBP decreased by −20.3 mmHg (P = 9.73E‐05); CYP11B2 rs4546, DBP decreased by −22.5 mmHg (P = 4.91E‐05); CYP11B2 rs4537, SBP decreased by −30.4 mmHg (P = 6.4E‐04) and DBP decreased by −20.3 mmHg (9.73E‐05); ADD1 rs16843169, SBP decreased by −20.4 mmHg (P = 2.0E‐03); and ADD1 rs6833874, SBP decreased by −19.5 mmHg (P = 1.96E‐04) and DBP decreased by −12.2 mmHg (P = 4.5E‐05) among AF but not Caucasians. In contrast, after MODERATE, as the #MA increased from 0 to 1 or 2 depending on the variant, SBP increased after exercise versus control over 19 h (Table 3). For, ACE rs3730036, SBP increased by 20.8 mmHg (P = 8.0E‐04); CYP11B2 rs6432, SBP increased by 20.8 mmHg (P = 8.0E‐04); and CYP11B2 rs3802228, SBP increased by 21.6 mmHg (P = 8.2E‐04) among AF but not Caucasians.
Table 2.
The blood pressure response (X ± SD)1 after versus before VIGOROUS exercise compared to control over 19 h by # of Minor Alleles and Racial/Ethnic Group
| Gene name (Gene symbol) | Chromosome (Chr) location | Variant | Function | CADD score | African Americans (n = 14) | Caucasians (n = 9) | ||||
|---|---|---|---|---|---|---|---|---|---|---|
| # Minor Alleles | SBP | DBP | # Minor Alleles | SBP | DBP | |||||
| Angiotensinogen Converting Enzyme (ACE) | Chr17q23.3 | rs1055086 | 3′ UTR | NA |
0 (n = 11) 1 (n = 3) 2 (n = 0) |
3.7 ± 10.1
−20.8 ± 18.2 NA |
2.6 ± 5.5
−13.7 ± 8.4 NA |
0 (n = 4) 1 (n = 3) 2 (n = 2) |
2.0 ± 6.5 −1.6 ± 15.3 1.0 ± 14.1 |
−0.3 ± 3.8 0.4 ± 7.0 −0.8 ± 9.3 |
| Angiotensin Type 1 Receptor (AGTR1) | Chr3q24 | rs74662294 | Intronic/Intergenic/Upstream | 9.038 |
0 (n = 13) 1 (n = 1) 2 (n = 0) |
0.6 ± 13.7
−30.0 ± NA NA |
0.6 ± 7.6
−19.7 ± NA NA |
0 (n = 9) 1 (n = 0) 2 (n = 0) |
0.6 ± 10.1 NA NA |
−0.2 ± 5.4 NA NA |
| Aldosterone Synthase (CYP11B2) | Chr8p24.3 | rs4546* | Synonymous/Coding Transcript | 1.736 |
0 (n = 8) 1 (n = 5) 2 (n = 1) |
2.3 ± 10.5 −1.9 ± 18.9 −29.8 ± NA |
2.8 ± 5.2
−3.0 ± 10.0 −19.7 ± NA |
0 (n = 4) 1 (n = 3) 2 (n = 2) |
−2.3 ± 5.6 −2.6 ± 14.8 11.1 ± 0.2 |
1.6 ± 6.5 −3.0 ± 2.1 0.5 ± 7.5 |
| rs72552275 | Synonymous/Coding Transcript | 1.736 | ||||||||
| rs4539 | Missense/Coding Transcript | 0.001 | ||||||||
| rs4537 | Missense/Coding Transcript | 0.001 |
0 (n = 13) 1 (n = 1) 2 (n = 0) |
0.6 ± 13.7
−29.8 ± NA NA |
0.6 ± 7.8
−19.7 ± NA NA |
0 (n = 9) 1 (n = 0) 2 (n = 0) |
0.6 ± 10.1 NA NA |
−0.2 ± 5.4 NA NA |
||
| Adducin (ADD1) | Chr4p16.3 | rs16843169* | Synonymous/Coding Transcript | 13.93 |
0 (n = 12) 1 (n = 2) 2 (n = 0) |
1.4 ± 14.0
−19.0 ± 15.2 NA |
0.1 ± 7.7 −6.6 ± 18.5 NA |
0 (n = 9) 1 (n = 0) 2 (n = 0) |
0.6 ± 10.1 NA NA |
−0.2 ± 5.4 NA NA |
| rs4969 | 3′ UTR/Intergenic/Downstream | 4.696 | ||||||||
| rs36038921 | 3′ UTR/Intergenic | 0.112 | ||||||||
| rs4741 | 3′ UTR/Intergenic/Downstream | 0.298 | ||||||||
| rs6833874* | Intronic/Transcript | 2.195 | 0 (n = 10) | 4.1 ± 10.6 | 2.6 ± 6.0 | 0 (n = 9) | 0.6 ± 10.1 | −0.2 ± 5.4 | ||
| rs4966 | 3′ UTR/Intergenic/Downstream | 1.77 | 1 (n = 4) | −15.5 ± 18.4 | −9.8 ± 10.4 | 1 (n = 0) | NA | NA | ||
| 2 (n = 0) | NA | NA | 2 (n = 0) | NA | NA | |||||
Chromosome location and function obtained from SNAP, SNP Annotation and Proxy Search www.broadinstitute.org/mpg/snap/ldsearch.php; CADD, Combined Annotation‐Dependent Depletion, a score that prioritizes causal variation and regulatory effects www.cadd.gs.washington.edu; SBP, Systolic Blood Pressure; DBP, Diastolic Blood Pressure; UTR, Untranslated Region; NA, Not Available; *Multiple variants with the same # minor allele values.
1X and SD are computed as the average and standard deviation, respectively, of the subject‐level BP response averaged over 19 h. Bolded values correspond to significant effects after multiple testing adjustment.
Table 3.
The blood pressure response (X ± SD)1 after versus before MODERATE compared to control over 19 h by # of Minor Alleles and Racial/Ethnic Group
| Gene name (Gene symbol) | Chromosome (Chr) location | Variant | Function | CADD score | African Americans (n = 14) | Caucasians (n = 9) | ||||
|---|---|---|---|---|---|---|---|---|---|---|
| # Minor Alleles | SBP | DBP | # Minor Alleles | SBP | DBP | |||||
| Angiotensinogen Converting Enzyme (ACE) | Chr17q23.3 | rs3730036* | Synonymous/Missense/Coding Transcript | 17.2 |
0 (n = 13) 1 (n = 1) 2 (n = 0) |
−4.7 ± 7.3
16.1 ± NA NA |
−3.5 ± 6.0 3.9 ± NA NA |
0 (n = 9) 1 (n = 0) 2 (n = 0) |
−3.0 ± 6.6 NA NA |
−1.6 ± 5.2 NA NA |
| rs3730038 | Intronic/Transcript | 1.614 | ||||||||
| rs3730042 | Intronic/Transcript | 1.834 | ||||||||
| rs28730840 | Intronic/Transcript | 3.486 | ||||||||
| Aldosterone Synthase (CYP11B2) | Chr8p24.3 | rs6432* | Intronic/Regulatory | 0.38 |
0 (n = 13) 1 (n = 1) 2 (n = 0) |
−4.7 ± 7.3
16.1 ± NA NA |
−3.5 ± 6.0 3.9 ± NA NA |
0 (n = 8) 1 (n = 1) 2 (n = 0) |
−2.6 ± 6.9 −6.6 ± NA NA |
−2.1 ± 5.4 1.9 ± NA NA |
| rs72499120 | 3′ UTR/Intronic/Transcript | 0.225 | ||||||||
| rs4545 | Missense/Coding Transcript | 0.22 | ||||||||
| rs4536 | Synonymous | NA | ||||||||
| rs3802228* | 3′ UTR | NA | 0 (n = 11) | −5.5 ± 7.3 | −3.9 ± 6.4 | 0 (n = 2) | 1.6 ± 11.4 | −1.7 ± 11.6 | ||
| rs7463212 | Downstream | NA | 1 (n = 2) | −0.5 ± 8.3 | −1.5 ± 2.7 | 1 (n = 4) | −4.5 ± 7.1 | −2.9 ± 4.5 | ||
| 2 (n = 1) | 16.8 ± NA | 3.9 ± NA | 2 (n = 3) | −4.1 ± 2.3 | 0.1 ± 1.6 | |||||
Chromosome location and function obtained from SNAP, SNP Annotation and Proxy Search www.broadinstitute.org/mpg/snap/ldsearch.php; CADD, Combined Annotation‐Dependent Depletion, a score that prioritizes causal variation and regulatory effects www.cadd.gs.washington.edu; SBP, Systolic Blood Pressure; DBP, Diastolic Blood Pressure; UTR, Untranslated Region; NA, Not Available; *Multiple variants with the same # minor allele values.
1X and SD are computed as the average and standard deviation, respectively, of the subject‐level BP response averaged over 19 h. Bolded values correspond to significant effects after multiple testing adjustment.
Proportion of variance explained
Table 4 contains the PVE for the SBP and DBP response to VIGOROUS and MODERATE among AF for the final multivariable regression models without the renal variants, and the partial PVE for each renal polymorphism after accounting for the other covariates in the model. For the SBP response to VIGOROUS, resting ambulatory SBP over 19 h, age, resting ambulatory arterial stiffness index over 19 h, and time (order 3) accounted for 92.5% of the variation. When the other covariates in the model were accounted for, the individual renal variants explained an additional 2.6% (P = 0.0143) to 5.8% (P < 0.0001) of the variation. For the DBP response to VIGOROUS, fasting triglycerides, gender, and endothelin accounted for 85.8% of the variation. When the other covariates in the model were accounted for, the individual renal variants explained an additional 3.6% (P = 0.0429) to 7.6% (P = 0.0011) of the variation. For the SBP response to MODERATE, insulin accounted for 66.2% of variation. When insulin was accounted for, the individual renal variants explained an additional 6.9% (P = 0.0736) to 8.6% (P = 0.0429) of the variation.
Table 4.
The proportion of variance explained in the multivariable regression models for the systolic and diastolic blood pressure response following VIGOROUS and MODERATE among African Americans
| VIGOROUS | ||||
| SBP | ||||
| Gene | Polymorphism | Model1 | PVE2 | P value3 |
| None | None | BP response = −1.7872 + 2.1590*time + 0.0207*time^2 − 0.0320*time^3 + 16.4343*log(AASICONT) + 0.6782*Orientation 19 h SBP + 0.5765*Age | 0.9252 | – |
| Gene | Polymorphism | Model1 | Partial PVE2 | P value3 |
| ACE | rs1055086 | BP response = 2.5653 + 2.1353*time + 0.0076*time^2 − 0.0315*time^3 + 11.2080*log(AASICONT) + 0.6832*Orientation 19 h SBP + 0.4349*Age − 18.8394*SNP | 0.0581 | <0.0001 |
| AGTR1 | rs74662294 | BP response = −0.2841 + 1.5349*time + 0.0091*time^2 − 0.0210*time^3 + 11.1560*log(AASICONT) + 0.6298*Orientation 19 h SBP + 0.5368*Age − 18.5855*SNP + 8.5552*SNP*time + .0618*SNP*time^2 − 0.1505*SNP*time^3 | 0.0562 | 0.0006 |
| CYP11B2 | rs4546 | BP response = 2.3621 + 0.8792*time + 0.0024*time^2 − 0.0104*time^3 + 12.8728*log(AASICONT) + 0.6632*Orientation 19 h SBP + 0.5562*Age − 8.0779*SNP + 2.5435*SNP*time + 0.0276*SNP*time^2 − 0.0427*SNP*time^3 | 0.0457 | 0.0103 |
| CYP11B2 | rs45464 | BP response = −0.2841 + 1.5349*time + 0.0091*time^2 − 0.0210*time^3 + 11.1560*log(AASICONT) + 0.6298*Orientation 19 h SBP + 0.5368*Age − 18.5855*SNPr + 8.5552*SNPr*time + 0.0618*SNPr*time^2 − 0.1505*SNPr*time^3 | 0.0562 | 0.0006 |
| CYP11B2 | rs4537 | BP response = −0.2841 + 1.5349*time + 0.0091*time^2 − 0.0210*time^3 + 11.1560*log(AASICONT) + 0.6298*Orientation 19 h SBP + 0.5368*Age − 18.5855*SNP + 8.5552*SNP*time + 0.0618*SNP*time^2 − 0.1505*SNP*time^3 | 0.0562 | 0.0006 |
| ADD1 | rs16843169 | BP response = 0.3502 + 1.2629*time − 0.0114*time^2 − 0.0164*time^3 + 13.6612*log(AASICONT) + 0.5605*Orientation 19 h SBP + 0.6071*Age − 14.0158*SNP + 6.2030*SNP*time + 0.1861*SNP*time^2 − 0.1079*SNP*time^3 | 0.0520 | 0.0023 |
| ADD1 | rs6833874 | BP response = 1.2998 + 2.1528*time + 0.0172*time^2 − 0.0318time^3 + 12.5206*log(AASICONT) + 0.5062*Orientation 19 h SBP + 0.5701*Age − 10.5065*SNP | 0.0261 | 0.0143 |
| DBP | ||||
| Gene | Polymorphism | Model1 | PVE2 | P value3 |
| None | None | BP response = −3.1187 − 4.3889*log(Endothelin) − 8.5055*log(TRIG) + 7.6938*Gender | 0.8577 | – |
| Gene | Polymorphism | Model1 | Partial PVE2 | P value3 |
| ACE | rs1055086 | BP response = −0.6785 − 2.6365*log(Endothelin) − 8.8759*log(TRIG) + 2.6364*Gender − 10.9469*SNP | 0.0608 | 0.0052 |
| AGTR1 | rs74662294 | BP response = −1.7776 − 4.0777*log(Endothelin) − 5.5915*log(TRIG) + 6.8446*Gender − 15.2493*SNP | 0.0760 | 0.0011 |
| CYP11B2 | rs4546 | BP response = 0.5261 − 3.9426*log(Endothelin) − 6.4122*log(TRIG) + 5.8313*Gender − 6.2073*SNP | 0.0741 | 0.0013 |
| CYP11B2 | rs45464 | BP response = −1.7776 − 4.0777*log(Endothelin) − 5.5915*log(TRIG) + 6.8446*Gender − 5.2493*SNPr | 0.0760 | 0.0011 |
| CYP11B2 | rs4537 | BP response = −1.7776 − 4.0777*log(Endothelin) − 5.5915*log(TRIG) + 6.8446*Gender − 15.2493*SNP | 0.0760 | 0.011 |
| ADD1 | rs16843169 | BP response = −1.7941 − 4.6642*log(Endothelin) − 8.2145*log(TRIG) + 6.5921*Gender − 7.0455*SNP | 0.0361 | 0.0429 |
| ADD1 | rs6833874 | BP response = −0.1305 −3.9535*log(Endothelin) − 5.8818*log(TRIG) + 5.0602*Gender − 7.8010*SNP | 0.0566 | 0.0077 |
| MODERATE | ||||
| SBP | ||||
| Gene | Polymorphism | Model1 | PVE | P value |
| None | None | BP response = −3.2665 + 10.9273*log(INSULIN) | 0.6623 | – |
| Gene | Polymorphism | Model1 | Partial PVE2 | P value3 |
| ACE | rs3730036 | BP response = −4.1164 + 8.0972*log(INSULIN) + 11.9101*SNP | 0.0690 | 0.0736 |
| CYP11B2 | rs3802228 | BP response = −4.8800 + 8.2175*log(INSULIN) + 5.6512*SNP | 0.0857 | 0.0429 |
| CYP11B2 | rs38022284 | BP response = −4.1164 + 8.0972*log(INSULIN) + 11.9101*SNPr | 0.0690 | 0.0736 |
| CYP11B2 | rs6432 | BP response = −4.1164 + 8.0972*log(INSULIN) + 11.9101*SNP | 0.0690 | 0.0736 |
VIGOROUS, 100% of peak oxygen consumption (VO2peak); MODERATE, 60% VO2peak; SBP, systolic blood pressure; DBP, diastolic blood pressure; PVE, proportion of variance explained; ACE, Angiotensinogen‐Converting Enzyme, AGTR1, Angiotensin Type 1 Receptor, CYP11B2, Aldosterone Synthase, ADD1, Adducin; SNP, polymorphism; TRIG, triglycerides; AASICONT, resing ambulatory arterial stiffness index over 19 h; Orientation 19 h SBP, resting ambulatory SBP over 19 h.
1Restricted maximum likelihood estimates reported; all covariates centered except for polymorphism.
2Either polymorphism only (when there is no polymorphism by time interaction) or joint polymorphism and polymorphism by time effects (when there is a polymorphism by time interaction), computed using maximum likelihood.
3Likelihood ratio tests for either polymorphism only (when there is no polymorphism by time interaction) or joint polymorphism and polymorphism by time effects (when there is a polymorphism by time interaction) under maximum likelihood.
4Recessive model for polymorphism (i.e., SNPr = 0 if 0 or 1 copy of the minor allele; SNPr = 1 if 2 copies of the minor allele; additive genetic models used for all other polymorphisms (i.e., SNP = #minor allele).
Combined annotation‐dependent depletion score
The CADD score for each variant passing the threshold for multiple testing is listed in Tables 2 (VIGOROUS) and 3 (MODERATE). ADD1 rs16843169 had a CADD score of 13.93 and AGTR1 rs74662294 had a CADD score of 9.038 in Table 2 and ACE rs3730036 had a CADD score of 17.2 in Table 3, indicating they are likely to have causal and regulatory effects (Kircher et al. 2014).
Discussion
Because the heritability of hypertension largely resides in the kidneys, over a decade ago, we embarked upon a series of candidate gene association studies that involved renal polymorphisms reported to be associated with hypertension and the BP response to pharmacotherapy and/or exercise training for their associations with PEH. In these discovery phase studies, variants in ACE, AGT, AGTR1, CYP11B2, and ADD1 exhibited exercise‐intensity associations with PEH among Caucasians (Blanchard et al. 2006; Pescatello et al. 2007, 2008; Ash et al. 2013a; Bruneau et al. 2015). Using genomic technology that was not available until recently, the major findings from this validation study were that variants in ACE, AGTR1, CYP11B2, and ADD1 associated with PEH after VIGOROUS but not MODERATE among AF only. Among variants in these genes passing multiple testing thresholds, after VIGOROUS over 19 h, as the #MA increased, BP decreased by 12–30 mmHg after exercise compared to control. The magnitude of these PEH by renal genotype reductions is much greater than that reported for PEH on average (Pescatello et al. 2015a,b), and equals or exceeds those reported with antihypertensive drug treatment (ALLHAT Officers and Coordinators for the ALLHAT Collaborative Research Group. The Antihypertensive and Lipid‐Lowering Treatment to Prevent Heart Attack Trial 2002, Brown et al. 2013). In contrast, an unexpected finding was that among ACE and CYP11B2 variants passing multiple testing thresholds, after MODERATE over 19 h, as the #MA increased, BP increased by 21–22 mmHg. Collectively, these renal variants explained from 3% up to 9% of the variance in the BP response to acute aerobic exercise. There were no significant renal variant associations with the BP response to VIGOROUS or MODERATE among Caucasians.
AF have the highest prevalence of hypertension compared to other ethnic groups and suffer from a disproportionate burden of the adverse cardiovascular health effects associated with hypertension (Mozaffarian et al. 2014). The BP response to antihypertensive pharmacotherapy differs among AF and Caucasians as do the pharmacogenetic association patterns for the treatment of hypertension (Turner et al. 2012; Reiter et al. 2015; Do et al. 2016). Evidence also exists that PEH differs between AF and Caucasians (Headley et al. 1998; Pescatello et al. 2003; Santa‐Clara et al. 2003; Bond et al. 2005; Brandon and Elliott‐Lloyd 2006; Jones et al. 2006, 2007; Enweze et al. 2007). Our results provide insight into possible reasons for the ethnic differences in PEH that may partially reside in the vasoconstrictive actions of the renal system as modulated by the RAS and other renal structural variants and exercise intensity. For, only when the SBP and DBP responses over 19 h after VIGOROUS and MODERATE were examined by renal variant #MA did ethnic differences appear. These findings are consistent with our previous reports of exercise intensity‐dependent associations of renal polymorphisms with PEH (Blanchard et al. 2006; Pescatello et al. 2007, 2008; Ash et al. 2013a). Yet, it is important to note that although the same genes emerged from our discovery phase and validation studies regarding their associations with the BP response to acute aerobic exercise (i.e., ACE, AGTR1, CYP11B2, and ADD1), the individual variants harbored within them differed between studies, and we did not confirm our original findings in Caucasians as we only observed significance among AF in this study.
An important finding from both our discovery phase and replication studies is that established clinical biomarkers still account for most of the PVE in PEH (Pescatello et al. 2008; Eicher et al. 2010; Ash et al. 2013a). Indeed, clinical covariates that included resting ambulatory BP, resting ambulatory arterial stiffness index, age, gender, fasting insulin and triglycerides, and endothelin accounted for 66.2–92.5% of the variation in the BP response after VIGOROUS or MODERATE depending on the final multivariable regression model. Nonetheless, individual renal variants accounted for an additional 3–9% of the PVE in the BP response after VIGOROUS or MODERATE, a partial PVE that is larger than that typically reported for individual variants in exercise genomic studies examining health‐related phenotypes (Ash et al. 2013a; Bruneau et al. 2015).
An interesting observation is that the same subject carried one or two copies of the Minor Alleles (MA) from each of the renal variants associated with the BP response after VIGOROUS (Table 2) or MODERATE (Table 3), but these two subjects were different people depending upon the intensity of bout. Indeed, one subject could be labeled a “super” responder to VIGOROUS with an average SBP reduction of 30 mmHg and DBP reduction of 20 mmHg over 19 h. While the other subject could be considered an “adverse” responder to MODERATE with an average SBP increase of 16 mmHg and DBP increase of 4 mmHg over 19 h. Collectively, our findings illustrate the complexity and challenges of using genomic information to inform clinical decision making regarding the future use of personalized exercise prescriptions to maximize the effectiveness of exercise as antihypertensive therapy.
A major limitation of this study is the small sample size so our findings should be interpreted with caution. For this reason, we calculated the power of the variant screening method using simulation based on the estimated parameters from the screening model for each significant renal variant in Tables 2 and 3, and calculated the power to detect BP‐genotype significant differences as the proportion of 1000 simulations in which the variant P‐value (calculated using the residual degree of freedom method) was less than alpha=0.05/300 (i.e., adjusted for 300 unique genotypic profiles for AF). The power to detect the BP‐genotype significant differences ranged from 19.5% for CYP11B2 rs6432 in Table 3 to 82.4% for ACE rs1055086 in Table 2. In instances where there was insufficient power, for example ADD1 rs16843169 with a power of 26.5% and CADD score of 13.93 in Table 2, the CADD score nonetheless often indicated that particular variant was likely to have causal and regulatory effects.
In addition, we instituted methodological strategies to increase the statistical power to detect renal genotype‐BP associations should they exist (Bouchard 2011; Ash et al. 2013a; Bruneau et al. 2015; Mattsson et al. 2016). These strategies included a repeated measure design among the same individuals that increased the number of observations per subject by 19 hourly time points, a focused inquiry of polymorphisms with a prioritized panel of genes that reduced the search space within the genome, performing high throughput exon sequencing to focus on functional regions of the gene, and inclusion of the same standardized protocols and methods in our discovery phase and replication studies. Other strengths of this replication study were inclusion of a randomized control design with the subjects serving as their own control; the gold standard of BP assessment, ambulatory BP monitoring (Niiranen et al. 2014); and a well‐controlled and monitored exercise exposure; as well as adjustment for multiple testing that was based only on genetic variants exhibiting variability in the #MA and with unique genotypic values. Yet, due to the small sample size and in instances when only one or two subjects carried a MA, the multivariable models adjusted for covariates may have been over fit to accommodate those subjects, our findings should be regarded as preliminary and interpreted with caution.
In conclusion, in a replication cohort using high‐throughput exon sequencing, we found that renal genes from our prior work once again exhibited exercise intensity‐dependent associations with the ambulatory BP response to acute bouts of aerobic exercise. Our findings are preliminary and are limited by a small sample size, therefore, they should be interpreted with caution. Nonetheless, they are exciting because they add new and novel information to the exercise genomic literature regarding the immediate antihypertensive effects of exercise. Future work should utilize a multi‐level “omics” approach involving a focused inquiry of genes related to renal function and other BP regulatory functions and their transcript and proteomic targets among a large, ethnically diverse sample of adults with hypertension to better inform clinical decision making regarding the nuances of the prescription of exercise as antihypertensive lifestyle therapy.
Conflict of Interest
None declared.
Supporting information
Appendix S1. The prioritized panel of genes and their associated polymorphisms that were sequenced.
Acknowledgment
The Jackson Laboratory's Scientific Services (Genome Technologies) for performing the deep‐targeting exon sequencing and preparation of the variant calling files.
Pescatello L. S., Schifano E. D., Ash G. I., Panza G. A., Lamberti L., Chen M.‐H., Deshpande V., Zaleski A., Farinatti P., Taylor B. A., Thompson P. D.. Deep‐targeted exon sequencing reveals renal polymorphisms associate with postexercise hypotension among African Americans. Physiol Rep, 4 (19), 2016, e12992, doi: 10.14814/phy2.12992
Funding Information
The University of Connecticut (UConn) Research Foundation; UConn Institute for Collaboration on Health, Intervention, and Policy; Connecticut Institute for Clinical and Translational Science; Experiment.Com; and Brazilian Council for the Scientific and Technological Development.
References
- ALLHAT Officers and Coordinators for the ALLHAT Collaborative Research Group. The Antihypertensive and Lipid‐Lowering Treatment to Prevent Heart Attack Trial . 2002. Major outcomes in high‐risk hypertensive patients randomized to angiotensin‐converting enzyme inhibitor or calcium channel blocker vs diuretic: The Antihypertensive and Lipid‐Lowering Treatment to Prevent Heart Attack Trial (ALLHAT). JAMA 288:2981–2997. [DOI] [PubMed] [Google Scholar]
- Arnett, D. K. , Baird A. E., Barkley R. A., Basson C. T., Boerwinkle E., Ganesh S. K., et al.; American Heart Association Council on Epidemiology and Prevention, American Heart Association Stroke Council & Functional Genomics and Translational Biology Interdisciplinary Working Group . 2007. Relevance of genetics and genomics for prevention and treatment of cardiovascular disease: a scientific statement from the American Heart Association Council on Epidemiology and Prevention, the Stroke Council, and the Functional Genomics and Translational Biology Interdisciplinary Working Group. Circulation 115:2878–2901. [DOI] [PubMed] [Google Scholar]
- Ash, G. I. , Eicher J. D., and Pescatello L. S.. 2013a. The promises and challenges of the use of genomics in the prescription of exercise for hypertension: the 2013 update. Curr. Hypertens. Rev. 9:130–147. [DOI] [PubMed] [Google Scholar]
- Ash, G. I. , Walker T. J., Olson K. M., Stratton J. H., Gomez A. L., Kraemer W. J., et al. 2013b. Reproducibility of ambulatory blood pressure changes from the initial values on two different days. Clinics (Sao Paulo) 68:1509–1515. [DOI] [PMC free article] [PubMed] [Google Scholar]
- Basson, J. , Sung Y. J., Schwander K., Kume R., Simino J., de las Fuentes L., et al. 2014. Gene‐education interactions identify novel blood pressure loci in the Framingham Heart Study. Am. J. Hypertens. 27:431–444. [DOI] [PMC free article] [PubMed] [Google Scholar]
- Benjamini, Y. , and Yekutieli D.. 2005. Quantitative trait Loci analysis using the false discovery rate. Genetics 171:783–790. [DOI] [PMC free article] [PubMed] [Google Scholar]
- Blanchard, B. E. , Tsongalis G. J., Guidry M. A., LaBelle L. A., Poulin M., Taylor A. L., et al. 2006. RAAS polymorphisms alter the acute blood pressure response to aerobic exercise among men with hypertension. Eur. J. Appl. Physiol. 97:26–33. [DOI] [PubMed] [Google Scholar]
- Bond, V. , Millis R. M., Adams R. G., Oke L. M., Enweze L., Blakely R., et al. 2005. Attenuation of exaggerated exercise blood pressure response in African‐American women by regular aerobic physical activity. Ethn. Dis. 15(Suppl. 5):S5–S10‐3. [PMC free article] [PubMed] [Google Scholar]
- Bouchard, C. 2011. Overcoming barriers to progress in exercise genomics. Exerc. SportSci. Rev. 39:212–217. [DOI] [PMC free article] [PubMed] [Google Scholar]
- Bouchard, C. , Blair S. N., Church T. S., Earnest C. P., Hagberg J. M., Hakkinen K., et al. 2012. Adverse metabolic response to regular exercise: is it a rare or common occurrence? PLoS ONE 7:e37887. [DOI] [PMC free article] [PubMed] [Google Scholar]
- Bozkurt, O. , Verschuren W. M., van Wieren‐de Wijer B. M., Knol M. J., de Boer A., Grobbee D. E., et al. 2008. Genetic variation in the renin‐angiotensin system modifies the beneficial effects of ACE inhibitors on the risk of diabetes mellitus among hypertensives. J. Hum. Hypertens. 22:774–780. [DOI] [PubMed] [Google Scholar]
- Brandon, L. J. , and Elliott‐Lloyd M. B.. 2006. Walking, body composition, and blood pressure dose‐response in African American and white women. Ethn. Dis. 16:675–681. [PubMed] [Google Scholar]
- Brossaud, J. , and Corcuff J. B.. 2009. Pre‐analytical and analytical considerations for the determination of plasma renin activity. Clin. Chim. Acta 410:90–92. [DOI] [PubMed] [Google Scholar]
- Brown, R. E. , Riddell M. C., Macpherson A. K., Canning K. L., and Kuk J. L.. 2013. The joint association of physical activity, blood‐pressure control, and pharmacologic treatment of hypertension for all‐cause mortality risk. Am. J. Hypertens. 26:1005–1010. [DOI] [PubMed] [Google Scholar]
- Bruneau, M. L. Jr , Johnson B. T., Huedo‐Medina T. B., Larson K. A., Ash G. I., and Pescatello L. S.. 2015. The blood pressure response to acute and chronic aerobic exercise: a meta‐analysis of candidate gene association studies. J. Sci. Med. Sport 19:424–431. [DOI] [PubMed] [Google Scholar]
- Collier, S. R. , Kanaley J. A., Carhart R. Jr, Frechette V., Tobin M. M., Hall A. K., et al. 2008. Effect of 4 weeks of aerobic or resistance exercise training on arterial stiffness, blood flow and blood pressure in pre‐ and stage‐1 hypertensives. J. Hum. Hypertens. 22:678–686. [DOI] [PubMed] [Google Scholar]
- Danecek, P. , Auton A., Abecasis G., Albers C. A., Banks E., DePristo M. A., et al.; 1000 Genomes Project Analysis Group . 2011. The variant call format and VCFtools. Bioinformatics 27:2156–2158. [DOI] [PMC free article] [PubMed] [Google Scholar]
- Do, A. N. , Lynch A. I., Claas S. A., Boerwinkle E., Davis B. R., Ford C. E., et al. 2016. The effects of genes implicated in cardiovascular disease on blood pressure response to treatment among treatment‐naive hypertensive African Americans in the GenHAT study. J. Hum. Hypertens. 30:549–554. [DOI] [PMC free article] [PubMed] [Google Scholar]
- Dolan, E. , Thijs L., Li Y., Atkins N., McCormack P., McClory S., et al. 2006. Ambulatory arterial stiffness index as a predictor of cardiovascular mortality in the Dublin Outcome Study. Hypertension 47:365–370. [DOI] [PubMed] [Google Scholar]
- Eicher, J. D. , Maresh C. M., Tsongalis G. J., Thompson P. D., and Pescatello L. S.. 2010. The additive blood pressure lowering effects of exercise intensity on post‐exercise hypotension. Am. Heart J. 160:513–520. [DOI] [PubMed] [Google Scholar]
- Enweze, L. , Oke L. M., Thompson T., Obisesan T. O., Blakely R., Adams R. G., et al. 2007. Acute exercise and postexercise blood pressure in African American women. Ethn. Dis. 17:664–668. [PMC free article] [PubMed] [Google Scholar]
- Fitzgerald, W. 1981. Labile hypertension and jogging: new diagnostic tool or spurious discovery? BMJ (Clin Res Ed) 282:542–544. [DOI] [PMC free article] [PubMed] [Google Scholar]
- Friedewald, W. T. , Levy R. I., and Fredrickson D. S.. 1972. Estimation of the concentration of low‐density lipoprotein cholesterol in plasma, without use of the preparative ultracentrifuge. Clin. Chem. 18:499–502. [PubMed] [Google Scholar]
- GBD 2013 Risk Factors Collaborators ; Forouzanfar, M. H. , Alexander L., Anderson H. R., Bachman V. F., Biryukov S., Brauer M., et al. 2015. Global, regional, and national comparative risk assessment of 79 behavioural, environmental and occupational, and metabolic risks or clusters of risks in 188 countries, 1990–2013: a systematic analysis for the Global Burden of Disease Study 2013. Lancet 386:2287–2323. [DOI] [PMC free article] [PubMed] [Google Scholar]
- Ghasemi, A. , Zahediasl S., and Azizi F.. 2010. Reference values for serum nitric oxide metabolites in an adult population. Clin. Biochem. 43:89–94. [DOI] [PubMed] [Google Scholar]
- Hagberg, J. M. , Ferrell R. E., Katzel L. I., Dengel D. R., Sorkin J. D., and Goldberg A. P.. 1999. Apolipoprotein E genotype and exercise training‐induced increases in plasma high‐density lipoprotein (HDL)‐ and HDL2‐cholesterol levels in overweight men. Metabolism 48:943–945. [DOI] [PubMed] [Google Scholar]
- Halliwill, J. R. 2001. Mechanisms and clinical implications of post‐exercise hypotension in humans. Exerc. Sport Sci. Rev. 29:65–70. [DOI] [PubMed] [Google Scholar]
- Haskell, W. L. 1994. J.B. Wolffe Memorial Lecture. Health consequences of physical activity: understanding and challenges regarding dose‐response. Med. Sci. Sports Exerc. 26:649–660. [DOI] [PubMed] [Google Scholar]
- Headley, S. A. , Keenan T. G., Manos T. M., Phillips K., Lachowetz T., Keenan H. A., et al. 1998. Renin and hemodynamic responses to exercise in borderline hypertensives. Ethn. Dis. 8:312–318. [PubMed] [Google Scholar]
- Hecksteden, A. , Grutters T., and Meyer T.. 2013. Association between postexercise hypotension and long‐term training‐induced blood pressure reduction: a pilot study. Clin. J. Sport Med. 23:58–63. [DOI] [PubMed] [Google Scholar]
- Jennings, G. L. , Deakin G., Korner P., Meredith I., Kingwell B., and Nelson L.. 1991. What is the dose‐response relationship between exercise training and blood pressure? Ann. Med. 23:313–318. [DOI] [PubMed] [Google Scholar]
- Jones, J. M. , Park J. J., Johnson J., Vizcaino D., Hand B., Ferrell R., et al. 2006. Renin‐angiotensin system genes and exercise training‐induced changes in sodium excretion in African American hypertensives. Ethn. Dis. 16:666–674. [PMC free article] [PubMed] [Google Scholar]
- Jones, J. M. , Dowling T. C., Park J. J., Phares D. A., Park J. Y., Obisesan T. O., et al. 2007. Differential aerobic exercise‐induced changes in plasma aldosterone between African Americans and Caucasians. Exp. Physiol. 92:871–879. [DOI] [PMC free article] [PubMed] [Google Scholar]
- Kenney, M. J. , and Seals D. R.. 1993. Postexercise hypotension. Key features, mechanisms, and clinical significance. Hypertension 22:653–664. [DOI] [PubMed] [Google Scholar]
- Kircher, M. , Witten D. M., Jain P., O'Roak B. J., Cooper G. M., and Shendure J.. 2014. A general framework for estimating the relative pathogenicity of human genetic variants. Nat. Genet. 46:310–315. [DOI] [PMC free article] [PubMed] [Google Scholar]
- Kohno, K. , Matsuoka H., Takenaka K., Miyake Y., Nomura G., and Imaizumi T.. 1997. Renal depressor mechanisms of physical training in patients with essential hypertension. Am. J. Hypertens. 10:859–868. [DOI] [PubMed] [Google Scholar]
- Konoshita, T. ; Genomic Disease Outcome Consortium (G‐DOC) Study Investigators . 2011. Do genetic variants of the Renin‐Angiotensin system predict blood pressure response to Renin‐Angiotensin system‐blocking drugs?: a systematic review of pharmacogenomics in the Renin‐Angiotensin system. Curr. Hypertens. Rep. 13:356–361. [DOI] [PMC free article] [PubMed] [Google Scholar]
- Krizanova, O. , Koska J., Vigas M., and Kvetnansky R.. 1998. Correlation of M235T DNA polymorphism with cardiovascular and endocrine responses during physical exercise in healthy subjects. Physiol. Res. 47:81–88. [PubMed] [Google Scholar]
- Liu, S. , Goodman J., Nolan R., Lacombe S., and Thomas S. G.. 2012. Blood pressure responses to acute and chronic exercise are related in prehypertension. Med. Sci. Sports Exerc. 44:1644–1652. [DOI] [PubMed] [Google Scholar]
- Maddala, G. S. 1983. Limited‐dependent and qualitative variables in econometrics. Cambridge University Press, Cambridge. [Google Scholar]
- Magee, L. 1990. R2 measures based on Wald and likelihood ratio joint significance tests. Am. Stat. 44:250–253. [Google Scholar]
- Maitland‐van der Zee, A. H. , Turner S. T., Schwartz G. L., Chapman A. B., Klungel O. H., and Boerwinkle E.. 2005. Demographic, environmental, and genetic predictors of metabolic side effects of hydrochlorothiazide treatment in hypertensive subjects. Am. J. Hypertens. 18:1077–1083. [DOI] [PubMed] [Google Scholar]
- Matthews, D. R. , Hosker J. P., Rudenski A. S., Naylor B. A., Treacher D. F., and Turner R. C.. 1985. Homeostasis model assessment: insulin resistance and beta‐cell function from fasting plasma glucose and insulin concentrations in man. Diabetologia 28:412–419. [DOI] [PubMed] [Google Scholar]
- Mattsson, C. M. , Wheeler M. T., Waggott D., Caleshu C., and Ashley E. A.. 2016. Sports genetics moving forward: lessons learned from medical research. Physiol. Genomics 48:175–182. [DOI] [PubMed] [Google Scholar]
- Meredith, I. T. , Jennings G. L., Esler M. D., Dewar E. M., Bruce A. M., Fazio V. A., et al. 1990. Time‐course of the antihypertensive and autonomic effects of regular endurance exercise in human subjects. J. Hypertens. 8:859–866. [DOI] [PubMed] [Google Scholar]
- Moker, E. A. , Bateman L. A., Kraus W. E., and Pescatello L. S.. 2014. The relationship between the blood pressure responses to exercise following training and detraining periods. PLoS ONE 9:e105755. [DOI] [PMC free article] [PubMed] [Google Scholar]
- Mozaffarian, D. , Benjamin E. J., Go A. S., Arnett D. K., Blaha M. J., Cushman M., et al. 2014. Heart disease and stroke statistics‐2015 update: a report from the American Heart Association. Circulation 131:e29–322. [DOI] [PubMed] [Google Scholar]
- Murray, A. , Delaney T., and Bell C.. 2006. Rapid onset and offset of circulatory adaptations to exercise training in men. J. Hum. Hypertens. 20:193–200. [DOI] [PubMed] [Google Scholar]
- Niiranen, T. J. , Maki J., Puukka P., Karanko H., and Jula A. M.. 2014. Office, home, and ambulatory blood pressures as predictors of cardiovascular risk. Hypertension 64:281–286. [DOI] [PubMed] [Google Scholar]
- Padmanabhan, S. , Newton‐Cheh C., and Dominiczak A. F.. 2012. Genetic basis of blood pressure and hypertension. Trends Genet. 28:397–408. [DOI] [PubMed] [Google Scholar]
- Pescatello, L. S. , and Kulikowich J. M.. 2001. The aftereffects of dynamic exercise on ambulatory blood pressure. Med. Sci. Sports Exerc. 33:1855–1861. [DOI] [PubMed] [Google Scholar]
- Pescatello, L. S. , Fargo A. E., Leach C. N. Jr, and Scherzer H. H.. 1991. Short‐term effect of dynamic exercise on arterial blood pressure. Circulation 83:1557–1561. [DOI] [PubMed] [Google Scholar]
- Pescatello, L. S. , Bairos L., Vanheest J. L., Maresh C. M., Rodriguez N. R., Moyna N. M., et al. 2003. Postexercise hypotension differs between white and black women. Am. Heart J. 145:364–370. [DOI] [PubMed] [Google Scholar]
- Pescatello, L. S. , Franklin B. A., Fagard R., Farquhar W. B., Kelley G. A., and Ray C. A.; American College of Sports Medicine . 2004a. American College of Sports Medicine position stand. Exercise and hypertension. Med. Sci. Sports Exerc. 36:533–553. [DOI] [PubMed] [Google Scholar]
- Pescatello, L. S. , Guidry M. A., Blanchard B. E., Kerr A., Taylor A. L., Johnson A. N., et al. 2004b. Exercise intensity alters postexercise hypotension. J. Hypertens. 22:1881–1888. [DOI] [PubMed] [Google Scholar]
- Pescatello, L. S. , Blanchard B. E., Tsongalis G. J., Maresh C. M., O'Connell A., and Thompson P. D.. 2007. The alpha‐adducin Gly460Trp polymorphism and the antihypertensive effects of exercise among men with high blood pressure. Clin. Sci. (Lond.) 113:251–258. [DOI] [PubMed] [Google Scholar]
- Pescatello, L. S. , Blanchard B. E., Tsongalis G. J., O'Connell A. A., Gordish‐Dressman H., Maresh C. M., et al. 2008. A comparison of the genetic and clinical profile of men that respond and do not respond to the immediate antihypertensive effects of aerobic exercise. Appl. Clin. Genet. 1:7–17. [DOI] [PMC free article] [PubMed] [Google Scholar]
- Pescatello, L. S. , Riebe D., and Arena R.. 2013. ACSM's guidelines for exercise testing and prescription. 9th ed. Lippincott Williams & Wilkins, Baltimore, MD. [DOI] [PubMed] [Google Scholar]
- Pescatello, L. S. , MacDonald H. V., Ash G. I., Lamberti L. M., Farquhar W. B., Arena R., et al. 2015a. Assessing the existing professional exercise recommendations for hypertension: a review and recommendations for future research priorities. Mayo Clin. Proc. 90:801–812. [DOI] [PubMed] [Google Scholar]
- Pescatello, L. S. , MacDonald H. V., Lamberti L., and Johnson B. T.. 2015b. Exercise for hypertension: a prescription update integrating existing recommendations with emerging research. Curr. Hypertens. Rep. 17:87. 11906‐015‐0600‐y. [DOI] [PMC free article] [PubMed] [Google Scholar]
- Pickering, T. G. , Hall J. E., Appel L. J., Falkner B. E., Graves J., Hill M. N., et al.; Subcommittee of Professional and Public Education of the American Heart Association Council on High Blood Pressure Research . 2005. Recommendations for blood pressure measurement in humans and experimental animals: part 1: blood pressure measurement in humans: a statement for professionals from the Subcommittee of Professional and Public Education of the American Heart Association Council on High Blood Pressure Research. Hypertension 45:142–161. [DOI] [PubMed] [Google Scholar]
- Rankinen, T. , Gagnon J., Perusse L., Chagnon Y. C., Rice T., Leon A. S., et al. 2000. AGT M235T and ACE ID polymorphisms and exercise blood pressure in the HERITAGE Family Study. Am. J. Physiol. Heart Circ. Physiol. 279:H368–H374. [DOI] [PubMed] [Google Scholar]
- Reiter, L. M. , Christensen D. L., and Gjesing A. P.. 2015. Renin angiotensinogen system gene polymorphisms and essential hypertension among people of West African descent: a systematic review. J. Hum. Hypertens. 30:467–478. [DOI] [PubMed] [Google Scholar]
- Santa‐Clara, H. , Szymanski L., and Fernhall B.. 2003. Effect of exercise training on blood pressure in postmenopausal Caucasian and African‐American women. Am. J. Cardiol. 91:1009–1011, A8. [DOI] [PubMed] [Google Scholar]
- Schemper, M. 1993. The relative importance of prognostic factors in studies of survival. Stat. Med. 12:2377–2382. [DOI] [PubMed] [Google Scholar]
- Su, X. , Lee L., Li X., Lv J., Hu Y., Zhan S., et al. 2007. Association between angiotensinogen, angiotensin II receptor genes, and blood pressure response to an angiotensin‐converting enzyme inhibitor. Circulation 115:725–732. [DOI] [PubMed] [Google Scholar]
- Thompson, P. D. , Crouse S. F., Goodpaster B., Kelley D., Moyna N., and Pescatello L.. 2001. The acute versus the chronic response to exercise. Med. Sci. Sports Exerc. 33(6 Suppl.):S438–S445; discussion S452‐3. [DOI] [PubMed] [Google Scholar]
- Tibana, R. A. , de Sousa N. M., da Cunha Nascimento D., Pereira G. B., Thomas S. G., Balsamo S., et al. 2015. Correlation between acute and chronic 24‐hour blood pressure response to resistance training in adult women. Int. J. Sports Med. 36:82–89. [DOI] [PubMed] [Google Scholar]
- Turner, S. T. , Bailey K. R., Schwartz G. L., Chapman A. B., Chai H. S., and Boerwinkle E.. 2012. Genomic association analysis identifies multiple loci influencing antihypertensive response to an angiotensin II receptor blocker. Hypertension 59:1204–1211. [DOI] [PMC free article] [PubMed] [Google Scholar]
- Wilcox, R. G. , Bennett T., Brown A. M., and Macdonald I. A.. 1982. Is exercise good for high blood pressure? BMJ (Clin Res Ed) 285:767–769. [DOI] [PMC free article] [PubMed] [Google Scholar]
Associated Data
This section collects any data citations, data availability statements, or supplementary materials included in this article.
Supplementary Materials
Appendix S1. The prioritized panel of genes and their associated polymorphisms that were sequenced.