

Abstract
Background. No treatment regimens have been specifically designed for children, in whom tuberculosis is predominantly intracellular. Given their activity as monotherapy and their ability to penetrate many diseased anatomic sites that characterize disseminated tuberculosis, linezolid and moxifloxacin could be combined to form a regimen for this need.
Methods. We examined microbial kill of intracellular Mycobacterium tuberculosis (Mtb) by the combination of linezolid and moxifloxacin multiple exposures in a 7-by-7 mathematical matrix. We then used the hollow fiber system (HFS) model of intracellular tuberculosis to identify optimal dose schedules and exposures of moxifloxacin and linezolid in combination. We mimicked pediatric half-lives and concentrations achieved by each drug. We sampled the peripheral compartment on days 0, 7, 14, 21, and 28 for Mtb quantification, and compared the slope of microbial kill of Mtb by these regimens to the standard regimen of isoniazid, rifampin, and pyrazinamide, based on exponential decline regression.
Results. The full exposure-response surface identified linezolid-moxifloxacin zones of synergy, antagonism, and additivity. A regimen based on each of these zones was then used in the HFS model, with observed half-lives of 4.08 ± 0.66 for linezolid and 3.80 ± 1.34 hours for moxifloxacin. The kill rate constant was 0.060 ± 0.012 per day with the moxifloxacin-linezolid regimen in the additivity zone vs 0.083 ± 0.011 per day with standard therapy, translating to a bacterial burden half-life of 11.52 days vs 8.53 days, respectively.
Conclusions. We identified doses and dose schedules of a linezolid and moxifloxacin backbone regimen that could be highly efficacious in disseminated tuberculosis in children.
Keywords: disseminated tuberculosis, hollow fiber system model, additivity, exposure-response surface, Bliss independence
There are several challenges in the treatment of children with tuberculosis. First, it is difficult to obtain cultures; hence, most children are treated without drug susceptibility test results. Rapid susceptibility tests are now a standard in treatment of culture-positive tuberculosis in many places. Second, even if resistance profiles were known, no regimens have been developed to treat children with multidrug-resistant (MDR) tuberculosis. Third, while tuberculosis in adults and children is treated with combination therapy, no data exist on possible synergy and antagonism of different drugs and their doses for the treatment of children. This aspect is crucial; in adult tuberculosis, the in vivo synergy of rifampin and pyrazinamide was central to shortening therapy to 6 months despite pyrazinamide having only modest rates of sterilizing effect as monotherapy [1–5]. In addition, we have demonstrated concentration-dependent antagonism of isoniazid and rifampin in mice, in adult sterilizing activity, and in children treated with first-line antituberculosis drugs [5–9]. Fourth, in neonates, infants, and toddlers, extrapulmonary tuberculosis is common and frequently involves sites such as the peritoneum, the central nervous system, and bone [10–12]. Drugs have to be able to penetrate into these sites adequately if children are to be cured. Fifth, in childhood intrathoracic tuberculosis and disseminated disease, Mycobacterium tuberculosis (Mtb) is predominantly intracellular. Drugs that do not penetrate inside the cells will not kill intracellular Mtb. This means that the drugs used to treat this disease should be concentrated inside infected cells, and not expelled via efflux[13]. Here, we chose to examine a combination of 2 drugs that can overcome these pathophysiological barriers.
Moxifloxacin is an 8-methoxy fluoroquinolone with bactericidal activity against extracellular Mtb that concentrates up to 32 times inside macrophages [14–18]. Second, the reported ratio of the moxifloxacin area under the concentration-time curve (AUC) for cerebrospinal fluid (CSF) to plasma is 0.71–0.82, that for peritoneal fluid to plasma 1.91, and that for bone to plasma approximately 0.50 [19–21]. Thus, moxifloxacin enters the most common sites involved in disseminated tuberculosis adequately. Moreover, moxifloxacin is a cornerstone of the treatment of MDR tuberculosis in adults. Similarly, linezolid, an oxazolidinone, concentrates inside macrophages based on our studies and achieves good penetration in several tissues [22–24]. CSF-to-plasma ratios of 0.66–0.94 have been reported, whereas AUC ratios >1.0 have been reported for inflamed subcutis and bone [23, 25–27]. Mean linezolid concentrations of 3.54–16.2 µg/mL have been observed in peritoneal dialysis fluid after systemic administration [28]. The efficacy of linezolid is increasingly recognized in difficult-to-treat cases of drug-resistant tuberculosis. In addition, linezolid and moxifloxacin are available in oral suspension and syrup formulations and, given that both are AUC/minimum inhibitory concentration (MIC) driven, can be administered once daily. Moreover, they avoid the toxicity of other second-line agents such as ototoxicity from aminoglycosides. Finally, these agents have different mechanisms of effect (gyrase inhibition vs bacteria protein synthesis inhibition). Thus, there are several theoretical reasons why a linezolid-moxifloxacin combination could be attractive for the treatment of tuberculosis in children. However, because concentration-dependent antagonism, synergy, and additivity are important determinants of therapy failure and death in children, it will be important to identify doses in the exposure-effect zones that would not be antagonistic [1–9]. This means that there is a need to examine large exposure-response surfaces for these drugs, and use the resulting data to identify a combination therapy regimen for treatment of disseminated tuberculosis in children.
MATERIALS AND METHODS
Organism
Mtb H37Ra (ATCC no. 25177) was used in all the experiments. Stock cultures of Mtb stored at −80°C in Middlebrook 7H9 broth were thawed before each experiment and grown in Middlebrook 7H9 broth supplemented with 10% oleic acid-dextrose-catalase at 37°C under 5% CO2 in a shaking incubator so as to achieve logarithmic phase growth (log-phase).
Materials and Drugs
Linezolid and moxifloxacin hydrochloride solution were purchased from the Baylor University Medical Center pharmacy. E-test strips were purchased from bioMérieux (Marcy L'Etoile, France). Penicillin-streptomycin 10 000 units/mL (Gibco) was used with Roswell Park Memorial Institute Medium (RPMI) 1640 to wash Mtb-infected monocytes in 24-well plates. THP-1 cells, a human leukemia monocytic cell line, were purchased from ATCC (ATCC TIB-202). Hollow fiber cartridges were purchased from FiberCell (Frederick, Maryland).
Mtb Infection of THP-1 Cells
Prewarmed RPMI-1640 medium supplemented with 10% heat inactivated fetal bovine serum (FBS) at 37°C under 5% CO2 was used to grow THP-1 monocytes. THP-1 cells were maintained by subculturing every 72 hours. Log-phase Mtb was used to infect the THP-1 cells by coincubating a bacteria-to-macrophage ratio of 1:1 for 6 hours. At the end of the infection period, the infected macrophages were centrifuged at 200g for 5 minutes and extracellular bacteria washed away with warm streptomycin-supplemented RPMI 1640, following which cells were counted using both a hemocytometer and Coulter counter.
Determination of Minimum Inhibitory Concentration
Linezolid MIC was determined as described in the accompanying article in this supplement [22]. Moxifloxacin MIC was identified using the microbroth dilution method. The turbidity of log-phase Mtb culture was adjusted to bacterial density of 105 colony-forming units (CFU)/mL. The cultures were treated with moxifloxacin concentrations of 0, 0.125, 0.25, 0.5, 1.0, 2.0, 4.0, and 8.0 mg/L in 96-well plates in duplicate, incubated at 37°C under 5% CO2, and read after 10 days. MIC was defined as the lowest concentration that prevents visible growth.
Linezolid and Moxifloxacin Combination Activity Matrix in 24-Well Plates
THP-1 monocytes at density 106 cells/mL were activated over 72 hours using 10−6 M (final concentration) phorbol myristate acetate in 24-well plates. The adherent THP-1 cells were infected with Mtb in log-phase growth and washed twice with warm RPMI/FBS. The infected cells were then coincubated with moxifloxacin concentrations of 0, 0.04, 0.05, 0.06, 0.08, 0.1, and 1 mg/L in combination with linezolid concentrations of 0, 0.27, 0.38, 0.5, 0.72, 0.92, and 4 mg/L, so that each linezolid concentration was combined with each moxifloxacin concentration, in a matrix of 49 wells, in triplicate (148 wells total). Mathematically, this is a rectangular array or 7-by-7 matrix. The concentrations were chosen because they represent the EC20, EC35, EC50, EC70, EC80, and EC99 of each of the drugs under the same experimental conditions. The ECx is the effective concentration mediating X% of maximal kill. The contents were coincubated at 37°C under 5% CO2 for 7 days, after which the adherent cells were washed twice to remove drug, then lysed with phosphate-buffered saline with 0.025% Tween-20. The cultures were serially diluted, spread on Middlebrook 7H10 agar, and incubated at 37°C under 5% CO2 for 21 days, after which colonies were counted.
Moxifloxacin and Linezolid Combination Study in the Hollow Fiber System
The hollow fiber system (HFS) model of intracellular tuberculosis has been previously described in detail [13, 22]. Twenty milliliters of Mtb-infected THP-1 cells was inoculated into the peripheral compartment of each of 18 HFSs, with circulating RPMI 1640 and 2% FBS. Three replicate HFSs were not treated with any drugs and served as the nontreated controls. There were 3 HFS replicates for each drug treatment regimen. Doses were chosen based on the analysis of results of linezolid-moxifloxacin activity matrix with static concentrations of drug described above, as well as our monotherapy HFS study, using the 0- to 24-hour AUC (AUC0–24)-to-MIC ratio, given that this is the pharmacokinetic/pharmacodynamic driver for linezolid and moxifloxacin [22, 29]. We chose linezolid monotherapy exposures associated with 20% and 90% of maximal kill (EC20 and EC90) as further controls. We then chose a linezolid-moxifloxacin combination and dosing schedule in the antagonism zone, and a dose combination in the additivity zone. We did not choose from the synergy zone because it was too narrow (see below). We were interested in comparing the kill rates of these regimens to the plasma concentration-time profiles mimicking standard 3-drug combination therapy with 10 mg/kg of isoniazid, 15 mg/kg of rifampin, and 40 mg/kg pyrazinamide, administered once each day for 28 days. Fresh media were infused into, and pumped out of, the HFS at predefined rates to mimic the linezolid, moxifloxacin, isoniazid (slow acetylators), and rifampin half-lives (T1/2) of 3–4 hours encountered in children aged <3 years [30–33]. The pyrazinamide T1/2 in children that we mimicked was 5.5 hours [6, 32]. Concentration-time profiles of each antibiotic were validated by sampling the central compartment of each HFS at 1, 3.5, 7, 10.5, 14, 21, and 23.5 hours after drug infusion. To determine the Mtb CFU/mL and number of THP-1 cells, the peripheral compartments were sampled on days 0, 7, 14, 21, and 28 of treatment. Additionally, samples were also cultured on Middlebrook 7H10 agar that had been supplemented with 2 times the moxifloxacin MIC and 3 times the linezolid MIC to quantify the moxifloxacin- and linezolid-resistant subpopulations at each of these time points.
Drug Concentration Assays
Antibiotic concentrations in the samples collected from the central compartment of the HFS were analyzed by liquid chromatography–tandem mass spectrometry. The assays to measure linezolid, rifampin, isoniazid, and pyrazinamide concentrations were as previously described [13, 22]. Moxifloxacin was purchased from Sigma (St Louis, Missouri), and moxifloxacin-13Cd3 (internal standard) was purchased from Santa Cruz Biotech (Santa Cruz, California). Calibrator, controls, and internal standard were included in each analytical run for quantitation. Stock solutions of moxifloxacin and internal standard were prepared in 80:20 methanol:water at a concentration of 1 mg/mL and stored at −20°C. A 7-point calibration curve was prepared by diluting moxifloxacin stock solution in drug-free media (0.1, 0.2, 1, 2, 5, 10, and 20 μg/mL); the correlation coefficient was 0.999. Quality control samples were prepared by spiking media with stock standards for 2 levels of controls at 0.4 mg/L and 8.0 mg/L. Samples were prepared in 96-well microtiter plates by the addition of 10 µL of calibrator, quality control, or sample to 190 µL 0.1% formic acid in water containing 10 μg/mL internal standard followed by vortex. Chromatographic separation was achieved on an Acquity UPLC HSS T3 1.8-μm 50 × 2.1-mm analytical column (Waters) maintained at 30°C at a flow of 0.2 mL/min with a binary gradient with a total run time of 6 minutes. The observed ion (m/z) values of the fragment ions were moxifloxacin (m/z 402.2 → 384.2) and internal standard, moxifloxacin-13CD (m/z 406.2 → 388.3). Sample injection and separation was performed by an Acquity UPLC interfaced with a Xevo TQ mass spectrometer (Waters). All data were collected using MassLynx software version 4.1 SCN810. The limit of quantitation for this assay was 0.1 μg/mL. The interday percentage coefficient of variation for the assay was 2.0% ± 1.4% and intraday was 5.6% ± 3.5%.
Pharmacokinetic and Pharmacodynamic Modeling
For the 2-drug combination matrix study, the effect of the linezolid and moxifloxacin AUC0–24/MIC ratio interactions were calculated based on Bliss independence, implemented in the MacSynergy II program [34–36]. This model examines the effect of each drug concentration alone on the monotherapy dose response, and then calculates the theoretical additive effect of the 2 drug concentrations. It thus calculates a whole surface of additivity for the entire matrix, to give the expected effect if there was additivity. Next, the theoretical additivity surface is subtracted from the experimentally observed effect surface to give an interaction factor. If this is negative (ie, observed effect is smaller than expected and the 95% confidence interval [CI] does not cross zero), then there is antagonism. If it is zero (expected = observed), then there is additivity. If the observed effect is greater than expected, then the interaction factor will be positive, with its lower 95% CI bound above zero. The findings from MacSynergy II were exported to SigmaPlot (Systat Software, San Jose, California) for a 3-dimensional exposure–effect surface diagram.
Pharmacokinetic modeling for moxifloxacin, linezolid, isoniazid, rifampin, and pyrazinamide was as described in accompanying articles in this supplement [6, 22]. The pharmacokinetic parameters identified were used to calculate the AUC0–24 of each drug in each HFS, and hence AUC0–24/MIC. Peak concentrations were those measured at the end of the 1.0-hour drug infusion in each HFS. For the HFS studies, we calculated the kill rates using 2 types of regression. If the data included <3 time points at which the bacterial burden reached below limits of detection in the standard regimen, we used linear regression for that outcome. Otherwise, we used an exponential decline model, as microbial kill rates in patients follow exponential decline models [5, 37]. In this model, the rate constant ± standard deviation was then compared between the regimens, and this was also translated to a bacterial burden decline T1/2.
RESULTS
The moxifloxacin MIC was 0.125 mg/L, and the linezolid MIC was 1 mg/L [22]. The interaction of the moxifloxacin and linezolid AUC0–24/MIC ratio combinations in the 7-by-7 matrix is shown in Figure 1. The figure shows that for this pair of drugs, there are 3 different zones depending on AUC0–24/MIC pairs: antagonism, synergy, and additivity. Thus, moxifloxacin and linezolid are both synergistic and antagonistic, depending on the drug concentrations tested. The synergy between the 2 drugs was mild and in a narrow zone described by a ridge of linezolid AUC0–24/MICs of 9.12 bounded by moxifloxacin AUC0–24/MICs of 19.2–192. The zone of antagonism was larger and deeper (Figure 1). Fortunately, the largest proportion of the surface in Figure 1 was characterized by additivity.
Figure 1.
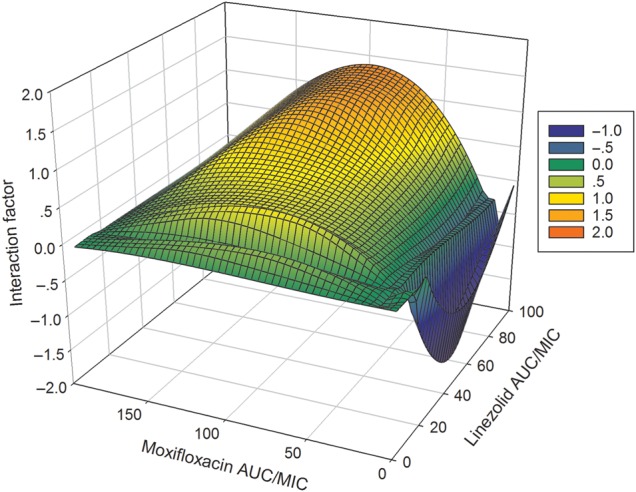
Exposure-response surface for the linezolid-moxifloxacin combination effect against intracellular Mycobacterium tuberculosis, in wells. The figure shows antagonism on the surface bounded by moxifloxacin 0- to 24-hour area under the curve (AUC0–24)/minimum inhibitory concentration (MIC) ratios of 11.52–19.20 and linezolid AUC0–24/MIC ratios of 12.0–22.08, shown in deep blue. The interaction factor was −0.02 (95% confidence interval [CI], −.03 to −.01). The zone of synergy was narrower, and was a ridge along a linezolid AUC0–24/MIC ratio of 9.12 bounded by moxifloxacin AUC0–24/MIC ratios of 19.2–192 with an interaction factor of 0.01 (95% CI, .01–.01). The rest of the surface, shown in shades of green, demonstrated additivity based on the finding that the observed effect minus the expected effect was zero.
For the HFS, we chose 1 combination of doses that would achieve AUC0–24/MIC ratios in the antagonism zone, and a second combination of doses in the additivity zone. We achieved several different concentration-time profiles, with the elimination rate constants and resultant T1/2s shown in Table 1. The linezolid AUC0–24/MICs achieved in the HFS were as follows: In regimen 1 the ratio was 8.16 ± 0.53, in regimen 2 was 14.49 ± 2.12, in regimen 3 was 26.15 ± 7.77, and in regimen 4 was 206.5 ± 30.5. For moxifloxacin, the AUC0–24/MIC ratios achieved were 14.88 ± 1.52 in regimen 2 and 232.09 ± 9.49 for regimen 4. For standard first-line drugs, which were in regimen 5, for which both AUC and peak have been shown to be associated with effect in adults and children [6, 38], the rifampin AUC0–24/MIC was 151.30 ± 41.87 and peak/MIC 11.26 ± 3.79, the isoniazid AUC0–24/MIC was 459.10 ± 70.45 and peak/MIC 69.27 ± 4.97, and the pyrazinamide AUC0–24/MIC was 15.13 ± 2.40 and peak/MIC 3.11 ± 0.10.
Table 1.
Pharmacokinetics of Linezolid and Moxifloxacin in the Hollow Fiber Study
| Drug | Kel/h, Mean ± SD | Half-life, h, Mean ± SD | r2 |
|---|---|---|---|
| Linezolid | 0.17 ± 0.03 | 4.08 ± 0.66 | 0.98 |
| Moxifloxacin | 0.20 ± 0.07 | 3.80 ± 1.34 | 0.97 |
| Rifampin | 0.18 ± 0.03 | 4.09 ± 1.13 | >0.99 |
| Isoniazid | 0.19 ± 0.05 | 3.74 ± 0.57 | >0.99 |
| Pyrazinamide | 0.13 ± 0.02 | 5.46 ± 0.08 | 0.97 |
Abbreviation: SD, standard deviation.
Figure 2 shows the number of viable THP-1 cells during the study. The number of viable cells is a combination of the effect of the bacterial burden (more macrophages die with increase in Mtb burden) and drug toxicity. Figure 2 shows the overwhelming advantage of treatment on this process, with a 15-fold higher number of macrophages on day 21 with treatment by standard therapy and some linezolid-moxifloxacin regimens, compared with nontreated systems. On the other hand, it should be noted that the linezolid EC90 monotherapy was associated with the lowest number of viable cells, likely because of toxicity since the AUC of 206 mg × h/L exceeded that associated with toxicity (94 mg × h/L) [22].
Figure 2.
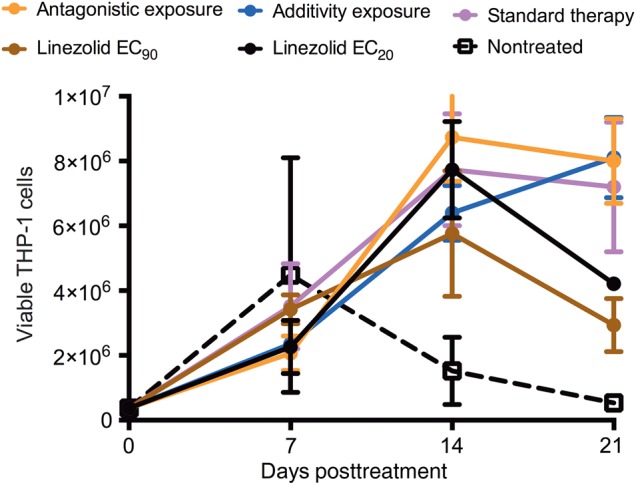
Effect of linezolid-moxifloxacin combination on viability of THP-1 cells for the duration of the hollow fiber study. Estimates are mean and standard deviation for 3 replicate hollow fiber systems. There was an increase in number of viable THP-1 cells in the regimens receiving standard therapy and additive exposures compared with untreated controls, highlighting the advantage of treatment with drugs to achieve exposures that are efficacious. The linezolid exposure associated with 20% of maximal kill (EC20) regimen results in a high bacterial burden due to ineffective killing and therefore more cell death and, hence, lower viable cells. On the other hand, the low number of viable cells seen with the linezolid exposure associated with 90% of maximal kill (EC90) exposure was likely due to drug toxicity.
The total bacterial burden at each of the sampling time points in each set of HFS replicates is shown in Figure 3. There was no emergence of resistance in any regimen. The figure shows that both linezolid monotherapy regimens permitted some degree of bacterial multiplication, although the higher dose was associated with greater growth suppression. The dual regimen chosen for being in the antagonistic zone barely held the bacterial burden at the day 0 levels, as predicted. Figure 3 shows that the regimen chosen based on AUC0–24/MICs in the additivity region of the matrix was associated with decline of the total bacterial burden. Based on exponential decline regression models, the kill rate constant was 0.060 ± 0.012 per day (r2 = 0.72) with this moxifloxacin-linezolid regimen vs 0.083 ± 0.011 per day (r2 = 0.88) with the standard triple-drug regimen, calculating to a bacterial viability T1/2 of 11.52 days vs 8.53 days, respectively. Thus, the standard triple-drug regimen was associated with faster kill than the linezolid-moxifloxacin additivity-based regimen, but by a factor of only 38%. When the bacterial burden was expressed as Mtb CFU per THP-1 monocyte, the results were as shown in Figure 4. The dynamic range of decline is smaller; however, the pattern is the same as with total bacterial burden in Figure 3, with the same ranking of the regimens by kill rate.
Figure 3.
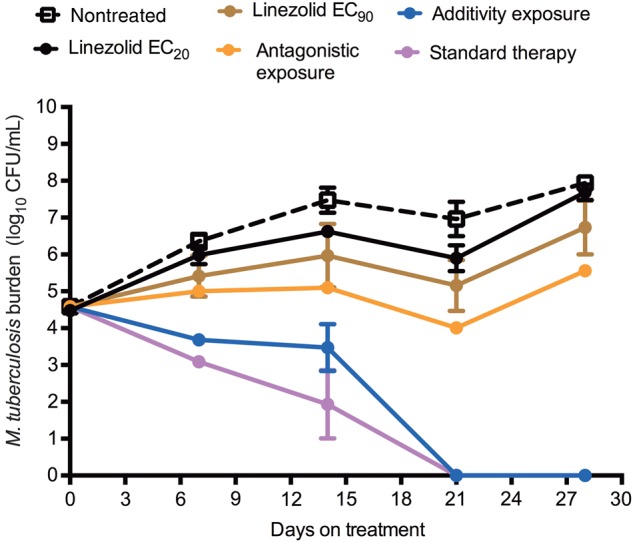
Time kill curves for total bacterial burden from each hollow fiber system (HFS). Estimates are mean and standard deviation for 3 replicate HFS. The regimen with antagonistic response surface exposures held the bacterial burden around the level of stasis, then failed. As predicted, the additivity exposure regimen killed effectively, as shown by the decline in bacterial burden. However, the kill rate was slower than that of the standard therapy. Abbreviations: CFU, colony-forming units; EC20, exposure associated with 20% of maximal kill; EC90, exposure associated with 90% of maximal kill.
Figure 4.
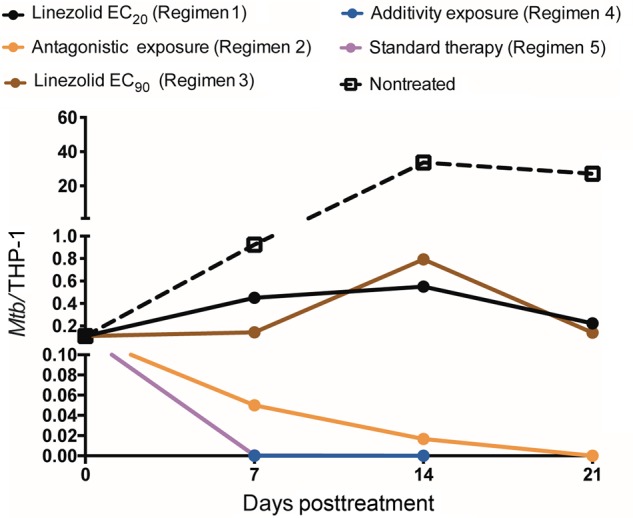
Effect of microbial burden on THP-1 cells when expressed as a ratio of colony-forming units to number of THP-1 monocytes. Estimates are mean and standard deviation for 3 replicate hollow fiber systems. The number on bacteria per THP-1 cell is a composite of bacterial burden and drug toxicity–related viability of THP-1. The pattern and ranking order of regimens based on kill rates did not change, even when taking survival of THP-1 cells into account, and follows that of total bacterial burden shown in Figure 3. The slopes for the additivity exposure (regimen 4) and standard therapy regimen overlap completely, so that only one is visible in the figure. Abbreviations: EC20, exposure associated with 20% of maximal kill; EC90, exposure associated with 90% of maximal kill; Mtb, Mycobacterium tuberculosis.
DISCUSSION
Whether a combination of drugs is synergistic or antagonistic may depend on the concentrations tested. In a clinical study elsewhere, we have shown that the antagonism of isoniazid to rifampin and pyrazinamide could lead to 3-fold higher rates of death in children with tuberculosis [6]. The same has been shown in murine tuberculosis, in the HFS model of tuberculosis, and adult patient sterilizing effect, but at different concentrations from those in children [5–9, 39]. The combination of linezolid and moxifloxacin has been reported as “synergistic” in vitro against clinical isolates from both patients with MDR tuberculosis and patients with non-MDR tuberculosis [40]. We show that the linezolid-moxifloxacin exposure-response surface has regions of antagonism and synergy, dependent on concentrations. The importance of this is that in identifying doses to go into a combination regimen, the doses must be chosen so that they avoid achieving concentrations in the antagonism zones. In the HFS model, the regimen in the antagonism range failed and only held the bacterial burden constant. On the other hand, the regimen whose exposures fell within the additivity zones was associated with a sustained antimicrobial effect. We will use this drug combination and the exposures associated with additivity as the backbone of a regimen for treating intracellular tuberculosis in children. However, it is important to note that these exposures of synergy and antagonism are specific to these 2 drugs in this particular regimen and cannot be extrapolated to their congeners. In addition, we are not proposing that this regimen be directly administered to children; rather, it forms the backbone of a regimen to be examined in clinical trials.
Combination therapy studies in children in which several different doses and dose combinations are examined have never been performed, even with the first-line regimen, since the beginning of chemotherapy. Considering that concentration-dependent antagonism and synergy exist, our study provides a paradigm for how they can be identified using preclinical models and utilized to define optimal exposure ranges. Our approach allows identification of combination based on slopes that would allow us to identify regimens that may kill faster than the current standard regimen in the future. When integrated with data on population pharmacokinetics and MIC distributions, these desired exposure ranges can be used to optimize drug dosing and inform the development of combination regimens that could be tested in children, maximizing the chances of good response upfront.
The combination of linezolid and moxifloxacin could be an effective regimen for the treatment of both drug-susceptible and MDR tuberculosis. This is important as children tend not to have positive cultures of Mtb on which to perform drug susceptibility tests. One of the current goals in pediatric tuberculosis by the global community is development of regimens that work in children without distinction of drug-susceptible tuberculosis and MDR tuberculosis status [41]. Our linezolid-moxifloxacin backbone would work, regardless of whether the children have MDR tuberculosis or drug-susceptible disease. However, though complete, the kill slopes of the dual regimen were shallower than the standard 3-drug regimen, suggesting that therapy may take >6 months. Concentration-dependent toxicity from linezolid and moxifloxacin in children is a potential cause for concern; however, this could be partially mitigated by giving exposures associated with optimal efficacy but below toxic concentrations, as discussed in the linezolid monotherapy article and in the accompanying article on Monte Carlo simulations in this supplement [22, 42]. Further studies that include a third agent, enabling the combination to achieve a microbial response to match that of standard therapy, are reported in an accompanying article in this supplement [43].
There are limitations to our study. First, we used a single Mtb isolate. This attenuated strain has reduced virulence. However, the response to other antibiotics in intracellular infection has been shown to be predictive of events in children infected with different strains [13]. Using more isolates with different MICs in the pharmacokinetic/pharmacodynamic studies could lead to better generalizability. However, the MIC distribution was taken into account in performing Monte Carlo simulations in the subsequent accompanying article in this supplement [42]. Second, these concepts need further validation. We will perform such validation in the mouse model of disseminated and intracellular tuberculosis.
In summary, we have demonstrated that the combination of linezolid and moxifloxacin is efficacious against intracellular Mtb. We identified the concentrations associated with synergy, additivity, and antagonism, for regimen design. These 2 drugs in combination at these doses can likely form the backbone of a dual regimen for the treatment of both drug-susceptible and MDR tuberculosis.
Notes
Financial support. Funding for this study was provided by the National Institute of Allergy and Infectious Diseases of the National Institutes of Health (grant number R56 AI111985).
Author contributions. T. G. and E. N. designed the study; D. D., S. S., and T. G. performed the hollow fiber studies; D. D. wrote the first draft of the manuscript; D. D., S. S., E. N., J. G. P., S. S., and T. G. wrote the manuscript.
Supplement sponsorship. This article appears as part of the supplement “A Development Paradigm for Novel Combination Regimens for Multidrug-Resistant and Drug-Susceptible Tuberculosis in Children: FLAME for Work and Play,” sponsored by the Center for Infectious Diseases Research and Experimental Therapeutics (CIDRET), Baylor Institute for Immunology Research, Baylor Research Institute.
Potential conflicts of interest. T. G. is a consultant for Astellas Pharma USA and LuminaCare solutions, and founded Jacaranda Biomed, Inc. All other authors report no potential conflicts. All authors have submitted the ICMJE Form for Disclosure of Potential Conflicts of Interest. Conflicts that the editors consider relevant to the content of the manuscript have been disclosed.
References
- 1.Jindani A, Doré CJ, Mitchison DA. Bactericidal and sterilizing activities of antituberculosis drugs during the first 14 days. Am J Respir Crit Care Med 2003; 167:1348–54. [DOI] [PubMed] [Google Scholar]
- 2.Controlled trial of four thrice-weekly regimens and a daily regimen all given for 6 months for pulmonary tuberculosis. Lancet 1981; 1:171–4. [PubMed] [Google Scholar]
- 3.Lecoeur HF, Lagrange PH, Truffot-Pernot C, Gheorghiu M, Grosset J. Relapses after stopping chemotherapy for experimental tuberculosis in genetically resistant and susceptible strains of mice. Clin Exp Immunol 1989; 76:458–62. [PMC free article] [PubMed] [Google Scholar]
- 4.Ahmad Z, Fraig MM, Bisson GP, Nuermberger EL, Grosset JH, Karakousis PC. Dose-dependent activity of pyrazinamide in animal models of intracellular and extracellular tuberculosis infections. Antimicrob Agents Chemother 2011; 55:1527–32. [DOI] [PMC free article] [PubMed] [Google Scholar]
- 5.Chigutsa E, Pasipanodya JG, Visser ME et al. Impact of nonlinear interactions of pharmacokinetics and MICs on sputum bacillary kill rates as a marker of sterilizing effect in tuberculosis. Antimicrob Agents Chemother 2015; 59:38–45. [DOI] [PMC free article] [PubMed] [Google Scholar]
- 6.Swaminathan S, Pasipanodya J, Ramachandran G, Srivastava S, Deshpande D, Gumbo T. Drug concentration thresholds predictive of therapy failure and death in children with tuberculosis: bread crumb trails in random forests. Clin Infect Dis 2016; 63(suppl 3):S63–74. [DOI] [PMC free article] [PubMed] [Google Scholar]
- 7.Almeida D, Nuermberger E, Tasneen R et al. Paradoxical effect of isoniazid on the activity of rifampin-pyrazinamide combination in a mouse model of tuberculosis. Antimicrob Agents Chemother 2009; 53:4178–84. [DOI] [PMC free article] [PubMed] [Google Scholar]
- 8.Grosset J, Truffot-Pernot C, Lacroix C, Ji B. Antagonism between isoniazid and the combination pyrazinamide-rifampin against tuberculosis infection in mice. Antimicrob Agents Chemother 1992; 36:548–51. [DOI] [PMC free article] [PubMed] [Google Scholar]
- 9.Grosset J, Almeida D, Converse PJ et al. Modeling early bactericidal activity in murine tuberculosis provides insights into the activity of isoniazid and pyrazinamide. Proc Natl Acad Sci U S A 2012; 109:15001–5. [DOI] [PMC free article] [PubMed] [Google Scholar]
- 10.Datta M, Swaminathan S. Global aspects of tuberculosis in children. Paediatr Respir Rev 2001; 2:91–6. [DOI] [PubMed] [Google Scholar]
- 11.Mandalakas AM, Starke JR. Current concepts of childhood tuberculosis. Semin Pediatr Infect Dis 2005; 16:93–104. [DOI] [PubMed] [Google Scholar]
- 12.Marais BJ, Gie RP, Schaaf HS, Hesseling AC, Enarson DA, Beyers N. The spectrum of disease in children treated for tuberculosis in a highly endemic area. Int J Tuberc Lung Dis 2006; 10:732–8. [PubMed] [Google Scholar]
- 13.Srivastava S, Pasipanodya JG, Ramachandran G et al. A long-term co-perfused disseminated tuberculosis-3D liver hollow fiber model for both drug efficacy and hepatotoxicity in babies. EBioMedicine 2016; 6:126–38. [DOI] [PMC free article] [PubMed] [Google Scholar]
- 14.Gosling RD, Uiso LO, Sam NE et al. The bactericidal activity of moxifloxacin in patients with pulmonary tuberculosis. Am J Respir Crit Care Med 2003; 168:1342–5. [DOI] [PubMed] [Google Scholar]
- 15.Hu Y, Coates AR, Mitchison DA. Sterilizing activities of fluoroquinolones against rifampin-tolerant populations of Mycobacterium tuberculosis. Antimicrob Agents Chemother 2003; 47:653–7. [DOI] [PMC free article] [PubMed] [Google Scholar]
- 16.Pletz MW, De RA, Roth A, Neumann KH, Mauch H, Lode H. Early bactericidal activity of moxifloxacin in treatment of pulmonary tuberculosis: a prospective, randomized study. Antimicrob Agents Chemother 2004; 48:780–2. [DOI] [PMC free article] [PubMed] [Google Scholar]
- 17.Capitano B, Mattoes HM, Shore E et al. Steady-state intrapulmonary concentrations of moxifloxacin, levofloxacin, and azithromycin in older adults. Chest 2004; 125:965–73. [DOI] [PubMed] [Google Scholar]
- 18.Deshpande D, Srivastava S, Meek C, Leff R, Hall GS, Gumbo T. Moxifloxacin pharmacokinetics/pharmacodynamics and optimal dose and susceptibility breakpoint identification for treatment of disseminated Mycobacterium avium infection. Antimicrob Agents Chemother 2010; 54:2534–9. [DOI] [PMC free article] [PubMed] [Google Scholar]
- 19.Alffenaar JW, van Altena R, Bokkerink HJ et al. Pharmacokinetics of moxifloxacin in cerebrospinal fluid and plasma in patients with tuberculous meningitis. Clin Infect Dis 2009; 49:1080–2. [DOI] [PubMed] [Google Scholar]
- 20.Stass H, Rink AD, Delesen H, Kubitza D, Vestweber KH. Pharmacokinetics and peritoneal penetration of moxifloxacin in peritonitis. J Antimicrob Chemother 2006; 58:693–6. [DOI] [PubMed] [Google Scholar]
- 21.Malincarne L, Ghebregzabher M, Moretti MV et al. Penetration of moxifloxacin into bone in patients undergoing total knee arthroplasty. J Antimicrob Chemother 2006; 57:950–4. [DOI] [PubMed] [Google Scholar]
- 22.Deshpande D, Srivastava S, Pasipanodya JG et al. Linezolid for infants and toddlers with disseminated tuberculosis: first steps. Clin Infect Dis 2016; 63(suppl 3):S80–7. [DOI] [PMC free article] [PubMed] [Google Scholar]
- 23.MacGowan AP. Pharmacokinetic and pharmacodynamic profile of linezolid in healthy volunteers and patients with gram-positive infections. J Antimicrob Chemother 2003; 51(suppl 2):ii17–25. [DOI] [PubMed] [Google Scholar]
- 24.Gee T, Ellis R, Marshall G, Andrews J, Ashby J, Wise R. Pharmacokinetics and tissue penetration of linezolid following multiple oral doses. Antimicrob Agents Chemother 2001; 45:1843–6. [DOI] [PMC free article] [PubMed] [Google Scholar]
- 25.Traunmuller F, Schintler MV, Spendel S et al. Linezolid concentrations in infected soft tissue and bone following repetitive doses in diabetic patients with bacterial foot infections. Int J Antimicrob Agents 2010; 36:84–6. [DOI] [PubMed] [Google Scholar]
- 26.Myrianthefs P, Markantonis SL, Vlachos K et al. Serum and cerebrospinal fluid concentrations of linezolid in neurosurgical patients. Antimicrob Agents Chemother 2006; 50:3971–6. [DOI] [PMC free article] [PubMed] [Google Scholar]
- 27.Yogev R, Damle B, Levy G, Nachman S. Pharmacokinetics and distribution of linezolid in cerebrospinal fluid in children and adolescents. Pediatr Infect Dis J 2010; 29:827–30. [DOI] [PubMed] [Google Scholar]
- 28.DePestel DD, Peloquin CA, Carver PL. Peritoneal dialysis fluid concentrations of linezolid in the treatment of vancomycin-resistant Enterococcus faecium peritonitis. Pharmacotherapy 2003; 23:1322–6. [DOI] [PubMed] [Google Scholar]
- 29.Gumbo T, Louie A, Deziel MR, Parsons LM, Salfinger M, Drusano GL. Selection of a moxifloxacin dose that suppresses drug resistance in Mycobacterium tuberculosis, by use of an in vitro pharmacodynamic infection model and mathematical modeling. J Infect Dis 2004; 190:1642–51. [DOI] [PubMed] [Google Scholar]
- 30.Jungbluth GL, Welshman IR, Hopkins NK. Linezolid pharmacokinetics in pediatric patients: an overview. Pediatr Infect Dis J 2003; 22:S153–7. [DOI] [PubMed] [Google Scholar]
- 31.Thee S, Garcia-Prats AJ, Draper HR et al. Pharmacokinetics and safety of moxifloxacin in children with multidrug-resistant tuberculosis. Clin Infect Dis 2015; 60:549–56. [DOI] [PMC free article] [PubMed] [Google Scholar]
- 32.Hiruy H, Rogers Z, Mbowane C et al. Subtherapeutic concentrations of first-line anti-TB drugs in South African children treated according to current guidelines: the PHATISA study. J Antimicrob Chemother 2015; 70:1115–23. [DOI] [PMC free article] [PubMed] [Google Scholar]
- 33.Bayer HealthCare. Safety, tolerability and pharmacokinetics of single dose intravenous moxifloxacin in pediatric patients, 2011. Available at: http://trialfinder.bayerscheringpharma.de/html/pdf/11826_Study_Synopsis_CTP.pdf. Accessed 18 July 2016.
- 34.Greco WR, Bravo G, Parsons JC. The search for synergy: a critical review from a response surface perspective. Pharmacol Rev 1995; 47:331–85. [PubMed] [Google Scholar]
- 35.MacSynergy II. Version 1.0. User's manual. Ann Arbor: University of Michigan, 1992. [Google Scholar]
- 36.Bliss CI. The toxicity of poisons applied jointly. Ann Appl Biol 1939; 26:585–615. [Google Scholar]
- 37.Chigutsa E, Patel K, Denti P et al. A time-to-event pharmacodynamic model describing treatment response in patients with pulmonary tuberculosis using days to positivity in automated liquid mycobacterial culture. Antimicrob Agents Chemother 2013; 57:789–95. [DOI] [PMC free article] [PubMed] [Google Scholar]
- 38.Pasipanodya JG, McIlleron H, Burger A, Wash PA, Smith P, Gumbo T. Serum drug concentrations predictive of pulmonary tuberculosis outcomes. J Infect Dis 2013; 208:1464–73. [DOI] [PMC free article] [PubMed] [Google Scholar]
- 39.Srivastava S, Sherman C, Meek C, Leff R, Gumbo T. Pharmacokinetic mismatch does not lead to emergence of isoniazid- or rifampin-resistant Mycobacterium tuberculosis but to better antimicrobial effect: a new paradigm for antituberculosis drug scheduling. Antimicrob Agents Chemother 2011; 55:5085–9. [DOI] [PMC free article] [PubMed] [Google Scholar]
- 40.Zou L, Liu M, Wang Y, Lu J, Pang Y. Determination of in vitro synergy between linezolid and other antimicrobial agents against Mycobacterium tuberculosis isolates. Tuberculosis (Edinb) 2015; 95:839–42. [DOI] [PubMed] [Google Scholar]
- 41.Nachman S, Ahmed A, Amanullah F et al. Towards early inclusion of children in tuberculosis drugs trials: a consensus statement. Lancet Infect Dis 2015; 15:711–20. [DOI] [PMC free article] [PubMed] [Google Scholar]
- 42.Srivastava S, Deshpande D, Pasipanodya J et al. Optimal clinical doses of faropenem, linezolid, and moxifloxacin in children with disseminated tuberculosis: Goldilocks. Clin Infect Dis 2016; 63(suppl 3):S102–9. [DOI] [PMC free article] [PubMed] [Google Scholar]
- 43.Deshpande D, Srivastava S, Nuermberger E, Pasipanodya J, Swaminathan S, Gumbo T. A faropenem, linezolid, and moxifloxacin regimen for both drug-susceptible and multidrug-resistant tuberculosis in children: FLAME path on the Milky Way. Clin Infect Dis 2016; 63(suppl 3):S95–101. [DOI] [PMC free article] [PubMed] [Google Scholar]