

Abstract
Background. Infants and toddlers often present with disseminated and lymph node tuberculosis, in which Mycobacterium tuberculosis (Mtb) is predominantly intracellular. Linezolid, used to treat tuberculosis in adults, has not been formally studied in infants. Infants clear linezolid 5 times faster than adults and achieve lower 0- to 24-hour area under the concentration-time curves (AUC0–24).
Methods. To mimic intracellular disease, we infected human-derived THP-1 macrophages with Mtb and inoculated hollow fiber systems. We performed dose-effect and dose-scheduling studies in which we recapitulated the linezolid half-life of 3 hours encountered in infants. Repetitive sampling for linezolid pharmacokinetics, Mtb intracellular burden, viable monocyte count, and RNA sequencing reads were performed up to 28 days.
Results. The linezolid extracellular half-life was 2.64 ± 0.38 hours, whereas intracellular half-life was 8.93 ± 1.30 hours (r2 = 0.89). Linezolid efficacy was linked to the AUC0–24 to minimum inhibitory concentration (MIC) ratio (r2 = 0.98). The exposure associated with maximal Mtb kill was an AUC0–24/MIC of 23.37 ± 1.16. We identified a 414-gene transcript on exposure to toxic linezolid doses. The largest number of genes mapped to ribosomal proteins, a signature hitherto not associated with linezolid toxicity. The second-largest number of differentially expressed genes mapped to mitochondrial enzyme inhibition. Linezolid AUC0–24 best explained the mitochondrial gene inhibition, with 50% inhibition at 94 mg × hour/L (highest r2 = 0.98).
Conclusions. We identified the linezolid AUC0–24/MIC target for optimal efficacy against pediatric intracellular tuberculosis, and an AUC0–24 threshold associated with mitochondrial inhibition. These constitute a therapeutic window to be targeted for optimal linezolid doses in children with tuberculosis.
Keywords: disseminated tuberculosis, pharmacokinetics/pharmacodynamics, toxicity, hollow fiber model, RNA sequencing
Difficulty in treating adults and children who have multidrug-resistant (MDR) tuberculosis has led to increased interest in linezolid. In adults with cavitary pulmonary disease, linezolid was associated with a sputum conversion in approximately 80% of patients when administered as the only active drug in the regimen [1]. However, linezolid efficacy in children with MDR tuberculosis is still at a case report level. In a review of the literature that compiled case reports of 18 children with MDR tuberculosis, there was a reported culture conversion within 1–3 months in all children [2]. Optimal doses are unclear, and doses used were copied from adults. However, linezolid exhibits age-dependent pharmacokinetic variability after administration of the standard dose of 10 mg/kg: Systemic clearance is 0.32 L/hour/kg in infants, 0.23 L/hour/kg in toddlers, and 0.13 L/kg in adolescents and adults [3]. This means that infants and toddlers will achieve relatively low 0- to 24-hour area under the concentration-time curves (AUC0–24) per dose in milligrams per kilogram (mg/kg), as AUC0–24 is calculated as daily dose divided by systemic clearance.
Intrathoracic disease remains the most common manifestation of tuberculosis in children. However, young children, especially infants, also have a propensity to develop disseminated tuberculosis [4–6]. In both disseminated and intrathoracic tuberculosis in children, Mtb is predominantly intracellular. This intracellular milieu retards the microbial kill of many antibiotics used to treat mycobacteria, including Mtb, despite good efficacy against the same extracellular mycobacteria [7–9]. Thus, when used to treat children with tuberculosis, it will be important to identify intracellular exposure-response relationships, as well as the intracellular clearance of drugs such as linezolid. If examined in preclinical experimental models, such studies should also mimic the rapid clearance of linezolid encountered in young children. In addition, because prolonged linezolid use is associated with high rates of hematologic and neurologic side effects based on inhibition of mitochondrial enzymes [10–15], it will be important to identify doses that optimize microbial kill while minimizing toxicity. Here, we used the intracellular Mycobacterium tuberculosis (Mtb) hollow fiber model (HFS) to identify the linezolid exposures that maximize microbial kill while minimizing toxicity, based on linezolid pediatric pharmacokinetics and whole transcriptome RNA sequencing (RNA-Seq).
MATERIALS AND METHODS
Bacterial Strain, Cell Lines, and Growth Conditions
Prior to each experiment, stock Mtb H37Ra culture (ATCC number 25177) was thawed and grown in Middlebrook 7H9 broth supplemented with 10% oleic acid-dextrose-catalase (OADC) at 37°C under 5% CO2 and shaking conditions. Mtb H37Ra was chosen based on the ability to produce stable infection without killing macrophages over 4 weeks of experimental infection, unlike more virulent strains [9]. Human-derived THP-1 cells (ATCC TIB-202) were grown in Roswell Park Memorial Institute (RPMI) 1640 medium supplemented with 10% heat-inactivated fetal bovine serum (FBS) at 37°C under 5% CO2. Cells were subcultured every 72 hours.
Reagents and Supplies
Hollow fiber cartridges were purchased from FiberCell (Frederick, Maryland). Linezolid was purchased from the Baylor University Medical Center pharmacy. Etest strips were obtained from bioMérieux (Marcy L'Etoile, France). For assays to measure drug concentration, linezolid was purchased from Sigma (St Louis, Missouri), and stable isotope-labeled linezolid-d3 was purchased from CDN isotopes (Quebec, Canada).
Culture Conditions and Intracellular Infection
Mtb and THP-1 cultures were prepared as described above. THP-1 cells were coincubated with Mtb at a bacterium-to-macrophage ratio of 1:1 for 4 hours. The infected macrophages were then centrifuged at 200g for 5 minutes to wash off extracellular bacteria, following which cells were counted using a hemocytometer and Coulter counter. A sample of THP-1 cells was then ruptured to determine the number of colony-forming units (CFU)/mL as described below.
Determination of Minimum Inhibitory Concentration
Linezolid minimum inhibitory concentration (MIC) was identified using 2 methods. The first method was broth macrodilution. Turbidity of an exponential-phase Mtb culture was adjusted to a bacterial density of 1.5 × 10⁵ CFU/mL, and then treated with linezolid concentrations in Middlebrook 7H9 broth of 0, 0.075, 0.15, 0.30, 0.6, 1.25, 2.5, and 5.0 mg/L in conical tubes in triplicate. On day 7, cultures were washed twice with normal saline to prevent drug carryover, serially diluted, and cultured on Middlebrook 7H10 agar supplemented with 10% OADC (herein termed “agar”). Cultures were incubated at 37°C and colonies counted 21 days later. MIC was defined as the lowest concentration that prevented at least 99% of the growth observed in the absence of linezolid. The second method was an Epsilometer test (Etest). Two hundred microliters of Mtb in exponential phase growth with turbidity adjusted to 1.5 × 10⁸ CFU/mL were used to streak agar. Cultures were incubated at 37°C with 5% CO2 for a period of 48 hours, after which the Etest strip was applied and the cultures incubated for another 7 days, at which point the result was read. The MIC was defined as the concentration at which the ellipse or zone of inhibition intersects the MIC reading scale.
Exposure Effect Study of Intracellular Mtb in 12-Well Plates
THP-1 monocytes at a density of 1.5 × 10⁵ cells/mL were treated with phorbol myristate acetate (10−9M final concentration) in 12-well plates for 72 hours to activate them and then infected as described above. Mtb was treated with linezolid concentrations of 0, 0.075, 0.15, 0.3, 0.6, 1.25, 2.5, and 5.0 mg/L for 14 days in triplicate. Cells were collected on days 3, 7, and 14 of treatment. Cells were washed and lysed with phosphate-buffered saline (PBS) with 0.025% Tween-20, serially diluted, and cultured on agar. Cultures were incubated at 37°C and 5% CO2 and colonies counted after 21 days.
Linezolid Exposure-Response and Dose-Scheduling Studies in the Hollow Fiber System
The basic construction of the HFS was similar to the adult HFS model for extracellular tuberculosis, which was recently qualified by the European Medicines Agency and endorsed by the US Food and Drug Administration given its high forecasting accuracy [16–18]. We have adapted this to a HFS model of intracellular tuberculosis, by changing the media to RPMI/FBS and inoculating HFS with infected THP-1 cells, as recently described in detail [9]. We inoculated 20 mL of Mtb-infected THP-1 cells into the peripheral compartment of each of 16 HFSs that had been preconditioned with RPMI/FBS and maintained in incubators at 37°C for at least 72 hours. Linezolid was administered by computer-programmed syringe pumps via an infusion port into the central compartment. A combined exposure-effect and dose-scheduling study was performed wherein 9 of the 16 HFSs were dosed with linezolid to achieve AUC0–24 exposure of 0, 3, 6,12, 24, 31, 48, 77.5, and 118 mg × hour/L, and the remaining 7 systems were dosed with linezolid twice daily to achieve AUC 0–24 exposures that are twice the once-daily schedule, but at the same peak concentrations. This allows the breaking of the co-linearity of pharmacokinetic/pharmacodynamic (PK/PD) indices that would otherwise occur with dose changes. PK/PD indices under study included the AUC0–24/MIC ratio, peak concentration to MIC ratio (peak/MIC), and percentage of time concentration persists above MIC (%TMIC). The duration of therapy was 28 days. Fresh media were pumped into and out of the HFSs at predefined rates to mimic the linezolid half-life of 3 hours encountered in infants [3]. Concentration-time profiles of linezolid achieved in the HFS were substantiated by sampling the central compartment of each HFS at 7 time points over a 24-hour period post–drug infusion based on optimal sampling theory [19]. The peripheral compartments were sampled on days 0, 7, 14, 21, and 28 for quantification of the Mtb population and THP-1 cells. Samples were also cultured on agar supplemented with 3 times the linezolid MIC to capture the linezolid-resistant subpopulation at each time point.
RNA Sequencing
One milliliter of infected THP-1 macrophages from the HFS was utilized for RNA extraction using the miRNeasy kit (Qiagen), per the manufacturer's instructions. Samples were depleted of ribosomal RNA (rRNA), following which they were used for sequencing library preparation for RNA-Seq, then processed and analyzed for quality control of reads as described by us previously [9]. Alignment of reads was made using the HumanRefSeqBuilt37 (GRCh37p13). CLC Genomic workbench (ver 8) software was used for the alignment and for analyses. The data were normalized and statistical testing was performed to find the differentially expressed genes (DEGs) with statistically significant P value < .05 after Bonferroni posttest correction. Pathway analysis was performed using Kyoto Encyclopedia of Genes and Genomes (KEGG) software.
Linezolid Concentration Assay
We used stable-isotope dilution liquid chromatography-electrospray ionization (ESI)–tandem mass spectrometry (LC-ESI-MS/MS) to determine the linezolid concentration-time profile. Calibrator, controls, and internal standard (linezolid-d3) were included in each analytical run. Stock solutions of linezolid and linezolid-d3 were prepared in 80:20 methanol:water at a concentration of 1 mg/mL and stored at −20°C. A 7-point calibration curve (0.2, 0.4, 2, 4, 10, 20, 40 μg/mL) was prepared by diluting linezolid stock solution in drug-free media. The lower limit of quantitation is 0.2 µg/mL. Quality control samples were prepared by spiking media with stock standards for 2 levels of controls (0.8 μg/mL and 16 μg/mL). Samples were prepared in 96-well plates by the addition of 10 µL of calibrator, quality control, or sample to 190 µL 0.1% formic acid in water containing 1 μg/mL linezolid-d3 followed by vortex. Chromatographic separation was achieved on an Acquity ultra-performance liquid chromatography (UPLC) HSS T3 1.8-μm 50 × 2.1-mm analytical column (Waters) maintained at 30°C at a flow of 0.2 mL/minute with a binary gradient with a total run time of 6 minutes. The compounds were detected by MS/MS using positive ESI with a dwell time of 15 ms. The observed ions (m/z) values of the fragment ions were linezolid (m/z 338 → 296) and linezolid-d3 (m/z 341 → 297). Sample injection and separation was performed by an Acquity UPLC interfaced with a Xevo TQ mass spectrometer (Waters). All data were collected using MassLynx version 4.1 SCN810. The within-day and between-day percentage coefficient of variation was 3%–8%.
Pharmacokinetic and PK/PD Modeling
The number of THP-1 macrophages and the cell volume in each 1-mL sample were identified using an automated Coulter counter. The total combined cell volume was calculated by multiplying the number of cells in each sample by the volume of each cell. The cells were then spun, and supernatant removed, followed by suspension and lysis in 1 mL PBS. Next, linezolid intracellular and extracellular concentrations were co-modeled in ADAPT software. First, a 1-compartment, 2-compartment, and 3-compartment model was assumed, and model parameters were generated. The best compartmental model was then chosen using Akaike information criteria, Bayesian information criteria, and parsimony. Pharmacokinetic parameter estimates in each chosen model were then used to calculate the AUC0–24, AUC0–24/MIC, %TMIC, and peak/MIC in each HFS. Protein binding was 30% [20, 21]. The relationship between total bacterial burden and linezolid exposure was examined using the inhibitory sigmoid Emax model, whose parameters include maximal kill (Emax) in log10 CFU/mL, the effective concentration mediating 50% of Emax (EC50), bacterial burden in nontreated systems (Econ), and the Hill slope (H).
RESULTS
The linezolid MIC identified using both broth macrodilution and Etest methods on 2 separate occasions each was 1.0 mg/L. The microbial kill of intracellular Mtb by linezolid in 12-well plates revealed the inhibitory sigmoid Emax relationship shown in Figure 1. Compared to non-drug-treated controls, treatment with static concentrations of linezolid for 14 days resulted in an Emax of 2.63 ± 1.29 log10 CFU/mL and an EC50 of 3.27 ± 3.4 mg/L (r2 = 0.93). The effective concentration associated with 80% of Emax (EC80), defined as “optimal,” was a linezolid concentration of 14.75 mg/L, which calculates to an AUC0–24 of 354 mg × hour/L.
Figure 1.

Concentration vs effect of linezolid in 12-well plates. A, Time-kill curves of varying concentrations of linezolid on days 3, 7, and 14. B, Exposure-effect relationship of linezolid and Mycobacterium tuberculosis using the inhibitory sigmoid maximal microbial kill model on day 14. Abbreviations: CFU, colony-forming units; EC50, effective concentration mediating 50% of maximal kill; Emax, maximal kill; Mtb, Mycobacterium tuberculosis.
In the HFS, linezolid concentrations were best described by a 2-compartment model made up of extracellular and intracellular compartments with different pharmacokinetic parameters. The model vs predicted concentrations are shown in Figure 2. The r2 was 0.89, with a slope of 0.94 (95% confidence interval, .87–1.01), which means that there was minimal to no bias. The linezolid extracellular pharmacokinetic parameter estimates were a total clearance of 4.55 ± 0.64 × 10⁻² L/hour and a volume of 0.173 ± 0.039 L, which translates to a half-life of 2.64 ± 0.38 hours. This differed from the intracellular compartment, which was characterized by a clearance of 0.142 ± 0.158 × 10⁻² L/hour and a volume of 0.019 ± 0.006 L, which translates to a half-life of 8.93 ± 1.30 hours. Thus, linezolid clearance from the macrophages was about 32-fold lower than from extracellular compartment, which accounted for the 3.2 ± 3.0-fold higher intracellular linezolid AUC0–24 compared with extracellular compartment.
Figure 2.

Two-compartment model of predicted vs observed linezolid concentrations in the hollow fiber system. The regression line and r2 of 0.89 show that the model described the data well.
We examined the PK/PD index that drove microbial kill, using the extracellular compartment (equivalent to “plasma”) exposures, and found that AUC0–24 /MIC ratios had the highest r2 on each of the sampling days, compared to either peak/MIC or %TMIC. As an example, on day 7 the r2 for AUC0–24/MIC was 0.98, that for peak/MIC 0.92, and that for %TMIC 0.93. Stated differently, the likelihood ratio, calculated using Akaike information criteria, of AUC0–24/MIC being the primary PK/PD driver compared with peak/MIC was 54.33, while that compared to %TMIC was 1.77. The relationship between AUC0–24/MIC and bacterial burden on day 7 is shown in Figure 3A. On day 28, at the end of the experiment, the r2 for AUC0–24/MIC was 0.92, that for peak/MIC 0.44, and that for %TMIC 0.84. The relationship of AUC0–24/MIC vs Mtb burden on day 28 is shown in Figure 3B. As can be seen in Figure 3, the EC50 changed with time, as did the r2 for the AUC0–24/MIC and peak/MIC ratios, consistent with other tuberculosis studies in the past [22]. However, the Emax did not change significantly between days 7 and 28. Based on the day 28 relationship, the EC80 was an AUC0–24/MIC ratio of 23.37 ± 1.16. In contrast, as regards linezolid-resistant subpopulation, our assay failed to discriminate between the drug-resistant and drug-susceptible subpopulations; thus, the PK/PD parameters associated with acquired drug resistance could not be determined.
Figure 3.

Linezolid exposure-effect curves in the hollow fiber system. A, The 0- to 24-hour area under the concentration-time curve to minimum inhibitory concentration ratio (AUC0–24/MIC) vs Mycobacterium tuberculosis (Mtb) burden (colony-forming units [CFU]) on day 7 is described by the equation shown, with an effective concentration mediating 50% of maximal kill (EC50) that was an AUC0–24 /MIC of 3.3 ± 0.52. B, By day 28, the EC50 had increased 7-fold, consistent with changes and “wobbles” seen in the treatment of tuberculosis with other antibiotics in the past [20].
We performed RNA-Seq on the infected THP-1 cells on each sampling day; the quality control scores are shown in Figure 4A. The figure shows that high-quality sequencing was achieved. Next, we realigned the sequences to the human genome, which was achieved successfully (Figure 4B). Next, as the dose of 10 mg/kg twice a day is associated with high rates of adverse events in the treatment of tuberculosis, we used the day 21 human RNA dataset for that linezolid exposure achieved by that dose to identify DEGs on exposure to linezolid compared with non-linezolid-treated HFS cultures, based on a Bonferroni-adjusted P ≤ .05. We identified 414 DEGs, which are shown in supplementary dataset 1. KEGG analyses revealed that the largest number of DEGs (35) mapped to ribosomes, whereas 20 DEGs mapped to metabolic pathways, of which 15 were associated with mitochondrial electron transport chain (ETC) complexes. By the numbers, the most important transcript signature was for genes encoding ribosomal proteins and rRNAs. Table 1 shows that 2 of the 4 human rRNAs, both mitochondria encoded, were downregulated. Under normal circumstances, ribosomal proteins are produced coordinately with rRNA in equimolar amounts. However, the major surprise in Table 2 is that genes for 29 (36%) of the entire 80-gene ribosomal protein repertoire were dramatically upregulated; 2 additional ones were pseudogenes.
Figure 4.
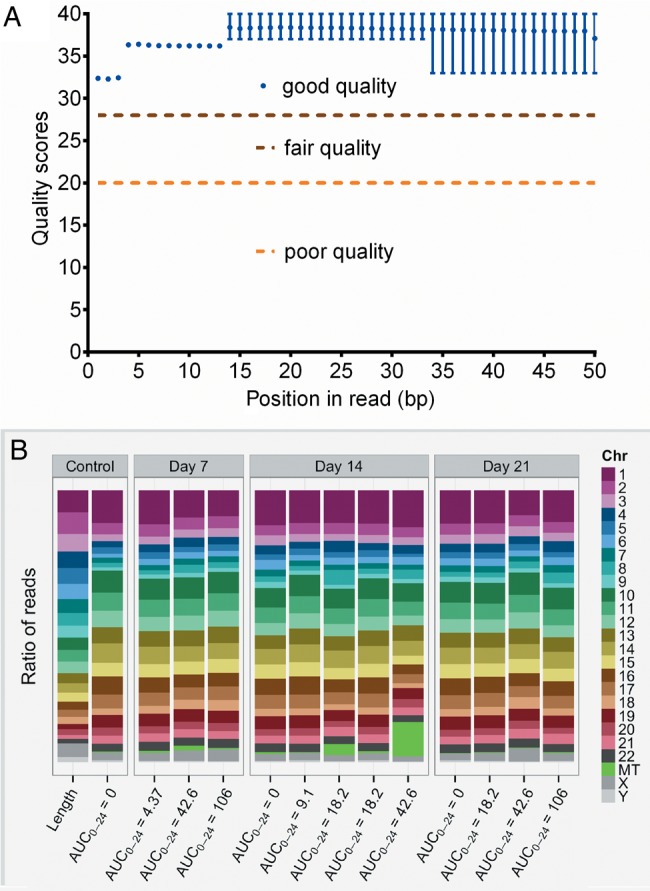
Quality control of RNA-Seq and realignment of reads. A, The distribution of PHRED scores for each base in sequenced Homo sapiens gene reads, generated using FastQC version 0.11.3. The x-axis shows the position of the base from the 5′ to 3′ end; the y-axis shows the quality score. All samples showed a similar distribution, and had high quality scores. B, Realignment showing reads per human chromosome. The first column shows the ratio of the length of each chromosome to the size of the genome. Each subsequent column is from a hollow fiber system sample, labeled by linezolid exposure and day of sampling, and shows the ratio of the number of reads aligned to a given chromosome against the total number of reads that aligned: In other words, it is normalized to the length of chromosome. If gene expression were constant across the genome, we would expect the ratio of reads per chromosome to more closely match ratio of chromosome length to genome size. Abbreviations: AUC0–24, 0- to 24-hour area under the concentration-time curve; Chr, chromosome.
Table 1.
Differentially Expressed Genes Encoding Ribosomal Proteins
| Gene | Fold Change | Bonferroni-Adjusted P Value | Gene Name |
|---|---|---|---|
| FAU | 27.44 | 0 | Ribosomal protein S30 |
| RNR1 | −7.24 | 1.17 × 10−45 | RNA, ribosomal 1 |
| RNR2 | −5.21 | 5.09 × 10−39 | RNA, ribosomal 2 |
| RPL10A | 1055.17 | 4.04 × 10−03 | Ribosomal protein L10a |
| RPL11 | 114.56 | 0 | Ribosomal protein L11 |
| RPL17 | 9.03 | 0 | Ribosomal protein L17 |
| RPL19 | 254.68 | 0 | Ribosomal protein L19 |
| RPL23 | 25.5 | 2.24 × 10⁻¹¹ | Ribosomal protein L23 |
| RPL23A | 56.16 | 1.05 × 10−06 | Ribosomal protein L23a |
| RPL24 | 14.25 | 0 | Ribosomal protein L24 |
| RPL26 | 22.17 | 4.54 × 10−09 | Ribosomal protein L26 |
| RPL26P16 | 8976.51 | 0 | Ribosomal protein L26 pseudogene 16 |
| RPL27 | 8.74 | .02 | Ribosomal protein L27 |
| RPL29 | 27.43 | 3.56 × 10−07 | Ribosomal protein L29 |
| RPL30 | 3.3 | .02 | Ribosomal protein L30 |
| RPL31P38 | 13.85 | 0 | Ribosomal protein L31 pseudogene 38 |
| RPL32 | 35.29 | 8.64 × 10−04 | Ribosomal protein L32 |
| RPL34 | 18 | 9.40 × 10⁻¹⁰ | Ribosomal protein L34 |
| RPL35 | 4673.16 | 0 | Ribosomal protein L35 |
| RPL36A | 3798.45 | 0 | Ribosomal protein L36a |
| RPL37 | 10.96 | 0 | Ribosomal protein L37 |
| RPL37A | 9.32 | 2.03 × 10−06 | Ribosomal protein L37a |
| RPL38 | 6.62 | 1.36 × 10−03 | Ribosomal protein L38 |
| RPL39 | −19.55 | 1.89 × 10−06 | Ribosomal protein L39 |
| RPL4 | 9.64 | 1.03 × 10−03 | Ribosomal protein L4 |
| RPL5 | 11.4 | 0 | Ribosomal protein L5 |
| RPL8 | 37.33 | 3.91 × 10−03 | Ribosomal protein L8 |
| RPLP2 | 1070.54 | 1.42 × 10−04 | Ribosomal protein, large, P2 |
| RPS23 | 126.01 | 5.48 × 10−05 | Ribosomal protein S23 |
| RPS25 | 17.7 | 1.64 × 10⁻¹⁰ | Ribosomal protein S25 |
| RPS27 | 4632.88 | 0 | Ribosomal protein S27 |
| RPS3 | 27.96 | 7.91 × 10−04 | Ribosomal protein S3 |
| RPS3A | 896.05 | 7.94 × 10−04 | Ribosomal protein S3A |
| RPS6 | 3118.06 | 0 | Ribosomal protein S6 |
| RPS7 | 703.25 | .02 | Ribosomal protein S7 |
| RPS8 | 5.86 | 6.42 × 10−04 | Ribosomal protein S8 |
| RSL24D1 | 112.42 | 1.87 × 10−05 | Ribosomal L24 domain containing 1 |
Table 2.
Coefficient of Determination for Concentration Versus RNA Read in an Inhibitory Model for Mitochondrial Dysfunction
| Enzyme Complex | Gene | AUC0–24 | Cmax | Trough | Trough (Intracellular) |
|---|---|---|---|---|---|
| Complex I | ND1 | 0.52 | 0.27 | 0.27 | 0.27 |
| ND2 | NC | 0.63 | NC | 0.6 | |
| ND3 | 0.44 | 0.18 | 0.13 | 0.13 | |
| ND4 | NC | NC | NC | 0.1 | |
| ND4L | 0.64 | 0.54 | NC | NC | |
| ND6 | NC | 0.40 | 0.12 | 0.41 | |
| Complex III | CYTB | 0.83 | 0.72 | 0.15 | 0.22 |
| Complex IV | COX1 | 0.77 | 0.66 | 0.14 | 0.18 |
| COX2 | 0.40 | 0.35 | 0.35 | ||
| COX3 | 0.46 | 0.28 | 0.34 | 0.34 | |
| COX5B | 0.89 | 0.82 | NC | 0.12 | |
| Complex V | ATP5B | 0.98 | 0.98 | NC | 0.41 |
| ATP6 | 0.88 | 0.83 | 0.12 | 0.22 | |
| ATP8 | 0.12 | 0.12 | 0.12 | 0.12 | |
| Chromosome 15 | ALDH1A2 | 0.13 | NC | 0.57 | 0.68 |
Boldface indicates highest r2 among concentration measures.
Abbreviations: AUC0–24, 0- to 24-hour area under the concentration-time curve; Cmax, maximal concentration; NC, no convergence.
The second largest number of DEGs encoded, among others, complex I and complex IV enzymes of the ETC, known to be inhibited by linezolid in patients with toxicity [10, 13]. The genes are shown in Table 2. Thus, using a nonbiased genome-wide approach, we identified inhibition of the genes encoding the ETC proteins that are the most commonly cited for clinical cases of linezolid toxicity, which is reassuring. In addition, Table 2 shows that we also identified significantly downregulated genes that encode complex III and V enzymes. We modeled for inhibitor (linezolid) concentration vs normalized RNA-Seq reads using the inhibitory sigmoid Emax equation, with Table 2 showing that the inhibition of the mitochondrial enzyme genes was linked to the AUC0–24, based on the highest r2. Linezolid trough had the highest r2 only for ND6. Next, we used the inhibitory model concentration mediating 50% of maximal inhibition (IC50) as the target threshold, as a 50% reduction in enzyme activity is most commonly observed in patients with symptomatic linezolid toxicity [13]. We found that both the IC50 and DEG reads varied widely, depending on type of ETC enzyme encoded, as would be expected. Therefore, we selected only mitochondria-encoded ETC genes and utilized the 95% confidence limits of the IC50 to identify the following AUC0–24 (mg × hour/L) thresholds associated with inhibition: ND3 threshold was 234, CYTB was 164, COX1 was 127.7, ATP6 was 431.1, and ATP5B was 93.75. The lowest of these is the AUC0–24 of 93.75 mg × hour/L, which we propose as the target AUC0–24 above which there is an increase in mitochondrial toxicity.
DISCUSSION
Clinical studies in children from India have shown that specific antibiotic concentration thresholds are associated with treatment failure and death [23]. In children <3 years of age, the threshold concentrations based on failure of therapy were isoniazid AUC0–24 <11.95 mg/L × hour and/or rifampin peak <3.10 mg/L. This means that there are specific antibiotic target concentrations that need to be achieved for optimal clinical outcome in children, and these differed from those identified in adults [23, 24]. Here, we established the same using the HFS model for intracellular tuberculosis and pediatric linezolid concentration-time profiles. We found that linezolid efficacy was linked to the AUC0–24/MIC ratio. This is similar to our published and unpublished results of sutezolid and linezolid in the murine model of tuberculosis [25], but differs from the findings of Brown et al that identified trough/MIC as the PK/PD parameter [26]. Interestingly, whereas the EC50 changed between days 7 and 28, the Emax did not improve. Nevertheless, the linezolid still killed below stasis. We identified an AUC0–24/MIC ratio of 24 as the EC80, indicating that this is the target exposure that must be achieved for optimal efficacy when linezolid is dosed for treatment of disseminated tuberculosis in children. In adults, the PK/PD exposures associated with sputum conversion and relapse, identified in the HFS using the inhibitory sigmoid Emax model, were within 94% of those observed in patients months to years after the forecast in the HFS [16–18]. The predictive accuracy of the HFS also appears to extend to combination therapy [27, 28]. It should be noted that this differs from the AUC0–24/MIC ratio that we have identified as the target for sterilizing effect in the HFS for adults [29]. This is likely because of the high intracellular linezolid accumulation. This high intracellular concentration of linezolid allows for reduction in the quantity of dose required to achieve the optimal exposure even when taking into account the increased metabolism observed in younger children. In the absence of intracellular accumulation, a much larger dose would be required given rapid systemic clearance in younger children.
We identified 2 major transcript signatures on exposure to linezolid, likely relevant to toxicity. The first was upregulation of RNA encoding ribosomal proteins by linezolid, hitherto not described in relationship to any antibiotic, to the best of our knowledge. Linezolid kills bacteria via binding to bacterial 50S ribosomal subunit to inhibit translation at the initiation phase of protein synthesis, which is selective against bacteria [30, 31]. It would have been expected that due to some overlap, there would be general downregulation of ribosomal proteins. Thus, the remarkable extents of gene upregulation of up to 4670-fold encountered with linezolid are surprising. Because RNA-Seq reads have very high correlation to findings at the level of protein abundance, as opposed to standard expression arrays, it is likely that our findings will be reflected at the level of protein expression. The clinical manifestations of this transcript signature, if any, are as yet unclear, but our discovery merits further studies in how this could play a role in the adverse events from linezolid.
The RNA-Seq analysis also identified reduced expression of genes encoding the ETC, a well-known target of mitochondrial toxicity. Song et al linked linezolid toxicity to trough concentrations in tuberculosis patients; however, that study did not evaluate correlation with AUC0–24 [32]. Brown et al also identified trough as correlating with linezolid toxicity in an HFS model [26]. Here, we found that linezolid toxicity was more closely linked to AUC0–24 as opposed to trough. Based on this relationship, we identified an AUC0–24 threshold for ETC gene inhibition. We propose that this threshold concentration should be avoided if linezolid concentration-mediated toxicity is to be minimized.
We performed the current studies to inform linezolid dosing in children with tuberculosis. Dosing requires a balance between optimal efficacy and concentration-driven toxicity. Figure 5 is a hypothetical scheme on how such doses could be identified. The goal of dose identification should be to aim for the concentration zone or area above the EC80 but below which there is concentration-mediated toxicity. The current study enabled us to identify that target zone for optimal linezolid dose in children with disseminated tuberculosis, as shown elsewhere in this supplement [33].
Figure 5.
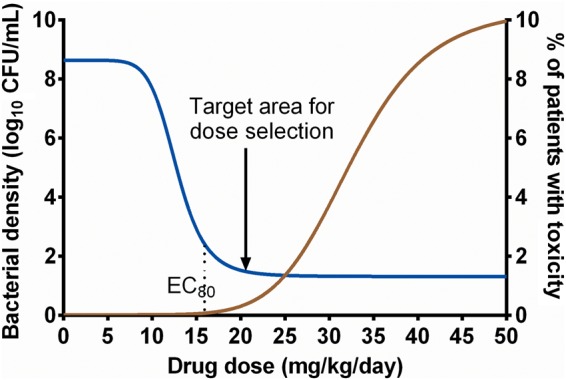
A hypothetical depiction of exposure effects for both efficacy and toxicity. A dose targeting the window shown would achieve optimal kill while minimizing dose-mediated toxicity in children with disseminated tuberculosis. In other words, doses used to treat disseminated tuberculosis in infants and toddlers should be aimed, not just derived from those of adults. Abbreviations: CFU, colony-forming units; EC80, effective concentration associated with 80% of maximal kill.
There are some limitations to our study. First, we failed to capture the linezolid-resistant subpopulation due to limitations of the assay we used. More likely, however, this may be because the starting intracellular bacterial burden was 5.28 log10 CFU/mL, which was below the inverse of linezolid mutation frequency. Tuberculosis in children is a paucibacillary state, unlike the large bacterial burden in cavitary tuberculosis. Second, a single strain of Mtb was used throughout the study. Examination of more isolates in the PK/PD studies would be preferable. However, macrophages are unlikely to survive long enough to complete 28-day studies, given the virulence of clinical strains. Nevertheless, to our knowledge, our experiments provide the first evidence of optimal target exposures for killing the intracellular Mtb populations that predominate in children with disseminated and intrathoracic tuberculosis. We also identified a threshold linezolid AUC0–24 above which higher exposures are likely to lead to higher rates of adverse events. In addition, we discovered a new major transcriptional signature that could have relevance as a biomarker for linezolid toxicity.
Notes
Author contributions. T. G. and E. N. designed the study; D. D., S. S., and T. G. performed the hollow fiber studies; S. J. Bush performed bioinformatics work. D. D. wrote the first draft of the manuscript; D. D., S. S., E. N., J. G. P., S. S., and T. G. wrote the manuscript.
Financial support. Funding for this study was provided by the National Institute of Allergy and Infectious Diseases of the National Institutes of Health (grant number R56 AI111985).
Supplement sponsorship. This article appears as part of the supplement “A Development Paradigm for Novel Combination Regimens for Multidrug-Resistant and Drug-Susceptible Tuberculosis in Children: FLAME for Work and Play,” sponsored by the Center for Infectious Diseases Research and Experimental Therapeutics (CIDRET), Baylor Institute for Immunology Research, Baylor Research Institute.
Potential conflicts of interest. T. G. is a consultant for Astellas Pharma USA and LuminaCare solutions, and founded Jacaranda Biomed, Inc. All other authors report no potential conflicts. All authors have submitted the ICMJE Form for Disclosure of Potential Conflicts of Interest. Conflicts that the editors consider relevant to the content of the manuscript have been disclosed.
References
- 1.Lee M, Lee J, Carroll MW et al. Linezolid for treatment of chronic extensively drug-resistant tuberculosis. N Engl J Med 2012; 367:1508–18. [DOI] [PMC free article] [PubMed] [Google Scholar]
- 2.Garcia-Prats AJ, Rose PC, Hesseling AC, Schaaf HS. Linezolid for the treatment of drug-resistant tuberculosis in children: a review and recommendations. Tuberculosis (Edinb) 2014; 94:93–104. [DOI] [PubMed] [Google Scholar]
- 3.Jungbluth GL, Welshman IR, Hopkins NK. Linezolid pharmacokinetics in pediatric patients: an overview. Pediatr Infect Dis J 2003; 22:S153–7. [DOI] [PubMed] [Google Scholar]
- 4.Datta M, Swaminathan S. Global aspects of tuberculosis in children. Paediatr Respir Rev 2001; 2:91–6. [DOI] [PubMed] [Google Scholar]
- 5.Marais BJ, Gie RP, Schaaf HS, Hesseling AC, Enarson DA, Beyers N. The spectrum of disease in children treated for tuberculosis in a highly endemic area. Int J Tuberc Lung Dis 2006; 10:732–8. [PubMed] [Google Scholar]
- 6.Starke JR. Pediatric tuberculosis: time for a new approach. Tuberculosis (Edinb) 2003; 83:208–12. [DOI] [PubMed] [Google Scholar]
- 7.Deshpande D, Srivastava S, Meek C, Leff R, Hall GS, Gumbo T. Moxifloxacin pharmacokinetics/pharmacodynamics and optimal dose and susceptibility breakpoint identification for treatment of disseminated Mycobacterium avium infection. Antimicrob Agents Chemother 2010; 54:2534–9. [DOI] [PMC free article] [PubMed] [Google Scholar]
- 8.Deshpande D, Srivastava S, Meek C, Leff R, Gumbo T. Ethambutol optimal clinical dose and susceptibility breakpoint identification by use of a novel pharmacokinetic-pharmacodynamic model of disseminated intracellular Mycobacterium avium. Antimicrob Agents Chemother 2010; 54:1728–33. [DOI] [PMC free article] [PubMed] [Google Scholar]
- 9.Srivastava S, Pasipanodya JG, Ramachandran G et al. A long-term co-perfused disseminated tuberculosis-3D liver hollow fiber model for both drug efficacy and hepatotoxicity in babies. EBioMedicine 2016; 6:126–38. [DOI] [PMC free article] [PubMed] [Google Scholar]
- 10.De Vriese AS, Coster RV, Smet J et al. Linezolid-induced inhibition of mitochondrial protein synthesis. Clin Infect Dis 2006; 42:1111–7. [DOI] [PubMed] [Google Scholar]
- 11.Apodaca AA, Rakita RM. Linezolid-induced lactic acidosis. N Engl J Med 2003; 348:86–7. [DOI] [PubMed] [Google Scholar]
- 12.Chiappini E, Conti C, Galli L, de Martino M. Clinical efficacy and tolerability of linezolid in pediatric patients: a systematic review. Clin Ther 2010; 32:66–88. [DOI] [PubMed] [Google Scholar]
- 13.Garrabou G, Soriano A, Lopez S et al. Reversible inhibition of mitochondrial protein synthesis during linezolid-related hyperlactatemia. Antimicrob Agents Chemother 2007; 51:962–7. [DOI] [PMC free article] [PubMed] [Google Scholar]
- 14.Garazzino S, Krzysztofiak A, Esposito S et al. Use of linezolid in infants and children: a retrospective multicentre study of the Italian Society for Paediatric Infectious Diseases. J Antimicrob Chemother 2011; 66:2393–7. [DOI] [PubMed] [Google Scholar]
- 15.McKee EE, Ferguson M, Bentley AT, Marks TA. Inhibition of mammalian mitochondrial protein synthesis by oxazolidinones. Antimicrob Agents Chemother 2006; 50:2042–9. [DOI] [PMC free article] [PubMed] [Google Scholar]
- 16.Gumbo T, Pasipanodya JG, Nuermberger E, Romero K, Hanna D. Correlations between the hollow fiber model of tuberculosis and therapeutic events in tuberculosis patients: learn and confirm. Clin Infect Dis 2015; 61(suppl 1):S18–24. [DOI] [PubMed] [Google Scholar]
- 17.Gumbo T, Pasipanodya JG, Romero K, Hanna D, Nuermberger E. Forecasting accuracy of the hollow fiber model of tuberculosis for clinical therapeutic outcomes. Clin Infect Dis 2015; 61(suppl 1):S25–31. [DOI] [PubMed] [Google Scholar]
- 18.Pasipanodya JG, Nuermberger E, Romero K, Hanna D, Gumbo T. Systematic analysis of hollow fiber model of tuberculosis experiments. Clin Infect Dis 2015; 61(suppl 1):S10–7. [DOI] [PubMed] [Google Scholar]
- 19.Døssing M, Vølund A, Poulsen HE. Optimal sampling times for minimum variance of clearance determination. Br J Clin Pharmacol 1983; 15:231–5. [DOI] [PMC free article] [PubMed] [Google Scholar]
- 20.Lepak AJ, Marchillo K, Pichereau S, Craig WA, Andes DR. Comparative pharmacodynamics of the new oxazolidinone tedizolid phosphate and linezolid in a neutropenic murine Staphylococcus aureus pneumonia model. Antimicrob Agents Chemother 2012; 56:5916–22. [DOI] [PMC free article] [PubMed] [Google Scholar]
- 21.Stalker DJ, Jungbluth GL. Clinical pharmacokinetics of linezolid, a novel oxazolidinone antibacterial. Clin Pharmacokinet 2003; 42:1129–40. [DOI] [PubMed] [Google Scholar]
- 22.Musuka S, Srivastava S, Siyambalapitiyage Dona CW et al. Thioridazine pharmacokinetic-pharmacodynamic parameters “wobble” during treatment of tuberculosis: a theoretical basis for shorter-duration curative monotherapy with congeners. Antimicrob Agents Chemother 2013; 57:5870–7. [DOI] [PMC free article] [PubMed] [Google Scholar]
- 23.Swaminathan S, Pasipanodya J, Ramachandran G et al. Drug concentration thresholds predictive of therapy failure and death in children with tuberculosis: bread crumb trails in random forests. Clin Infect Dis 2016; 63(suppl 3):S63–74. [DOI] [PMC free article] [PubMed] [Google Scholar]
- 24.Pasipanodya JG, McIlleron H, Burger A, Wash PA, Smith P, Gumbo T. Serum drug concentrations predictive of pulmonary tuberculosis outcomes. J Infect Dis 2013; 208:1464–73. [DOI] [PMC free article] [PubMed] [Google Scholar]
- 25.Williams KN, Stover CK, Zhu T et al. Promising antituberculosis activity of the oxazolidinone PNU-100480 relative to that of linezolid in a murine model. Antimicrob Agents Chemother 2009; 53:1314–9. [DOI] [PMC free article] [PubMed] [Google Scholar]
- 26.Brown AN, Drusano GL, Adams JR et al. Preclinical evaluations to identify optimal linezolid regimens for tuberculosis therapy. MBio 2015; 6:e01741–15. [DOI] [PMC free article] [PubMed] [Google Scholar]
- 27.Pasipanodya J, Gumbo T. An oracle: antituberculosis pharmacokinetics-pharmacodynamics, clinical correlation, and clinical trial simulations to predict the future. Antimicrob Agents Chemother 2011; 55:24–34. [DOI] [PMC free article] [PubMed] [Google Scholar]
- 28.Gumbo T, Angulo-Barturen I, Ferrer-Bazaga S. Pharmacokinetic-pharmacodynamic and dose-response relationships of antituberculosis drugs: recommendations and standards for industry and academia. J Infect Dis 2015; 211(suppl 3):S96–106. [DOI] [PubMed] [Google Scholar]
- 29.Srivastava S, Deshpande D, Manthati V, Sherman C, Cirrincione K, Gumbo T. Linezolid has excellent sterilizing effect against Mycobacterium tuberculosis (Mtb) at less toxic doses of monotherapy and combination therapy. In: Interscience Conference on Antimicrobial Agents and Chemotherapy and International Congress of Chemotherapy Meeting 2015, San Diego, CA, 17–21 September 2015. [Google Scholar]
- 30.Shinabarger DL, Marotti KR, Murray RW et al. Mechanism of action of oxazolidinones: effects of linezolid and eperezolid on translation reactions. Antimicrob Agents Chemother 1997; 41:2132–6. [DOI] [PMC free article] [PubMed] [Google Scholar]
- 31.Barbachyn MR, Ford CW. Oxazolidinone structure-activity relationships leading to linezolid. Angew Chem Int Ed Engl 2003; 42:2010–23. [DOI] [PubMed] [Google Scholar]
- 32.Song T, Lee M, Jeon H-S et al. Linezolid trough concentrations correlate with mitochondrial toxicity- related adverse events in the treatment of chronic extensively drug- resistant tuberculosis. EBioMedicine 2015; 2:1627–33. [DOI] [PMC free article] [PubMed] [Google Scholar]
- 33.Srivastava S, Deshpande D, Pasipanodya J et al. Optimal clinical doses of faropenem, linezolid, and moxifloxacin in children with disseminated tuberculosis: Goldilocks. Clin Infect Dis 2016; 63(suppl 3):S102–9. [DOI] [PMC free article] [PubMed] [Google Scholar]