

Abstract
The dynamics of graphene growth on polycrystalline Pt foils during chemical vapor deposition (CVD) are investigated using in situ scanning electron microscopy and complementary structural characterization of the catalyst with electron backscatter diffraction. A general growth model is outlined that considers precursor dissociation, mass transport, and attachment to the edge of a growing domain. We thereby analyze graphene growth dynamics at different length scales and reveal that the rate-limiting step varies throughout the process and across different regions of the catalyst surface, including different facets of an individual graphene domain. The facets that define the domain shapes lie normal to slow growth directions, which are determined by the interfacial mobility when attachment to domain edges is rate-limiting, as well as anisotropy in surface diffusion as diffusion becomes rate-limiting. Our observations and analysis thus reveal that the structure of CVD graphene films is intimately linked to that of the underlying polycrystalline catalyst, with both interfacial mobility and diffusional anisotropy depending on the presence of step edges and grain boundaries. The growth model developed serves as a general framework for understanding and optimizing the growth of 2D materials on polycrystalline catalysts.
Keywords: Graphene, platinum, chemical vapor deposition, growth dynamics, modeling, domain shape
The catalytic growth of graphene and other two-dimensional (2D) materials on polycrystalline metal foils by chemical vapor deposition (CVD) has emerged as the most versatile and commercially viable technique for manufacturing continuous films to meet the industrial demand for electronic-grade material.1,2 Remarkable in this process is that continuous single-layer graphene can be produced over large areas (up to several square meters) on low-cost polycrystalline supports3,4 and can exhibit electronic properties comparable to those achieved by mechanical exfoliation of graphite.5 This also represents a unique case in crystal growth as the graphene remains confined to the quasi-2D surface of a bulk metal support, assuming the barrier to additional layer formation is sufficiently large.6 The catalyst support is therefore critical to CVD of 2D materials, where its structure can have a definitive influence on the properties of the material formed, including its thickness uniformity,6−9 domain size,10−15 and defect density.10,16
The ability to engineer these material properties to meet specific application requirements is one of the foremost goals of current 2D materials research. However, the extent to which the catalyst serves as a template for growth remains an open question, despite being one of the main levers alongside temperature and gas environment, available for controlling the growth outcome. Although there have been several efforts to elucidate epitaxial17−19 or pseudoepitaxial relationships20,21 between catalyst surfaces and the growing graphene, the influence of surface morphology including step edges and grain boundaries on growth dynamics is less well understood. The elevated temperatures and reactive gas environments under which growth occurs make direct observation challenging, while ex situ measurements are ambiguous as the catalyst surface may be highly dynamic and far from thermodynamic equilibrium during growth. Nevertheless, several attempts have been made to explain the growth dynamics by fitting ex situ microscopy data with established models of crystal growth,22,23 such as the Johnson–Mehl–Avrami–Kolmogorov (JMAK) model.24−29 In addition to the ambiguities associated with the post-mortem characterization, these studies suffer from sparse data points, given that a separate growth experiment must be performed for each point. Surface science techniques that enable the direct in situ imaging of graphene growth on the surface of carefully prepared single-crystalline samples under ultrahigh-vacuum conditions avoid many of these problems.18,30−32 However, there exists a substantial “pressure and material gap” between these studies and the actual conditions of large-area graphene deposition onto polycrystalline foils.2,33 Furthermore, existing theoretical frameworks used to analyze the growth dynamics of 2D materials suffer from a number of significant limitations. The JMAK model for example assumes a constant nucleation rate or a fixed number of nucleation sites, circular domain geometry, and constant, isotropic radial growth velocity, which may not be valid under realistic growth conditions.
Here, we apply in situ scanning electron microscopy (SEM) to directly observe graphene growth under realistic CVD conditions on polycrystalline Pt samples and combine this with structural characterization of the catalyst support to reveal the interplay between the graphene structure and that of the catalyst on which it forms. We find that established models of crystal growth, such as the JMAK equation, do not adequately describe the growth behavior observed on realistic polycrystalline catalysts, with major assumptions being violated, including those of constant nucleation rate, and a constant, isotropic growth rate. We therefore outline a general model for growth that considers precursor dissociation, mass transport (bulk, grain boundary, and surface diffusion), and attachment to the edge of a growing domain. In this context, we analyze graphene growth dynamics at different length scales (across multiple catalyst grains, for multiple graphene domains within a grain, and for a single graphene domain) to understand the rate-limiting steps in growth and how these influence the geometry of the graphene domains that ultimately define the microstructure of the continuous graphene film. We observe that growth is typically interface-attachment-limited immediately after nucleation, changing to diffusion-limited as the local carbon supersaturation is depleted, and eventually transitioning to dissociation-limited as graphene domains impinge on each other, isolating the surface from the precursor supply. Significantly, we find that as well as varying throughout the growth process, the rate-limiting step can vary across the catalyst surface, even between different facets of the same graphene domain.
When growth is interface-attachment-limited, the graphene domain shape is defined by the interfacial mobility, which varies as a function of both graphene lattice orientation and the catalyst grain orientation. The higher barrier for attachment to graphene facets embedded in step edges compared to nonembedded facets gives rise to domain shapes that lack rotational symmetry. As growth transitions toward being diffusion-limited, the effects of anisotropic surface diffusion become more dominant, with facet normals aligning with slow diffusion directions. This is particularly apparent close to regions of high local surface curvature, e.g., grain boundaries, where step edge densities are high and anisotropy in surface diffusion is correspondingly increased. We thereby reveal that the structure of CVD graphene films formed on polycrystalline catalyst foils is intimately related to that of the underlying catalyst.
Results and Discussion
We investigate the growth of graphene on polycrystalline Pt foils (25 μm, 99.99%, Alfa Aesar) by CVD using in situ SEM (see the Methods section). The samples are first annealed in H2 (10–4 mbar) at 900–1000 °C for 15 min to promote Pt grain growth and remove adventitious carbon from the surface of the foil and then exposed to C2H4 (10–6–10–4 mbar) at temperatures of 900–1000 °C, with SEM images (∼0.1 Hz frame rate) acquired throughout.
Figure 1 shows SE micrographs of the Pt surface during C2H4 exposure at different times during the growth. Prior to the introduction of the precursor (Figure 1A), the polycrystalline nature of the catalyst surface is apparent from the variations in contrast between different grains related to electron-channeling contrast7,34 and the topographical contrast arising from the network of grain boundaries separating them. The few small (<1 μm), bright features visible within some of the Pt grains are attributed to residual oxygen contamination of the Pt surface (as also observed in corresponding X-ray photoelectron spectroscopy measurements; not shown) and disappear early in the precursor exposure as they presumably react with carbonaceous species arriving at the surface. Although the precursor pressure within the chamber is reached within ∼15s (as confirmed by a residual gas analyzer), there is a distinct incubation period during which no graphene forms on any of the Pt grains. As the precursor exposure continues, faceted graphene domains appear on several Pt grains (Figure 1B). Their darker contrast compared to the bare Pt surface is related to the lower secondary electron generation of graphene.35 The graphene domains grow in size with time and merge with the other graphene domains upon which they impinge. Meanwhile, the nucleation of new graphene domains occurs on other Pt grains that show longer incubation times (Figure 1C). The incubation times of different Pt grains vary widely, with graphene domains nucleating on several grains within 90 s of the precursor being introduced, while others show no nucleation events even after >2500 s and only become covered with graphene due to the expansion of domains from adjacent Pt grains across grain boundaries (Figure 1D). This is attributable to grain orientation dependent variations in the precursor dissociation rate, graphene nucleation barrier, or both, which are likely to be affected by the density of low-coordination sites such as step edges.36 During graphene growth, we note that ripening of the Pt grains is also observed (compare panels A and D of Figure 1), again highlighting the need for in situ measurements when considering the relationship between the microstructure of the catalyst and 2D material.
Figure 1.
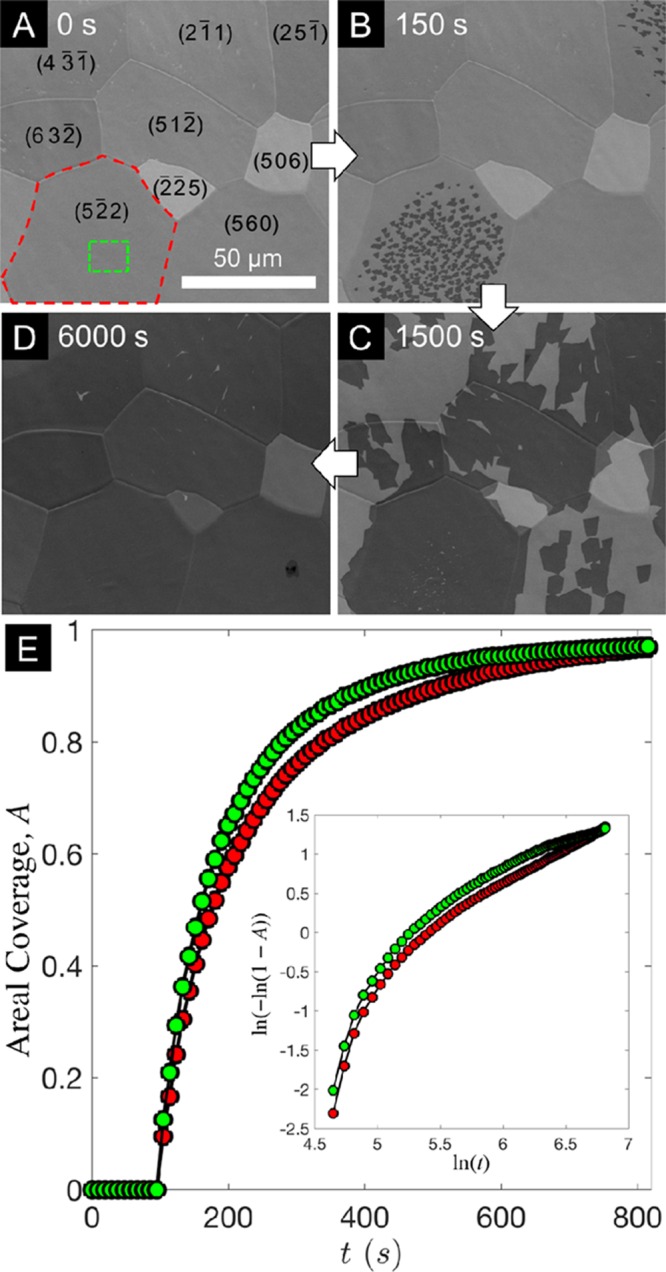
Graphene growth evolution on polycrystalline Pt. (A–D) Sequence of in situ SEM images of Pt (25 μm) during C2H4 (∼10–4 mbar) exposure at 900 °C, acquired 0 s (A), 150 s (B), 1500 s (C), or 6000 s (D) after precursor introduction. The approximate orientations of the Pt grains determined by EBSD analysis are indicated within the respective grains in (A). (E) Plot of the areal coverage of graphene, A, with C2H4 exposure time, t, for the regions marked with red and green boxes in (A). Inset: The same data plotted in terms of Avrami coordinates, ln(−ln(1 – A)) vs ln(t).
For any given Pt grain, after the first graphene domain appears, the nucleation of other domains occurs within a relatively short time frame (<60 s). The first nuclei typically form near the center of a Pt grain away from grain boundaries, and the nucleation density is also observed to be lower close to Pt grain boundaries (see, for example, Figure 1B). Figure 1E considers a single Pt grain (indicated by the red polygon in Figure 1A) and plots the areal graphene coverage, A, with time, t, for the entire grain (red) and for a region close to the center of the Pt grain (green square in Figure 1A). In both cases, A rises rapidly following the incubation period, but the rate of increase in A reduces over time, and complete single-layer graphene coverage is only slowly approached. The JMAK equation is widely applied to describe nucleation and growth during phase transformations29,37 and has previously been used to interpret ex situ graphene growth results on polycrystalline Cu.22 The inset of Figure 1E therefore plots the evolution of graphene areal coverage in terms of Avrami coordinates, ln (−ln (1 – A)) versus ln (t); however, the clearly nonlinear shape confirms that the JMAK equation does not adequately describe the increase in the area fraction with time.
In interpreting the observed growth behavior, it is instructive to consider the key processes involved in the growth of graphene on polycrystalline catalyst surfaces during CVD, as outlined in Figure 2. The dissociation of the precursor delivers carbon to the catalyst surface (Process 1), which can readily diffuse on the surface (Process 2). This carbon can attach to a graphene domain it encounters contributing to growth (Process 3) or can be removed from the surface by diffusion into the bulk (Process 4) or grain boundaries (Process 5), which serve as more rapid pathways for diffusion.11,38,39 While Processes 4 and 5 can also contribute to delivering carbon to the growing graphene domain, the lower activation barrier for surface diffusion means Process 2 is expected to dominate.40,41Figure 2 indicates the net directions of mass transport associated with these processes for typical graphene CVD conditions, as used herein, where the catalyst bulk is not initially filled with carbon and a net flux of carbon is delivered to the catalyst surface by precursor exposure. We note, however, that the net directions of mass transport associated with each of the processes can also be reversed depending on the processing conditions, corresponding to removal of surface carbon into the gas phase by etching, shrinking of graphene domains due to carbon removal, and the diffusion of carbon out from the bulk or grain boundaries.
Figure 2.
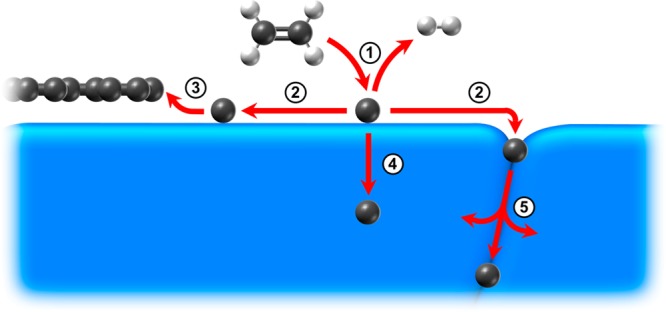
Graphene growth processes on a polycrystalline catalyst. Process 1: precursor dissociation supplies carbon to the catalyst surface. Process 2: surface diffusion transports carbon across the catalyst surface. Process 3: carbon attaches to the edge of a growing graphene domain. Process 4: carbon diffusion into the bulk of the catalyst removes carbon from the surface. Process 5: grain boundary diffusion serves as a more-rapid pathway for carbon removal from the surface.
While the JMAK equation is found to be inadequate in describing the behavior observed in Figure 1E, the evolution of A within an individual catalyst grain qualitatively resembles that obtained by consideration of an idealized single-crystalline surface with a semi-infinite bulk on which graphene growth is fed by the net flux arising from the supply and removal of carbon by Processes 1 and 4, respectively.7,9 The supply of carbon by Process 1 can be modeled based on the kinetic theory of gases, as being constant for a given grain orientation, precursor partial pressure, and temperature but reducing in proportion to the bare catalyst area (1 – A) as graphene coverage isolates the catalyst from the precursor supply. The removal of carbon by Process 4 can be modeled based on 1D Fickian diffusion perpendicular to the catalyst surface.7 This yields the following general behavior for a catalyst whose bulk is not initially filled with carbon: Upon the introduction of the precursor, the supply of carbon to the surface is matched by bulk diffusion, leading to an incubation period during which the carbon concentration close to the catalyst surface increases until the solubility limit is reached and a local supersaturation develops. This supersaturation feeds the nucleation and subsequent growth of graphene domains and is maintained by precursor dissociation on bare areas of the catalyst. As the graphene coverage increases, the supply of carbon to the surface by precursor dissociation is reduced while diffusion into the catalyst bulk still continues, meaning that growth slows and complete coverage is only gradually approached.
The dependence of the area fraction on time for the entire grain (red; Figure 1E) deviates slightly from that obtained from just the central region (green; Figure 1E), showing a slower initial growth rate and with full coverage approached more slowly. This is attributed to the contribution of Process 5 in which grain boundaries serve as pathways for rapid diffusion of carbon away from the catalyst surface. This additional pathway for carbon removal also reduces the supersaturation that develops in these areas, which accounts for the lower nucleation densities observed close to grain boundaries. Notably lower nucleation densities are observed close to the grain boundaries toward the top left of the grain compared to those toward the bottom right (see Figure 1B), consistent with the dependence of grain boundary diffusion coefficient on the structure of the grain boundary.42
While consideration of the balance of fluxes between Processes 1, 4, and 5 is useful in describing how the overall graphene coverage evolves within a platinum grain, i.e., the collective contribution of many graphene domains, this assumes Process 1 to be the rate-limiting step in growth and thus does not take Processes 2 and 3 into account, nor does it provide insights into the localized behavior of individual graphene domains such as how their shape and growth rate evolve. In modeling these processes, we consider the edge of a single graphene domain growing on the Pt surface where there exists a flux of carbon from the Pt surface to the graphene domain, Jsg, and vice versa, Jgs. This yields a net flux J that feeds the growth of the graphene edge, which by conservation of mass is related to the growth velocity normal to this edge, V:
| 1 |
cg is the concentration of carbon in graphene, and cI is the carbon concentration at the interface between the growing graphene domain and the bare Pt surface. Considering that attachment of carbon to the graphene edge is impeded by an energy barrier, ΔGa, and that for growth to proceed there must be a driving force, ΔG, for carbon attachment, we obtain the following expression (see the Supporting Information for detailed derivation):
| 2 |
M(θ,ϕ) is the interfacial mobility and incorporates the energy
barrier associated with carbon attachment, which can depend on the
angle of the edge relative to the graphene lattice, θ, and to
the orientation of the underlying metal substrate, ϕ, as we
will discuss further below. μs(cI) and μg are, respectively, the carbon
chemical potentials of the Pt surface at the edge of the graphene
domain and the graphene itself. For the case in which μs(cI) ≫ μg, eq 2 reveals that J → M(θ,ϕ) and, therefore,
growth is interface-attachment-limited. This situation arises when
a large supersaturation exists, such as immediately following nucleation.
When M(θ,ϕ) is small, J is also small, and initially the supersaturation
close to the growing edge can be readily replenished, such that cI is maintained near its far-field value, and
growth remains interface-attachment-limited. Thus, it follows from eq 1 that V remains constant. When M(θ,ϕ) is large, however, the supersaturation
near the growing edge is quickly depleted and cannot be replenished
fast enough to maintain cI near its far-field
value, and thus, μs(cI) → μg and local equilibrium is approached.
The driving force for growth is reduced, such that  , with cI determined
by diffusion of carbon across the catalyst surface and growth becoming
diffusion-limited. V is therefore now time-dependent,
varying as a function of cI. To precisely
determine this variation in V, the carbon diffusion
field around the graphene domain would need to be calculated (e.g.,
via the phase field method);43 however,
we can nevertheless consider its general trend at different stages
of growth. When the graphene domain is small, the concentration gradients
around the domain are steep, and as the domain becomes larger, these
gradients become smaller, meaning V will decrease
with time in the diffusion-controlled limit.44,45
, with cI determined
by diffusion of carbon across the catalyst surface and growth becoming
diffusion-limited. V is therefore now time-dependent,
varying as a function of cI. To precisely
determine this variation in V, the carbon diffusion
field around the graphene domain would need to be calculated (e.g.,
via the phase field method);43 however,
we can nevertheless consider its general trend at different stages
of growth. When the graphene domain is small, the concentration gradients
around the domain are steep, and as the domain becomes larger, these
gradients become smaller, meaning V will decrease
with time in the diffusion-controlled limit.44,45
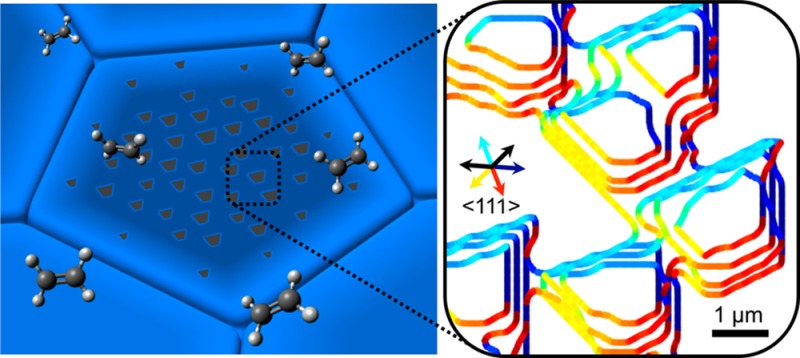
In the context of this model, and by measuring the interfacial velocities from the real-time data, we now consider the growth evolution of individual graphene domains in a region of the same Pt grain. Figure 3A shows how the graphene domains evolve across several time steps (160, 170, 180, and 190 s) for a region within the green square indicated in Figure 1A. The domains adopt a trapezoidal shape, with four major facets clearly identifiable. The growth velocities of facets growing toward the top left (colored cyan) are notably slower than those growing toward the bottom right (colored red), as is apparent from the different spacing of facets between isochrones. Figure 3B shows a histogram weighted according to facet length, revealing the angular distribution of the facets at a growth time of 170 s. The four major facets are aligned with ∼0°, ∼ 110°, ∼ 220°, and ∼290° and are found to remain dominant even as the graphene domains merge, although the histogram intensities vary somewhat, and thus, the domain morphology is self-similar between time stamps (see Video S1). Most significantly, the differences between the facet angles are not multiples of 30°, as might be expected if the graphene domain shapes were primarily determined by zigzag, armchair, or some other intermediate termination of the edges being most energetically favorable.12,46−48 Therefore, as the faceted shapes of the graphene domains cannot be attributed to the edge termination alone, the role of the underlying substrate must be considered. Electron backscatter diffraction (EBSD) patterns collected postgrowth reveal the bulk orientation of the underlying Pt grain whose surface lies close to the (52̅2) crystallographic plane. Previous LEED studies reveal that similarly oriented surfaces remain stable, maintaining their nominal structure when clean and under vacuum conditions and when covered with graphitic carbon following precursor exposure.49Figure 3C therefore shows a ball model of the corresponding unreconstructed Pt surface consisting of (111) terraces with (100)-like steps, with the step edges indicated by dashed red lines and the uphill direction indicated with an arrow. While these (111) terraces are not expected to reconstruct under the growth conditions used herein,50,51 we note that reconstruction of Pt(111) surfaces has been reported under certain conditions, albeit while maintaining hexagonal symmetry.50,51,54,55 For other Pt grain orientations, faceting, reconstruction of the surface, including changes in symmetry, or both may occur as for Pt(100), which is known to undergo a hexagonal reconstruction.52,53
Figure 3.

Growth kinetics of multiple graphene domains within a single Pt grain. (A) Sequence of overlaid isochrones extracted from SEM images taken 160, 170, 180, and 190 s after C2H4 introduction, showing domain edges for a region within the green box marked in Figure 1A. The orientations of the facet normals (defined as pointing out from the graphene domain to the substrate) are indicated by the line color. (B) Plot of the angular distribution of the graphene facet normals corresponding to the image taken after 170s in (A). (C) Ball model of the unreconstructed (52̅2) surface orientation of the underlying Pt grain, determined by EBSD measurements. Arrows indicate the six <111> directions that lie closest to the plane of the surface (see Figure S2A for other directions), with the four colored arrows corresponding to the similarly colored dominant graphene facet directions in (A). Red dashed lines highlight the step edges, with the uphill direction indicated by the labeled arrow.
Consideration of the low-index crystallographic directions of the Pt surface reveals a clear relationship with the dominant graphene facet orientations, which all lie normal to <111> directions. Under kinetic control, the domain shape will be dominated by the slowest growth directions. Given the dependence of V on M(θ,ϕ) and cI exemplified in eqs 1 and 2, these <111> directions are therefore expected to correspond to directions of low interfacial mobility,56 slow surface diffusion,57,58 or both. It is also apparent that the growth of the slower velocity facets toward the top left of the images (colored cyan) corresponds with growth in the uphill direction. This slow uphill growth is consistent with various surface science studies of graphene growth on low-index surfaces of single-crystalline substrates, which reveal that the uphill graphene facets can be embedded in the step edge and thus grow by a metal-etching mechanism.19,30,59−61 The slow velocity of these uphill facets accounts for the trapezoidal shape of the graphene domains, as they will dominate over the facets perpendicular to the two adjacent <111> directions (black arrows in the inset of Figure 2C).
This difference in uphill and downhill growth rate cannot be attributed to the delivery of carbon across the catalyst surface, as it persists even as the uphill and downhill facets of different domains approach one another, and an asymmetry in the uphill and downhill diffusivity of carbon species would violate the Onsager principle of microscopic reversibility, which holds for transport properties such as diffusion.62,63 Instead, it is attributable to a larger barrier for attachment to embedded facets, which presumably relates to the need to eject metal atoms from the step for carbon to be incorporated.19,30,59−61 This confirms that the interfacial mobility, M(θ,ϕ), varies between different facets and must be considered a function of both the facet direction relative to the graphene lattice, θ, and to the substrate orientation, ϕ. This can account for the more-diverse (including nonsymmetric) domain shapes that are experimentally observed, in contrast to previous models that typically assume an epitaxial alignment between the graphene lattice and substrate orientation and thus predict domain shapes with at least 2-fold rotational symmetry.43,64,65
Given the anisotropy in interfacial mobility that we have observed, it is insightful to consider the kinetics of each facet individually. Figure 4A shows the growth evolution of a single graphene domain that was grown under conditions of higher growth temperature and lower precursor partial pressure and maintains an irregular hexagonal shape throughout (see Video S2). The slow growth rate and large size of this domain, which results from the growth conditions, gives the necessary spatial and temporal resolution to more precisely consider the growth kinetics of each facet individually. A total of six major facets colored blue, navy, red, orange, green, and cyan (clockwise from the top facet) are apparent from early on and persist throughout the ensuing growth period. Figure 4B shows the variation in velocity of each of these facets with time based on the analysis of ∼100 frames that were acquired ∼9.5 s apart (see the Methods section). The velocities of the red and orange facets are seen to be constant throughout the growth period, indicating that their growth is interface-attachment-limited and independent of domain size. Conversely, the velocities of the blue and navy facets reduce over time as the particle grows, indicating that the growth of these facets is instead diffusion-limited. The cyan and green facets initially show constant growth velocities, but after some time, their velocities start to reduce, indicating that they transition from interface-attachment-limited to diffusion-limited growth. This clearly highlights that different facets within a single grain can show different rate-limiting steps that may evolve during growth.
Figure 4.

Facet-dependent growth kinetics for a single graphene domain. (A) Sequence of isochrones (spaced by ∼47.5 s) of the domain edges obtained from SEM images of Pt (25 μm) during C2H4 (∼10–5 mbar) exposure at 1000 °C, colored according to the orientations of the facet normals (defined as pointing out from the graphene domain to the substrate). (B) Plot of the facet velocities with time for the six major facet orientations apparent in A. (C) Ball model showing the unreconstructed (63̅5) surface orientation of the underlying Pt grain, determined by EBSD measurements. Arrows indicate the six <111> directions that lie closest to the plane of the surface (see Figure S2B for other directions) with the four colored arrows corresponding to the similarly colored dominant graphene facet directions in (A). Red dashed lines highlight the step edges, with the uphill direction indicated by the labeled arrow.
The bulk orientation of the underlying Pt grain is determined from postgrowth EBSD patterns, revealing that the surface lies close to the (63̅5) crystallographic plane, which again corresponds to a surface orientation that is not expected to facet or undergo a surface reconstruction either when clean and under vacuum or when covered with graphitic carbon.49 A sketch of the corresponding unreconstructed surface is therefore shown in Figure 4C, with the step edges indicated by red dashed lines. This reveals a close alignment of four of the domain’s facets (green, navy, cyan, and red) perpendicular to certain <111> directions (similarly colored arrows in the inset of Figure 4C), similar to that noted earlier for the multiple domain growth of Figure 3. These facets also happen to align with the step edges on the surface. We again observe a lower growth velocity for those facets growing uphill (green and cyan), i.e., the facets expected to be embedded in Pt steps, compared to those growing downhill (red and navy).
The navy facet is the fastest growing at the start of growth and thus corresponds to the highest mobility facet. Its diffusion-limited behavior throughout growth is consistent with the local carbon supersaturation ahead of it being rapidly depleted. The uphill growing facets (green and cyan) show much lower growth velocities at the start of growth and have correspondingly lower mobilities consistent with there being a larger barrier for attachment to embedded graphene facets. They thus remain interface-attachment-limited for a longer time, with the carbon supersaturation developed prior to nucleation feeding their growth, and transition to diffusion-limited growth as this supersaturation becomes depleted. Interestingly, the red and orange facets toward the bottom of the domain have higher mobilities but show interface-attachment-limited behavior throughout growth, suggesting that a relatively high local carbon supersaturation is maintained. Conversely, the blue facet toward the top of the domain has the lowest growth velocity and yet shows a diffusion-limited growth behavior consistent with the local carbon supersaturation being rather low. While SEM does not directly reveal the carbon supersaturation around the graphene domain, lower-magnification SEM images (not shown) show that no other domains nucleate near the top-left of the domain of interest, while other domains do nucleate toward the bottom-right. This would be consistent with a gradient in carbon supersaturation existing across the Pt grain increasing from the top-left to the bottom-right, which may relate to variations in the rates of carbon removal by different grain boundaries, differences in the precursor dissociation rates between adjacent Pt grains, or both. Alternatively, such differences in local carbon supersaturation could arise due to the shape of the graphene domain itself, as the local carbon supersaturation experienced by a facet is not only influenced by its own growth but also by the growth of neighboring facets.
Having considered the growth behavior of graphene domains within Pt grains, we now focus on the growth across grain boundaries, which is key to forming a continuous graphene layer over a polycrystalline catalyst surface. Figure 5 shows two sequences of SEM images (A–E and F–J) in which graphene domains that have nucleated on different Pt grains grow across Pt grain boundaries onto different areas of the same Pt grain, whose surface orientation is determined as (43̅1̅) by ex situ EBSD measurements. For both sequences, as the initially sharp apexes of each graphene domain (Figure 5A,F) approach the Pt grain boundaries, they are seen to drastically widen in the directions parallel to the grain boundaries (see, for example, Figure 4C,H), leading to a change in the facet directions even before the grain boundaries have been crossed. After crossing the grain boundary, the growing domains both adopt new facet orientations, as indicated by the dotted lines in Figure 5E,J. Notably, the facet orientations adopted by both domains after crossing onto the same Pt grain are closely aligned (compare the red, green, and blue dotted lines) despite the two domains nucleating on differently oriented Pt grains and thus presumably having different crystallographic orientations, θ. This similarity in graphene domain shapes cannot be attributed to the orientation of graphene lattice, i.e., any epitaxial relationship, but instead indicates that their shapes are predominantly determined by the underlying structure of the catalyst grain on which they both end up. Many of the facet normals again appear to align with certain <111> directions of the catalyst grains both before and after crossing the grain boundary, as indicated by the arrows colored orange in Figure 5A, purple in Figure 5F, and green and blue in Figure 5E,J. This highlights the importance of the substrate in influencing both interfacial mobility and diffusion of carbon species, with these <111> directions again expected to correspond to directions of low mobility, slow diffusion, or both. It is also apparent from Figure 5 that apexes of the graphene domains coincide with the positions of the Pt grain boundaries, indicating fast diffusion directions parallel to these boundaries. The grain boundaries are clearly visible in all images during growth due to the topographic contrast resulting from their high local curvature. This curvature corresponds to a high density of step edges close to the grain boundary, which run approximately parallel to it, as indicated in Figure 5K. The lower barrier to diffusion along the terraces compared to that of crossing step edges leads to anisotropic surface diffusion, which increases as the density of step edges increases (see Figure 5K). This increased anisotropy in surface diffusion accounts for the drastic widening of the graphene domains parallel to the grain boundary as it is approached. We note that for Pt, which has an fcc crystal structure, no anisotropy in bulk diffusivity is expected, and thus, these observations again highlight the dominant role of surface diffusion in determining domain shape. This higher density of step edges could also lead to a local increase in hydrocarbon dissociation rate; however, while we do not exclude this, we note that this alone cannot account for the faster growth rate parallel to the grain boundary, and in any case, the rapid removal of carbon by grain boundary diffusion is likely to dominate.
Figure 5.
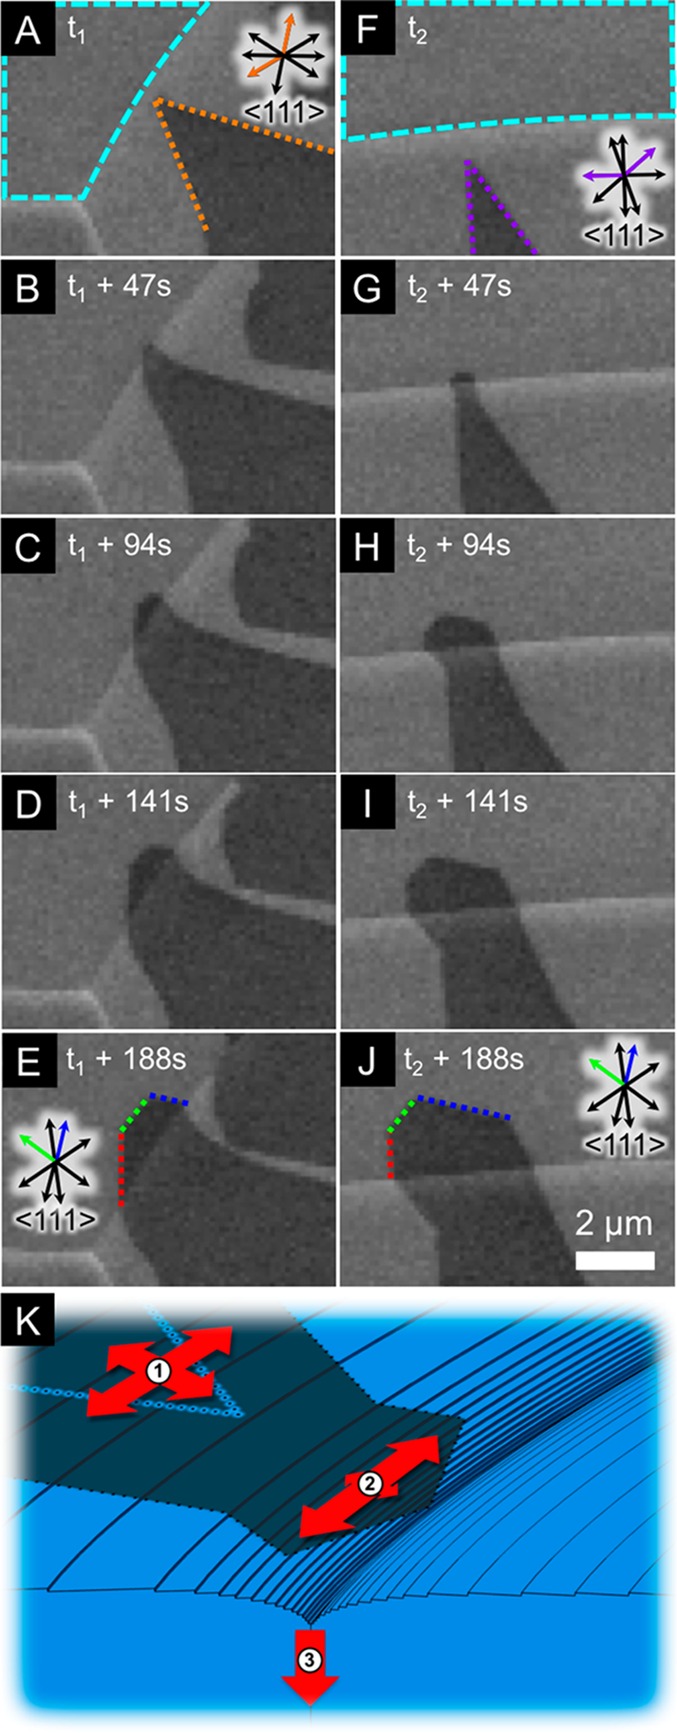
Graphene growth across grain boundaries. (A–E) Sequence of SEM images of a graphene domain (facets indicated with orange dotted lines in (A) that nucleated on a Pt grain with a (512̅) oriented surface, showing its growth across a grain boundary onto a Pt grain with a (43̅1̅) orientated surface. (F–J) Sequence of SEM images of a graphene domain (facets indicated with purple dotted lines in F) that nucleated on a Pt grain with a (632̅) oriented surface, showing its growth across a grain boundary onto a different region of the same (43̅1̅) orientated Pt grain as identified in (A) (surrounded by cyan dashed lines in (A) and (F)). The red, green, and blue dotted lines in (E) and (J) indicate similar facet orientations established on this Pt grain after the graphene domains have crossed from the differently oriented Pt grains where they nucleated. Pt grain orientations are assigned on the basis of postgrowth EBSD patterns. Arrows indicate the <111> directions of each catalyst grain (see Figure S2C–E), with the colored arrows corresponding to those <111> directions that lie normal to highlighted graphene facets. The growth conditions are identical to those of Figure 1. (K) Schematic of graphene growth across grain boundaries: (1) the higher barrier to surface diffusion of carbon across step edges than along terraces leads to an anisotropy in surface diffusion. (2) As a grain boundary is approached, the much-higher density of step edges increases this anisotropy in surface diffusion. (3) Grain boundary diffusion serves as a rapid pathway for carbon removal from the surface, reducing the local carbon concentration and slowing the growth rate of the graphene domain as the grain boundary is approached.
Our data reveal that Processes 1–5 identified in Figure 2 all play an influential role in determining the final growth outcome during graphene CVD. We therefore outline the following consistent picture of how these processes contribute to the growth behavior on realistic polycrystalline catalyst surfaces observed herein, as summarized in Figure 6: carbon is delivered to the catalyst surface by precursor dissociation, whose rate may vary across differently oriented, or reconstructed catalyst grains. This carbon supply is initially matched by diffusion into the catalyst bulk, giving a notable incubation time during which the catalyst becomes locally filled with carbon close to the surface, and a supersaturation then starts to develop (Figure 6B).7 Grain boundaries serve as rapid pathways for the diffusion of carbon away from the catalyst surface, leading to a lower supersaturation developing close to grain boundaries. The carbon supersaturation feeds the nucleation of graphene domains, with higher nucleation densities occurring in regions of higher supersaturation, such as the middle of catalyst grains (Figure 6C). Initially, the ready supply of carbon from the supersaturation results in growth of the nucleated domains being interface-attachment-limited, with facets growing at constant velocities determined by the attachment barrier (Figure 6D). The shape of the graphene domains is thus determined by the interfacial mobility, which is a function of both the orientation of the graphene lattice and the underlying catalyst, with the lowest mobility facets persisting. Over time, the local carbon supersaturation in front of a growing facet can become depleted if it is not sufficiently replenished, and growth will then transition toward being diffusion-limited (Figure 6E).66 In this regime, the interfacial mobility will still influence the growth velocity in a given direction; however, the role of any anisotropy in surface diffusion will be increasingly dominant, and the domain shape can evolve toward having facet normals aligned with slow diffusion directions. This is exemplified close to catalyst grain boundaries where the local curvature of the surface results in a high density of step edges aligned with the grain boundary, which are barriers to surface diffusion, leading to rapid diffusion parallel to the boundary and the dramatic widening of the graphene domain in this direction (Figure 5K). As growth proceeds and neighboring graphene domains grow close to one another, their diffusion fields overlap, and the bare catalyst surface available for precursor dissociation reduces, leading to growth of facets becoming dissociation-limited (Figure 6F).
Figure 6.
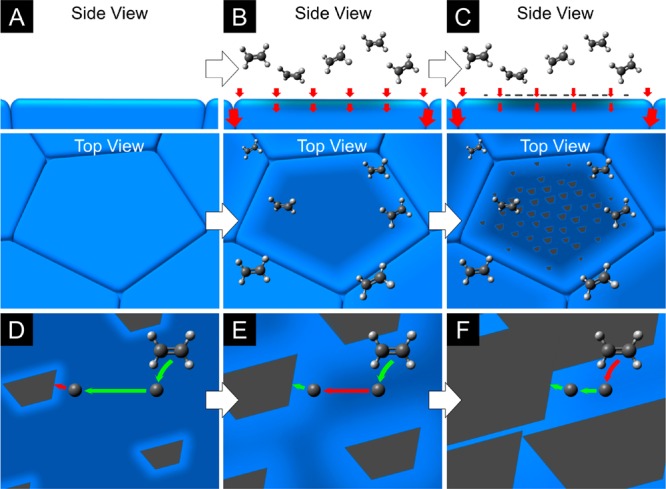
Summary of graphene growth on a polycrystalline catalyst. (A–C) On the initially clean catalyst surface (A), carbon precursor dissociation delivers a flux of carbon, which is initially matched by diffusion into the catalyst bulk (as indicated by red arrows), giving a notable incubation time (B). As exposure continues, the catalyst becomes locally filled with carbon close to the surface and a supersaturation develops, which feeds the nucleation of graphene domains (C). Red arrows illustrate the fluxes of carbon arriving at the catalyst surface and diffusing into the bulk and grain boundaries. Rapid grain boundary diffusion (large red arrows) lowers the supersaturation and, thus, nucleation density close to grain boundaries. (D–F) The supersaturation developed prior to nucleation provides a ready supply of carbon that results in domain growth initially being interface-attachment-limited (D), but as this supersaturation is locally depleted in front of a growing facet, surface diffusion becomes rate-limiting (E). As the graphene domains grow further and begin to merge, the catalyst surface available for precursor dissociation diminishes and growth becomes dissociation-limited (F). The colored arrows represent precursor dissociation, surface diffusion, and interface attachment (Processes 1–3 identified in Figure 2), with the red arrows indicating which of these processes is rate-limiting at each stage.
Importantly for polycrystalline catalysts, the variations in precursor dissociation rate with grain orientation and the rate of carbon removal at different grain boundaries lead to an inhomogeneous carbon distribution across the catalyst surface, meaning that the rate-limiting growth process not only varies with time but can vary across different regions of the catalyst. This is observed even on very local scales, for different graphene domains within a catalyst grain, and even for individual graphene domains where the growth of different facets can show different rate-limiting steps. This has wider implications for the interpretation of growth dynamics, where it cannot necessarily be assumed that a certain process will be rate-limiting throughout growth or even across the catalyst surface. Therefore, care must be taken when using global metrics (e.g., areal growth rate)23,66 to quantify growth dynamics as the contributions of facets with different rate-limiting steps may be convolved, and the underlying origin of the growth behavior may only be apparent from more local measures.
The inhomogeneous carbon distribution on the catalyst surface and the dependence of interfacial mobility on graphene lattice and catalyst orientation violates major assumptions of the established JMAK equation for crystal growth, including that the nucleation rate must remain constant and homogeneous across the surface and that the growth rate must be constant and isotropic. Indeed, our results show that even for selected regions of the catalyst surface, the JMAK equation does not adequately describe growth. We therefore suggest that in modeling CVD graphene growth on polycrystalline catalysts, orientation-dependent precursor dissociation, grain boundary diffusion, and the different rate-limiting steps that can exist during growth must all be taken into account.
While our results herein relate to polycrystalline Pt, which has a notable carbon solubility (∼1.1 atom % at 1000 °C)67 at the growth temperatures used, polycrystalline Cu remains the most widely used catalyst for graphene CVD and has a much lower bulk solubility (0.0007–0.0280 atom % at 1000 °C).68,69 For both catalysts, isothermal graphene growth is observed,70 with the supply of carbon by precursor dissociation filling the catalyst with carbon close to its surface until a supersaturation develops that feeds graphene nucleation. The associated incubation time will depend on the catalyst’s carbon solubility, the rate of carbon supply by precursor dissociation, and the rate of carbon removal into the catalyst, determined by its permeability (the product of solubility and diffusivity).7 Despite the low solubility of carbon in Cu, recent literature suggests a relatively large carbon diffusivity,71 and thus, the permeability and therefore the rate of carbon removal from the surface of Cu may not be so drastically different from that of Pt. Nevertheless, for all catalyst surfaces, a carbon supersaturation will develop prior to graphene nucleation, which feeds subsequent growth. The surface carbon concentration close to a graphene facet will therefore decrease with time as the facet grows, leading to time-dependent interfacial velocities and, thus, violation of a key assumption of the JMAK equation. For Cu in particular, the numerous observations of nonisotropic graphene domain shapes2,12−14,16,20,22,23,43,56,66 further highlights that the JMAK equation is inappropriate for describing growth. Instead, we emphasize that in modeling growth on Cu, grain boundary and surface diffusion are expected to play important roles regardless of the precise extent of carbon removal through bulk diffusion, and thus, their influence on surface carbon distribution should be carefully considered.
Conclusions
In conclusion, we have shown that for polycrystalline catalyst foils under realistic graphene CVD conditions, the rate-limiting steps in growth can vary throughout the process and across different regions of the catalyst surface. The dependence of precursor dissociation on catalyst grain orientation and the different diffusion pathways (surface, grain boundary, and bulk) that exist on polycrystalline samples are found to play key roles in the observed growth behavior, affecting the distribution of carbon species across the surface and, thus, the rate-limiting growth process. The supersaturation developed prior to graphene domain nucleation feeds an initial interface-attachment-limited growth period, which transitions to diffusion-limited growth as this supersaturation is depleted. As the domains begin to approach one another and the available bare catalyst diminishes, precursor dissociation becomes limiting. When growth is interface-attachment-limited, the graphene domain shape is defined by the interfacial mobility, which can vary as a function of both graphene lattice orientation and the catalyst grain orientation. In diffusion-limited growth, surface diffusion plays a more-dominant role in determining domain shape and is influenced by the catalyst surface morphology, including the presence of step edges and grain boundaries. This highlights that controlling the catalyst texture and surface morphology is key to controlling the domain structure of the graphene film produced. Our observations and analysis provide new insights into how the structure of CVD graphene films is intimately linked to that of the underlying catalyst, and the concepts developed can serve as a general framework for understanding the growth of 2D materials on polycrystalline transition metal catalysts.
Methods
In situ SEM experiments are performed using a commercial environmental SEM (FEI Quantum 200, base pressure of ∼10–6 mbar) with a custom IR laser heating stage and with gas supplied through a leak valve. Temperatures were measured with a type-K thermocouple spot-welded to the sample and have an estimated uncertainty of ±50 °C. Samples were imaged using an Everhart–Thornley detector and an acceleration voltage of 5.0 kV during pretreatment and growth, while the CVD atmosphere was monitored by a mass spectrometer (Pfeiffer OmniStar). Each full-image frame is acquired by raster scanning from top left to bottom right and takes ∼9.5 s to acquire. The image sequences analyzed in Figures 2–4 correspond to smaller regions taken from full-image frames and thus have scan times of ∼1, ∼2, and ∼0.5 s, respectively. Low-magnification images of the samples taken at several points during each growth experiment show that regions around the imaged area have similar extents of growth, indicating that the contribution of electron-beam induced effects does not overwhelm the dominant CVD growth behavior.
The assignment of single-layer graphene based on in situ SEM contrast is confirmed by extensive growth calibrations in which ex situ SEM (Zeiss SigmaVP, 1–2 kV, in-lens detector) images of the as-grown graphene on Pt72 are correlated with optical microscopy and Raman spectroscopy (Renishaw Raman InVia Microscope, 532 nm excitation; see Figure S3) measurements following transfer to SiO2 (300 nm)/Si substrates using an electrolysis-based bubbling technique, as previously described elsewhere.7,48
EBSD measurements were performed ex situ in a FEI Helios dual-beam microscope (5–15 kV, current of ∼5.5 nA, working distance of 5.0–6.5 mm, and sample tilt of ∼60° with respect to the electron beam) with an Oxford Instruments HKL EBSD Nordlys II detector in spot mode using Channel 5 software.
For quantitative analysis, the SEM images were first binarized with an appropriate threshold. Domain areas were determined by summing over those pixels belonging to the graphene domains. A pair of copies were made of each binary image, and these were then stacked upon one another to create a pseudo-3D structure. The “height” of this structure measured one unit, while the length and width were given by the image dimensions. Then, the 3D structure was meshed (represented by a sequence of triangles and vertices). To remove any “staircasing” artifacts, the mesh was smoothed by a minimal number of iterations of mean curvature flow.73 The normal of a given mesh triangle was given by the curl of its edge vectors, and its velocity was calculated using the nearest-neighbor approach.74 All codes were written in MATLAB R2015b and executed on a Mac Pro 3.5 GHz, 12 core Intel Xeon system with 64 GB of RAM.
Acknowledgments
R.S.W. acknowledges a Research Fellowship from St. John’s College, Cambridge and a Marie Skłodowska-Curie Individual Fellowship (Global) under grant ARTIST (no. 656870) from the European Union’s Horizon 2020 research and innovation programme. Support for A.J.S. was provided by an NSF graduate research fellowship (DGE-1324585). S.H. acknowledges funding from ERC grant InsituNANO (no. 279342). This research was partially supported by the EUFP7 Work Programme under grant GRAFOL (project reference 285275) and EPSRC under grant GRAPHTED (project reference EP/K016636/1). K.M. and A.J.P. acknowledge financial support from the Strategic Capability programme of the National Measurement System of the U.K. Department of Business, Innovation, and Skills (project no. 119376). Figures 3C and 4C were produced in part using the VESTA 3 software.75
Supporting Information Available
The Supporting Information is available free of charge on the ACS Publications website at DOI: 10.1021/acs.nanolett.6b02459.
Additional details on the derivation of growth equations and catalyst grain orientations. Figures showing a schematic of energy versus reaction coordinate, orientation of Pt unit cells determined by electron backscatter diffraction, and a representative Raman spectrum of single-layer graphene. (PDF)
The authors declare no competing financial interest.
Supplementary Material
References
- Novoselov K. S.; Fal’ko V. I.; Colombo L.; Gellert P. R.; Schwab M. G.; Kim K. A Roadmap for Graphene. Nature 2012, 490, 192–200. 10.1038/nature11458. [DOI] [PubMed] [Google Scholar]
- Hofmann S.; Braeuninger-Weimer P.; Weatherup R. S. CVD-Enabled Graphene Manufacture and Technology. J. Phys. Chem. Lett. 2015, 6, 2714–2721. 10.1021/acs.jpclett.5b01052. [DOI] [PMC free article] [PubMed] [Google Scholar]
- Bae S.; Kim H.; Lee Y.; Xu X.; Park J.-S.; Zheng Y.; Balakrishnan J.; Lei T.; Ri Kim H.; Song Y. Il; et al. Roll-to-Roll Production of 30-Inch Graphene Films for Transparent Electrodes. Nat. Nanotechnol. 2010, 5, 574–578. 10.1038/nnano.2010.132. [DOI] [PubMed] [Google Scholar]
- Kobayashi T.; Bando M.; Kimura N.; Shimizu K.; Kadono K.; Umezu N.; Miyahara K.; Hayazaki S.; Nagai S.; Mizuguchi Y.; et al. Production of a 100-M-Long High-Quality Graphene Transparent Conductive Film by Roll-to-Roll Chemical Vapor Deposition and Transfer Process. Appl. Phys. Lett. 2013, 102, 23112. 10.1063/1.4776707. [DOI] [Google Scholar]
- Petrone N.; Dean C. R.; Meric I.; van der Zande A. M.; Huang P. Y.; Wang L.; Muller D.; Shepard K. L.; Hone J. Chemical Vapor Deposition-Derived Graphene with Electrical Performance of Exfoliated Graphene. Nano Lett. 2012, 12, 2751–2756. 10.1021/nl204481s. [DOI] [PubMed] [Google Scholar]
- Weatherup R. S.; Amara H.; Blume R.; Dlubak B.; Bayer B. C.; Diarra M.; Bahri M.; Cabrero-vilatela A.; Caneva S.; Kidambi P. R.; et al. Interdependency of Subsurface Carbon Distribution and Graphene-Catalyst Interactions. J. Am. Chem. Soc. 2014, 136, 13698–13708. 10.1021/ja505454v. [DOI] [PMC free article] [PubMed] [Google Scholar]
- Weatherup R. S.; Dlubak B.; Hofmann S. Kinetic Control of Catalytic CVD for High Quality Graphene at Low Temperatures. ACS Nano 2012, 6, 9996–10003. 10.1021/nn303674g. [DOI] [PubMed] [Google Scholar]
- Caneva S.; Weatherup R. S.; Bayer B. C.; Blume R.; Cabrero-Vilatela A.; Braeuninger-Weimer P.; Martin M.-B.; Wang R.; Baehtz C.; Schlögl R.; et al. Controlling Catalyst Bulk Reservoir Effects for Monolayer Hexagonal Boron Nitride CVD. Nano Lett. 2016, 16, 1250–1261. 10.1021/acs.nanolett.5b04586. [DOI] [PMC free article] [PubMed] [Google Scholar]
- Cabrero-Vilatela A.; Weatherup R. S.; Braeuninger-Weimer P.; Caneva S.; Hofmann S. Towards a General Growth Model for Graphene CVD on Transition Metal Catalysts. Nanoscale 2016, 8, 2149–2158. 10.1039/C5NR06873H. [DOI] [PMC free article] [PubMed] [Google Scholar]
- Weatherup R. S.; Bayer B. C.; Blume R.; Ducati C.; Baehtz C.; Schlögl R.; Hofmann S. In Situ Characterization of Alloy Catalysts for Low-Temperature Graphene Growth. Nano Lett. 2011, 11, 4154–4160. 10.1021/nl202036y. [DOI] [PubMed] [Google Scholar]
- Weatherup R. S.; Baehtz C.; Dlubak B.; Bayer B. C.; Kidambi P. R.; Blume R.; Schloegl R.; Hofmann S. Introducing Carbon Diffusion Barriers for Uniform, High-Quality Graphene Growth from Solid Sources. Nano Lett. 2013, 13, 4624–4631. 10.1021/nl401601x. [DOI] [PMC free article] [PubMed] [Google Scholar]
- Hao Y.; Bharathi M.; Wang L.; Liu Y.; Chen H.; Nie S.; Wang X.; Chou H.; Tan C.; Fallahazad B.; et al. The Role of Surface Oxygen in the Growth of Large Single-Crystal Graphene on Copper. Science 2013, 342, 720–723. 10.1126/science.1243879. [DOI] [PubMed] [Google Scholar]
- Mohsin A.; Liu L.; Liu P.; Deng W.; Ivanov I. N.; Li G.; Dyck O. E.; Duscher G.; Dunlap J. R.; Xiao K.; et al. Synthesis of Millimeter-Size Hexagon-Shaped Graphene Single Crystals on Resolidified Copper. ACS Nano 2013, 7, 8924–8931. 10.1021/nn4034019. [DOI] [PubMed] [Google Scholar]
- Wu Y. A.; Fan Y.; Speller S.; Creeth G. L.; Sadowski J. T.; He K.; Robertson A. W.; Allen C. S.; Warner J. H. Large Single Crystals of Graphene on Melted Copper Using Chemical Vapor Deposition. ACS Nano 2012, 6, 5010–5017. 10.1021/nn3016629. [DOI] [PubMed] [Google Scholar]
- Caneva S.; Weatherup R. S.; Bayer B.; Brennan B.; Spencer S. J.; Mingard K.; Cabrero-Vilatela A.; Baehtz C.; Pollard A. J.; Hofmann S. Nucleation Control for Large, Single Crystalline Domains of Monolayer Hexagonal Boron Nitride via Si-Doped Fe Catalysts. Nano Lett. 2015, 15, 1867–1875. 10.1021/nl5046632. [DOI] [PMC free article] [PubMed] [Google Scholar]
- Zhang B.; Lee W. H.; Piner R.; Kholmanov I.; Wu Y.; Li H.; Ji H.; Ruoff R. S. Low-Temperature Chemical Vapor Deposition Growth of Graphene from Toluene on Electropolished Copper Foils. ACS Nano 2012, 6, 2471–2476. 10.1021/nn204827h. [DOI] [PubMed] [Google Scholar]
- Gamo Y.; Nagashima A.; Wakabayashi M.; Terai M.; Oshima C. Atomic Structure of Monolayer Graphite Formed on Ni(111). Surf. Sci. 1997, 374, 61–64. 10.1016/S0039-6028(96)00785-6. [DOI] [Google Scholar]
- Addou R.; Dahal A.; Sutter P.; Batzill M. Monolayer Graphene Growth on Ni(111) by Low Temperature Chemical Vapor Deposition. Appl. Phys. Lett. 2012, 100, 21601. 10.1063/1.3675481. [DOI] [Google Scholar]
- Patera L. L.; Africh C.; Weatherup R. S.; Blume R.; Bhardwaj S.; Castellarin-Cudia C.; Knop-Gericke A.; Schloegl R.; Comelli G.; Hofmann S.; et al. In Situ Observations of the Atomistic Mechanisms of Ni Catalyzed Low Temperature Graphene Growth. ACS Nano 2013, 7, 7901–7912. 10.1021/nn402927q. [DOI] [PubMed] [Google Scholar]
- Wilson N. R.; Marsden A. J.; Saghir M.; Bromley C. J.; Schaub R.; Costantini G.; White T. W.; Partridge C.; Barinov A.; Dudin P.; et al. Weak Mismatch Epitaxy and Structural Feedback in Graphene Growth on Copper Foil. Nano Res. 2013, 6, 99–112. 10.1007/s12274-013-0285-y. [DOI] [Google Scholar]
- Lee J.-H.; Lee E. K.; Joo W.-J.; Jang Y.; Kim B.-S.; Lim J. Y.; Choi S.-H.; Ahn S. J.; Ahn J. R.; Park M.-H.; et al. Wafer-Scale Growth of Single-Crystal Monolayer Graphene on Reusable Hydrogen-Terminated Germanium. Science 2014, 344, 286–289. 10.1126/science.1252268. [DOI] [PubMed] [Google Scholar]
- Kim H.; Mattevi C.; Calvo M. R.; Oberg J. C.; Artiglia L.; Agnoli S.; Hirjibehedin C. F.; Chhowalla M.; Saiz E. Activation Energy Paths for Graphene Nucleation and Growth on Cu. ACS Nano 2012, 6, 3614–3623. 10.1021/nn3008965. [DOI] [PubMed] [Google Scholar]
- Celebi K.; Cole M. T.; Choi J. W.; Wyczisk F.; Legagneux P.; Rupesinghe N.; Robertson J.; Teo K. B. K.; Park H. G. Evolutionary Kinetics of Graphene Formation on Copper. Nano Lett. 2013, 13, 967–974. 10.1021/nl303934v. [DOI] [PubMed] [Google Scholar]
- Johnson W. A.; Mehl R. F. Reaction Kinetics in Processes of Nucleation and Growth. Trans. AIME 1939, 135, 416–458. [Google Scholar]
- Kolmogorov A. N. On the Statistical Theory of Crystallization of Metals. Izv. Akad. Nauk SSSR, Ser. Mater. 1937, 3, 355–359. [Google Scholar]
- Avrami M. Kinetics of Phase Change. I General Theory. J. Chem. Phys. 1939, 7, 1103. 10.1063/1.1750380. [DOI] [Google Scholar]
- Avrami M. Kinetics of Phase Change. II - Transformation-Time Relations for Random Distribution of Nuclei. J. Chem. Phys. 1940, 8, 212–224. 10.1063/1.1750631. [DOI] [Google Scholar]
- Avrami M. Granulation, Phase Change, and Microstructure Kinetics of Phase Change. III. J. Chem. Phys. 1941, 9, 177. 10.1063/1.1750872. [DOI] [Google Scholar]
- Barmak K. A Commentary on: “Reaction Kinetics in Processes of Nucleation and Growth.. Metall. Mater. Trans. A 2010, 41, 2711–2775. 10.1007/s11661-010-0421-1. [DOI] [Google Scholar]
- Sutter P. W.; Flege J. I.; Sutter E. A. Epitaxial Graphene on Ruthenium. Nat. Mater. 2008, 7, 406–411. 10.1038/nmat2166. [DOI] [PubMed] [Google Scholar]
- Loginova E.; Bartelt N.; Feibelman P.; McCarty K. Evidence for Graphene Growth by C Cluster Attachment. New J. Phys. 2008, 10, 93026. 10.1088/1367-2630/10/9/093026. [DOI] [Google Scholar]
- Mccarty K. F.; Feibelman P. J.; Loginova E.; Bartelt N. C. Kinetics and Thermodynamics of Carbon Segregation and Graphene Growth on Ru (0 0 0 1). Carbon 2009, 47, 1806–1813. 10.1016/j.carbon.2009.03.004. [DOI] [Google Scholar]
- Salmeron M.; Schlögl R. Ambient Pressure Photoelectron Spectroscopy: A New Tool for Surface Science and Nanotechnology. Surf. Sci. Rep. 2008, 63, 169–199. 10.1016/j.surfrep.2008.01.001. [DOI] [Google Scholar]
- Goldstein J.; Newbury D. E.; Joy D. C.; Lyman C. E.; Echlin P.; Lifshin E.; Sawyer L.; Michael J. R.. Scanning Electron Microscopy and X-Ray Microanalysis, 3rd ed.; Kluwer Academic Publishers: New York, 2003. [Google Scholar]
- Luo J.; Tian P.; Pan C.-T.; Robertson A. W.; Warner J. H.; Hill E. W.; Briggs G. A. D. Ultralow Secondary Electron Emission of Graphene. ACS Nano 2011, 5, 1047–1055. 10.1021/nn102579f. [DOI] [PubMed] [Google Scholar]
- Saadi S.; Abild-Pedersen F.; Helveg S.; Sehested J.; Hinnemann B.; Appel C. C.; Nørskov J. K. On the Role of Metal Step-Edges in Graphene Growth. J. Phys. Chem. C 2010, 114, 11221–11227. 10.1021/jp1033596. [DOI] [Google Scholar]
- Fanfoni M.; Tomellini M. The Johnson-Mehl- Avrami-Kohnogorov Model: A Brief Review. Nuovo Cimento Soc. Ital. Fis., D 1998, 20, 1171–1182. 10.1007/BF03185527. [DOI] [Google Scholar]
- Parthasarathy T.; Shewmon P. Diffusion Induced Grain Boundary Migration in Ni-C Alloys. Scr. Metall. 1983, 17, 943–946. 10.1016/0036-9748(83)90267-3. [DOI] [Google Scholar]
- Mishin Y.; Herzig C. Grain Boundary Diffusion: Recent Progress and Future Research. Mater. Sci. Eng., A 1999, 260, 55–71. 10.1016/S0921-5093(98)00978-2. [DOI] [Google Scholar]
- Martin M. T. Surface Diffusion of Carbon on (111) Platinum. J. Vac. Sci. Technol. 1978, 15, 474. 10.1116/1.569598. [DOI] [Google Scholar]
- Hofmann S.; Csányi G.; Ferrari A.; Payne M.; Robertson J. Surface Diffusion: The Low Activation Energy Path for Nanotube Growth. Phys. Rev. Lett. 2005, 95, 36101. 10.1103/PhysRevLett.95.036101. [DOI] [PubMed] [Google Scholar]
- Balluffi R. W. Grain Boundary Diffusion Mechanisms in Metals. Metall. Trans. B 1982, 13, 527–553. 10.1007/BF02650011. [DOI] [Google Scholar]
- Meca E.; Lowengrub J.; Kim H.; Mattevi C.; Shenoy V. B. Epitaxial Graphene Growth and Shape Dynamics on Copper: Phase-Field Modeling and Experiments. Nano Lett. 2013, 13, 5692–5697. 10.1021/nl4033928. [DOI] [PubMed] [Google Scholar]
- Ratke L.; Voorhees P. W.. Growth and Coarsening; Springer: New York, 2002. [Google Scholar]
- Balluffi R. W.; Allen S. M.; Carter W. C.. Kinetics of Materials, 1st ed.; Wiley-Interscience: Hoboken, NJ, 2005. [Google Scholar]
- Ma T.; Ren W.; Zhang X.; Liu Z.; Gao Y.; Yin L.-C.; Ma X.-L.; Ding F.; Cheng H.-M. Edge-Controlled Growth and Kinetics of Single-Crystal Graphene Domains by Chemical Vapor Deposition. Proc. Natl. Acad. Sci. U. S. A. 2013, 110, 20386–20391. 10.1073/pnas.1312802110. [DOI] [PMC free article] [PubMed] [Google Scholar]
- Babenko V.; Murdock A. T.; Koós A. A.; Britton J.; Crossley A.; Holdway P.; Moffat J.; Huang J.; Alexander-Webber J. A.; Nicholas R. J.; et al. Rapid Epitaxy-Free Graphene Synthesis on Silicidated Polycrystalline Platinum. Nat. Commun. 2015, 6, 7536. 10.1038/ncomms8536. [DOI] [PMC free article] [PubMed] [Google Scholar]
- Gao L.; Ren W.; Xu H.; Jin L.; Wang Z.; Ma T.; Ma L.-P.; Zhang Z.; Fu Q.; Peng L.-M.; et al. Repeated Growth and Bubbling Transfer of Graphene with Millimetre-Size Single-Crystal Grains Using Platinum. Nat. Commun. 2012, 3, 699. 10.1038/ncomms1702. [DOI] [PMC free article] [PubMed] [Google Scholar]
- Blakely D. W.; Somorjai G. A. The Stability and Structure of High Miller Index Platinum Crystal Surfaces in Vacuum and in the Presence of Adsorbed Carbon and Oxygen. Surf. Sci. 1977, 65, 419–442. 10.1016/0039-6028(77)90457-5. [DOI] [Google Scholar]
- Sandy A. R.; Mochrie S. G. J.; Zehner D. M.; Grubel G.; Huang K. G.; Gibbs D. Reconstruction of the P(111) Surface. Phys. Rev. Lett. 1992, 68, 2192–2195. 10.1103/PhysRevLett.68.2192. [DOI] [PubMed] [Google Scholar]
- Grubel G.; Huang K. G.; Gibbs D.; Zehner D. M.; Sandy A. R.; Mochrie S. G. J. Reconstruction of the Pt(111) Surface: X-Ray-Scattering Measurements. Phys. Rev. B: Condens. Matter Mater. Phys. 1993, 48, 18119–18139. 10.1103/PhysRevB.48.18119. [DOI] [PubMed] [Google Scholar]
- Heilmann P.; Heinz K.; Müller K. The Superstructures of the Clean Pt(100) and Ir(100) Surfaces. Surf. Sci. 1979, 83, 487–497. 10.1016/0039-6028(79)90058-X. [DOI] [Google Scholar]
- Nilsson L.; Andersen M.; Bjerre J.; Balog R.; Hammer B.; Hornekær L.; Stensgaard I. Preservation of the Pt(100) Surface Reconstruction after Growth of a Continuous Layer of Graphene. Surf. Sci. 2012, 606, 464–469. 10.1016/j.susc.2011.11.007. [DOI] [Google Scholar]
- Otero G.; Gonzalez C.; Pinardi A. L.; Merino P.; Gardonio S.; Lizzit S.; Blanco-Rey M.; Van De Ruit K.; Flipse C. F. J.; Mendez J.; et al. Ordered Vacancy Network Induced by the Growth of Epitaxial Graphene on Pt(111). Phys. Rev. Lett. 2010, 105, 1–4. 10.1103/PhysRevLett.105.216102. [DOI] [PubMed] [Google Scholar]
- Fujita T.; Kobayashi W.; Oshima C. Novel Structures of Carbon Layers on a Pt(111) Surface. Surf. Interface Anal. 2005, 37, 120–123. 10.1002/sia.1945. [DOI] [Google Scholar]
- Artyukhov V. I.; Hao Y.; Ruoff R. S.; Yakobson B. I. Breaking of Symmetry in Graphene Growth on Metal Substrates. Phys. Rev. Lett. 2015, 114, 115502. 10.1103/PhysRevLett.114.115502. [DOI] [PubMed] [Google Scholar]
- Mitsui T.; Fomin E.; Ogletree D. F.; Salmeron M.; Nilekar A. U.; Mavrikakis M. Manipulation and Patterning of the Surface Hydrogen Concentration on Pd(111) by Electric Fields. Angew. Chem., Int. Ed. 2007, 46, 5757–5761. 10.1002/anie.200604498. [DOI] [PubMed] [Google Scholar]
- Mitsui T.; Rose M. K.; Fomin E.; Ogletree D. F.; Salmeron M. Dissociative Hydrogen Adsorption on Palladium Requires Aggregates of Three or More Vacancies. Nature 2003, 422, 705–707. 10.1038/nature01557. [DOI] [PubMed] [Google Scholar]
- Starodub E.; Maier S.; Stass I.; Bartelt N. C.; Feibelman P. J.; Salmeron M.; McCarty K. F. Graphene Growth by Metal Etching on Ru(0001). Phys. Rev. B: Condens. Matter Mater. Phys. 2009, 80, 235422. 10.1103/PhysRevB.80.235422. [DOI] [Google Scholar]
- Sutter P.; Sadowski J. T.; Sutter E. Graphene on Pt (111): Growth and Substrate Interaction. Phys. Rev. B: Condens. Matter Mater. Phys. 2009, 80, 245411. 10.1103/PhysRevB.80.245411. [DOI] [Google Scholar]
- Feng X.; Wu J.; Bell A. T.; Salmeron M. An Atomic-Scale View of the Nucleation and Growth of Graphene Islands on Pt Surfaces. J. Phys. Chem. C 2015, 119, 7124. 10.1021/jp512163n. [DOI] [Google Scholar]
- Onsager L. Reciprocal Relations in Irreversible Processes. Phys. Rev. 1931, 37, 405. 10.1103/PhysRev.37.405. [DOI] [Google Scholar]
- Casimir H. B. G. On Onsager’s Principle of Microscopic Reversibility. Rev. Mod. Phys. 1945, 17, 343–350. 10.1103/RevModPhys.17.343. [DOI] [Google Scholar]
- Artyukhov V. I.; Liu Y.; Yakobson B. I. Equilibrium at the Edge and Atomistic Mechanisms of Graphene Growth. Proc. Natl. Acad. Sci. U. S. A. 2012, 109, 15136–15140. 10.1073/pnas.1207519109. [DOI] [PMC free article] [PubMed] [Google Scholar]
- Artyukhov V. I.; Hao Y.; Ruoff R. S.; Yakobson B. I. Breaking of Symmetry in Graphene Growth on Metal Substrates. Phys. Rev. Lett. 2015, 114, 115502. 10.1103/PhysRevLett.114.115502. [DOI] [PubMed] [Google Scholar]
- Wang Z.; Weinberg G.; Zhang Q.; Lunkenbein T.; Klein-Hoffmann A.; Kurnatowska M.; Plodinec M.; Li Q.; Chi L.; Schloegl R.; et al. Direct Observation of Graphene Growth and Associated Copper Substrate Dynamics by In-Situ Scanning Electron Microscopy. ACS Nano 2015, 9, 1506–1519. 10.1021/nn5059826. [DOI] [PubMed] [Google Scholar]
- Siller R.; Oates W.; McLellan R. The Solubility of Carbon in Palladium and Platinum. J. Less-Common Met. 1968, 16, 71–73. 10.1016/0022-5088(68)90158-6. [DOI] [Google Scholar]
- López G. A.; Mittemeijer E. J. The Solubility of C in Solid Cu. Scr. Mater. 2004, 51, 1–5. 10.1016/j.scriptamat.2004.03.028. [DOI] [Google Scholar]
- McLellan R. The Solubility of Carbon in Solid Gold, Copper, and Silver. Scr. Metall. 1969, 3, 389–391. 10.1016/0036-9748(69)90262-2. [DOI] [Google Scholar]
- Kidambi P. R.; Bayer B. C.; Blume R.; Wang Z.-J.; Baehtz C.; Weatherup R. S.; Willinger M.-G.; Schloegl R.; Hofmann S. Observing Graphene Grow: Catalyst-Graphene Interactions during Scalable Graphene Growth on Polycrystalline Copper. Nano Lett. 2013, 13, 4769–4778. 10.1021/nl4023572. [DOI] [PMC free article] [PubMed] [Google Scholar]
- Hao Y.; Wang L.; Liu Y.; Chen H.; Wang X.; Tan C.; Nie S.; Suk J. W.; Jiang T.; Liang T.; et al. Oxygen-Activated Growth and Bandgap Tunability of Large Single-Crystal Bilayer Graphene. Nat. Nanotechnol. 2016, 11, 426–431. 10.1038/nnano.2015.322. [DOI] [PubMed] [Google Scholar]
- Weatherup R. S.; D’Arsié L.; Cabrero-Vilatela A.; Caneva S.; Blume R.; Robertson J.; Schlögl R.; Hofmann S. Long-Term Passivation of Strongly Interacting Metals with Single-Layer Graphene. J. Am. Chem. Soc. 2015, 137, 14358–14366. 10.1021/jacs.5b08729. [DOI] [PMC free article] [PubMed] [Google Scholar]
- Desbrun M.; Meyer M.; Schröder P.; Barr A. H. Implicit Fairing of Irregular Meshes Using Diffusion and Curvature Flow. Proc. 26th Annu. Conf. Comput. Graph. Interact. Technol. 1999, 33, 317–324. 10.1145/311535.311576. [DOI] [Google Scholar]
- Shahani A. J.; Xiao X.; Skinner K.; Peters M.; Voorhees P. W.. Ostwald Ripening of Faceted Si Particles in an Al-Si-Cu Liquid. Mater. Sci. Eng., A 2016, 673307. 10.1016/j.msea.2016.06.077 [DOI] [Google Scholar]
- Momma K.; Izumi F. VESTA 3 for Three-Dimensional Visualization of Crystal, Volumetric and Morphology Data. J. Appl. Crystallogr. 2011, 44, 1272–1276. 10.1107/S0021889811038970. [DOI] [Google Scholar]
Associated Data
This section collects any data citations, data availability statements, or supplementary materials included in this article.