

Summary
Background
Meal tolerance tests are frequently used to study dynamic incretin and insulin responses in the postprandial state; however, the optimal meal that is best tolerated and suited for hormonal response following surgical and medical weight loss has yet to be determined.
Objective
To evaluate the tolerability and effectiveness of different test meals in inducing detectable changes in markers of glucose metabolism in individuals who have undergone a weight loss intervention.
Methods
Six individuals who underwent surgical or medical weight loss (two Roux‐en‐Y gastric bypass, two sleeve gastrectomy and two medical weight loss) each completed three meal tolerance tests using liquid‐mixed, solid‐mixed and high‐fat test meals. The tolerability of each test meal, as determined by the total amount consumed and palatability, as well as fasting and meal‐stimulated glucagon‐like peptide, glucose‐dependent insulinotropic polypeptide, insulin and glucose were measured.
Results
Among the six individuals, the liquid‐mixed meal was better and more uniformly tolerated with a median meal completion rate of 99%. Among the four bariatric surgical patients, liquid‐mixed meal stimulated on average a higher glucagon‐like peptide (percent difference: 83.7, 89), insulin secretion (percent difference: 155.1, 158.7) and glucose‐dependent insulinotropic polypeptide (percent difference: 113.5, 34.3) compared with solid‐mixed and high‐fat meals.
Conclusions
The liquid‐mixed meal was better tolerated with higher incretin and insulin response compared with the high‐fat and solid‐mixed meals and is best suited for the evaluation of stimulated glucose homeostasis.
Keywords: bariatric surgery, GIP, GLP‐1, incretins, meal tolerance test, weight loss
Introduction
Bariatric surgery, especially the Roux‐en‐Y gastric bypass (RYGB), is the most effective obesity treatment and leads to significant metabolic improvements in obesity‐related comorbidities such as diabetes even before a substantial weight loss occurs 1, 2. A newer and increasingly popular bariatric surgery, sleeve gastrectomy (SG), is a restrictive procedure without intestinal bypass. SG brings metabolic improvements similar to RYGB 3. While speculative, some of the proposed mechanisms for rapid metabolic improvements, in addition to the dramatic reduction in food intake, include changes in enteric hormones including glucagon‐like peptide (GLP)‐1, peptide‐YY, ghrelin and glucose‐dependent insulinotropic polypeptide (GIP), and reduction in obesity‐related inflammation 4, 5, 6.
Meal‐stimulated secretion of incretins and insulin provide important insights into glucose homeostasis and energy balance 7. There is a lack of consensus on the best type of test meal to study prandial changes in enteric hormones after bariatric surgery. For example, several studies have utilized commercial liquid mixed‐meals such as Ensure or Optifast with differing ratios of macronutrients and varying caloric contents to study changes in enteric hormones after RYGB 4, 8, 9. In healthy adults, a high‐fat, high‐carbohydrate diet induced a greater increase in systemic inflammation and insulin resistance compared with an isocaloric mixed‐meal diet or simple carbohydrates 10, 11. The goal of this pilot study was to evaluate the tolerability of three different meal types commonly used and their effectiveness in inducing detectible changes in markers of glucose metabolism in individuals with obesity who have undergone RYGB, SG or medical weight loss (MWL).
Methods
We recruited a total of six individuals with obesity who underwent a weight loss intervention at the Johns Hopkins Center for Bariatric Surgery or the Johns Hopkins Weight Management Center within the previous 12 months. We excluded those with the following: (1) prior history of gastrointestinal surgeries other than RYGB, SG, appendectomy or cholecystectomy,; (2) history of malabsorption or inflammatory bowel disease; (3) history of chronic illnesses including HIV; (4) chronic kidney disease; (5) liver disease or active cancer and (6) chronic use of medications or supplements likely to affect weight or intestinal absorption such as steroids, lithium, immunosuppressants, probiotics and antibiotics within 6 months prior to enrolling in the study. The six individuals provided written informed consent, and studies were approved by Johns Hopkins Institutional Review Boards.
After an overnight fast, the subjects presented to the Johns Hopkins Clinical Research Unit and underwent blood sampling via peripheral IV catheter. Each subject received one of the following three test meals per visit, assigned in random order: (1) liquid‐mixed meal consisting of one can of Ensure Plus (237 ml, 345 Kcal, 50 g carbohydrate, 11 g fat, 13 g protein); (2) solid‐mixed meal consisting of 1 large egg, 1.5 oz American cheese, 6 oz of nonfat strawberry yogurt with fructose and non‐nutritive sweeteners (aspartame, acesulfame potassium and/or sucralose) and 4 oz of unsweetened applesauce (362 Kcal, 32.6 g carbohydrates, 17.7 g fat, 20 g protein) and (3) high‐fat meal consisting of Haagen Dazs® vanilla bean ice cream (200 ml, 446 Kcal, 40 g carbohydrates, 29 g fat, 6.3 g protein). Blood samples were obtained at baseline, 30, 60, 120, 180 and 240 min after the start of the meal. Blood samples were collected in tubes containing potassium oxalate, sodium fluoride and EDTA for determination of plasma glucose and in tubes containing EDTA plus dipeptidyl peptidase IV inhibitor for measurement of GLP‐1, GIP and insulin. Subjects were encouraged to finish the meal within the first 30 min. Samples were stored at –80 °C until further processing. All six subjects completed three meal tolerance tests over three separate visits separated by at least 4 days in between the visits.
The area under the curve (AUC) for GLP‐1, GIP, insulin and glucose were calculated using the trapezoidal method. The percent difference between liquid‐mixed meal vs. other meal‐stimulated AUC of incretin, insulin and glucose response were calculated using the formula ((V1−V2)/V2)*100.
Assays: Active GLP‐1, GIP and insulin were measured in plasma using the Human Metabolic Hormone Magnetic Bead Panel 96‐well Plate Assay provided in the Miliplex MAP Human Metabolic Hormone Magnetic Bead Panel Kit (EMD Millipore, Billerica, MA). The mean minimum detectible concentration (pg/ml), intra‐assay CV and inter‐assay CV were 7, 7% and 10% for GLP‐1, 0.6, 3% and 5% for GIP and 58, 3% and 6% for insulin. Glucose was measured using the hexokinase G‐6‐PDH method (Beckman Coulter, Brea, CA).
Results
All six subjects completed the three different test meals. Individuals who underwent medical weight loss were older than the individuals who underwent surgical weight loss (Table 1). Among the six individuals, four were women and five were Caucasian. One individual had prediabetes (Table 1). The tolerability of each test meal was assessed based on the total amount consumed and the individual's feedback on its palatability. Among the three test meals, the liquid‐mixed meal was tolerated best and the high‐fat meal was tolerated least (because of early satiety and lack of palatability); one post‐SG individual did not tolerate the sweet taste of the ice cream in the high‐fat meal. The solid‐mixed meal led to the greatest variability in macronutrient consumption across participants as some individuals tended to consume different parts of the meal because of taste preference (Table 2). Among the four individuals who underwent RYGB or SG, the liquid‐mixed meal was the best at stimulating incretin, insulin and glucose responses as evidenced by the greater concentrations of these hormones and the positive percent difference between the AUC of each marker after liquid‐mixed meal compared with either solid‐mixed or high‐fat meal in three individuals for GLP‐1 and glucose and all four individuals for GIP and insulin (Table 3).
Table 1.
Subject characteristics
| RYGB #1 | RYGB #2 | SG #1 | SG #2 | MWL #1 | MWL #2 | |
| Age | 50 | 50 | 36 | 49 | 70 | 66 |
| Gender | F | F | F | M | M | F |
| Race | C | C | AA | C | C | C |
| Wt (lbs) | 142 | 193.5 | 169.8 | 210.4 | 204.2 | 200.1 |
| Ht (inches) | 64 | 66 | 65 | 68 | 68 | 51 |
| BMI (kg m−2) | 24 | 31 | 28 | 32 | 31 | 54 |
| Change in BMI | −24.2 | −10.1 | −14.0 | −12.1 | −15.8 | −6.4 |
| EWL (%) | 87 | 50 | 66 | 57 | 66 | 14 |
| Total body weight loss (%) | 49.8 | 24.4 | 33.1 | 27.4 | 33.7 | 10.5 |
| Post‐intervention time (months) | 11 | 11 | 8 | 8 | 7 | 12 |
| Pre‐existing comorbidities | OSA Joint Pain | OSA Joint Pain | HTN | OSA | Prediabetes | HTN |
AA, African–American; BMI, body mass index; C, caucasian; EWL, estimated weight loss; F, female; HTN, hypertension; M, male; OSA, obstructive sleep apnea; RYGB, Roux‐en‐Y gastric bypass.
Table 2.
Meal composition and percent completion
| Type | Liquid‐mixed | Solid‐mixed | High‐fat |
|---|---|---|---|
| Quantity (grams) | 250 | 376 | 180 |
| Total calorie (Kcal) | 350 | 362 | 446 |
| Total carbohydrate (% calories from carbohydrates) | 50 g (56.2) | 33 g (36.0) | 40 g (35.8) |
| Total fat (% calories from fat) | 11 g (27.4) | 18 g (24.2) | 29 g (37.3) |
| Total protein (% calories from protein) | 13 g (15.6) | 20 g (22.0) | 6 g (37.3) |
| Percent meal completed (SD) | 96 (9) | 81 (17.6) | 78 (20.6) |
SD, standard deviation.
Table 3.
Meal‐stimulated area under the curve of incretin, insulin and glucose and percent difference in area under the curve between liquid‐mixed meal vs. other meals‐stimulated response in subjects who underwent surgical or medical weight loss
| A. Active GLP‐1 (1000 pg/ml/min) | |||||
|---|---|---|---|---|---|
| AUC | Percent difference in AUC | ||||
| Liquid‐mixed | Solid‐mixed | High‐fat | Liquid vs. solid | Liquid vs. high‐fat | |
| RYGB1 | 11.53 | 4.57 | 15.86 | 152.5 | −27.3 |
| RYGB2 | 13.29 | 11.04 | 9.30 | 20.4 | 43.0 |
| SG1 | 5.91 | 4.18 | 3.40 | 41.6 | 73.9 |
| SG2 | 9.39 | 4.26 | 2.56 | 120.4 | 266.3 |
| MWL1 | 0.72 | 0.66 | 0.85 | 8.9 | −14.9 |
| MWL2 | 4.46 | 3.85 | 3.90 | 15.8 | 14.5 |
| B. GIP (1000 pg/ml/min) | |||||
| AUC | Percent difference in AUC | ||||
| Liquid‐mixed | Solid‐mixed | High‐fat | Liquid vs. solid | Liquid vs. high‐fat | |
| RYGB1 | 33.45 | 20.57 | 24.50 | 62.6 | 36.5 |
| RYGB2 | 58.37 | 32.55 | 46.62 | 79.3 | 25.2 |
| SG1 | 116.98 | 39.58 | 76.99 | 195.6 | 51.9 |
| SG2 | 172.83 | 79.88 | 140.07 | 116.4 | 23.4 |
| MWL1 | 34.92 | 20.96 | 57.79 | 66.6 | −39.6 |
| MWL2 | 100.76 | 73.47 | 88.57 | 37.1 | 13.8 |
| C. Insulin (1000 pg/ml/min) | |||||
| AUC | Percent difference in AUC | ||||
| Liquid‐mixed | Solid‐mixed | High‐fat | Liquid vs. solid | Liquid vs. high‐fat | |
| RYGB1 | 279.43 | 115.75 | 96.57 | 141.4 | 189.4 |
| RYGB2 | 760.80 | 386.69 | 477.97 | 96.7 | 59.2 |
| SG1 | 268.17 | 80.06 | 72.36 | 234.9 | 270.6 |
| SG2 | 449.15 | 181.53 | 208.32 | 147.4 | 115.6 |
| MWL1 | 241.66 | 143.27 | 154.40 | 68.7 | 56.5 |
| MWL2 | 240.91 | 195.95 | 154.75 | 22.9 | 55.7 |
| D. Glucose (1000 mg/dl/min) | |||||
| AUC | Percent difference in AUC | ||||
| Liquid‐mixed | Solid‐mixed | High‐fat | Liquid vs. solid | Liquid vs. high‐fat | |
| RYGB1 | 21.20 | 18.08 | 21.72 | 17.3 | −2.4 |
| RYGB2 | 19.10 | 19.88 | 18.56 | −3.9 | 2.9 |
| SG1 | 22.25 | 19.38 | 17.61 | 14.8 | 26.3 |
| SG2 | 23.39 | 20.33 | 21.80 | 15.1 | 7.3 |
| MWL1 | 18.86 | 21.05 | 22.71 | −10.4 | −17.0 |
| MWL2 | 21.62 | 22.38 | 22.32 | −3.4 | −3.2 |
% Difference was calculated using the formula ((V1−V2)/V2)*100)
AUC, area under the curve; MWL, medical weight loss; RYGB, Roux‐en‐Y gastric bypass; SG, sleeve gastrectomy.
Figure 1 shows the incretin, insulin and glucose response to the liquid‐mixed meal in all six individuals. GLP‐1 peak was higher in two individuals after RYGB compared with SG and MWL. The insulin peak was also higher in the RYGB group compared with the SG and MWL groups. The GIP peak was higher in the SG group compared with the RYGB and MWL groups. Both the glucose peak and nadir were seen in the RYGB group (Figure 1).
Figure 1.
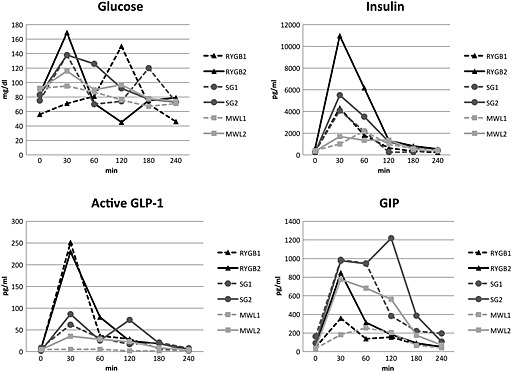
Incretin, insulin and glucose response to liquid‐mixed meal tolerance test. GIP, glucose‐dependent insulinotropic polypeptide; GLP‐1, glucagon‐like peptide‐1; MWL, medical weight loss; RYGB, Roux‐en‐Y gastric bypass; SG, sleeve gastrectomy.
Discussion
We found that the liquid‐mixed meal was the best tolerated meal, with the greatest amount consumed and less variability in macronutrient consumption across the participants when compared with the other two test meals studied. Also, in individuals who underwent surgical weight loss, the liquid‐mixed meal best stimulated incretins and insulin response compared with the other two meals studied. In addition, the liquid‐mixed meal appeared to stimulate greater differences in incretin changes and glycemic variability between those who underwent RYGB vs. SG. For example, we found that the liquid‐mixed meal stimulated GLP‐1 and insulin AUC that were higher in the RYGB group compared with the SG group. In contrast, GIP AUC was higher in the SG group compared with the RYGB group. The greater GIP and lower insulin secretion and less glycemic variability after SG compared with RYGB we hypothesized was because of the known difference in bypassing (RYGB) or leaving intact (SG) the proximal intestine where GIP is secreted from the K cells 12.
Similar to the surgical groups, the liquid‐mixed meal in the MWL group also elicited a higher prandial insulin response compared with the other two meals; however, the prandial incretin response in the MWL group was similar across all three meals. Interestingly, one of our two MWL individuals had lost a substantial amount of weight (total 104 lb) matching that of our post‐RYGB and post‐SG individuals. Despite the significant weight loss however, this MWL individual lacked robust prandial incretin and insulin response typical in post‐RYGB and post‐SG individuals regardless of the type of test meal. This observation supports the previous finding that surgical weight loss, in particular RYGB and SG, leads to enhanced prandial incretin and insulin response independent of the degree of weight loss 9, 13. Our findings suggest that liquid‐mixed meal when compared with the other test meals stimulates the strongest prandial insulin response in both the surgical weight loss and medical weight loss groups. Furthermore, we found that the liquid‐mixed meal elicited the strongest prandial incretin response in both surgical weight loss groups (RYGB and SG).
We also found that the concurrent glucose variability, as measured by the difference between the peak and nadir glucose values during the meal tolerance test, was higher in the RYGB group compared with the SG group. In fact, both post‐RYGB individuals reached a postprandial glucose peak beyond the normal peak (150 and 169 mg dl−1, respectively; normal: less than 140 mg dl−1) and glucose nadir in the hypoglycemic range (46 and 45 mg dl−1, respectively) without symptoms in conjunction with a similar glucose variability seen in a recent study of RYGB patients with pre‐existing diabetes 14, 15. This finding coincides with a higher GLP‐1 and insulin secretion in the RYGB group compared with the SG and MWL groups, suggesting the role of dramatically increased GLP‐1 and insulin secretion in altered glycemic profile after RYGB as seen in previous studies 16, 17. However, caution must be taken to associate GLP‐1 with glycemic improvement in patients with diabetes because the role of GLP‐1 in this context appears limited especially in the short‐term period after the RYGB 18. Interestingly, none of the two individuals in our study who underwent RYGB had pre‐existing diabetes; the clinical importance of glycemic excursion outside the normal range, in particular hyperglycemia above the normal limit, remains unclear.
This study had several unique features to help determine the optimal meal for the study of meal‐stimulated incretin and insulin response, such as the inclusion of individuals who underwent three different weight loss methods (RYGB, SG or MWL), design of test meals varying in macronutrients and consistency, and evaluation of the ease of meal consumption and any associated symptoms. Study limitations include small sample size, cross‐sectional design targeting individuals who underwent weight loss at least 6 months prior to participating in this study, lack of measurement of other hormones related to glucose homeostasis such as glucagon and inflammatory markers and the difference in total calories among the three meals.
In conclusion, we found that the liquid‐mixed meal was better and more uniformly tolerated among the individuals in our study regardless of their method of weight loss. The liquid‐mixed meal stimulated incretin and insulin response to the greatest degree compared with the high‐fat and solid‐mixed meals. It also was best at stimulating prandial incretin and insulin response in bariatric surgical individuals. These results suggest that the liquid‐mixed meal is the preferred test meal for studying the changes in glucose homeostasis after bariatric surgery.
Conflicts of interest
No conflict of interest was declared.
Funding
None.
Acknowledgement
This research was supported by Grant Number KL2 (5KL2TR001077‐02) as part of the Institute for Clinical and Translational Research Grant from the NIH/NCAT, Julius Edlow MD grant from the Division of Endocrinology, Diabetes and Metabolism, The Johns Hopkins University and research grant from the American Society for Metabolic and Bariatric Surgery. We thank Dr. Jeanne M. Clark for her assistance with project design and data analysis.
Lee, C. J. , Brown, T. T. , Cheskin, L. J. , Choi, P. , Moran, T. H. , Peterson, L. , Matuk, R. , and Steele, K. E. (2015) Effects of meal composition on postprandial incretin, glucose and insulin responses after surgical and medical weight loss. Obesity Science & Practice, 1: 104–109. doi: 10.1002/osp4.17.
References
- 1. Sjostrom L, Peltonen M, Jacobson P, et al. Bariatric surgery and long‐term cardiovascular events. JAMA 2012; 307: 56–65. [DOI] [PubMed] [Google Scholar]
- 2. Buchwald H, Estok R, Fahrbach K, et al. Weight and type 2 diabetes after bariatric surgery: systematic review and meta‐analysis. Am J Med 2009; 122: 248–256.e5. [DOI] [PubMed] [Google Scholar]
- 3. Jimenez A, Casamitjana R, Flores L, et al. Long‐term effects of sleeve gastrectomy and roux‐en‐Y gastric bypass surgery on type 2 diabetes mellitus in morbidly obese subjects. Ann Surg 2012; 256: 1023–1029. [DOI] [PubMed] [Google Scholar]
- 4. Korner J, Bessler M, Inabnet W, Taveras C, Holst JJ. Exaggerated glucagon‐like peptide‐1 and blunted glucose‐dependent insulinotropic peptide secretion are associated with roux‐en‐Y gastric bypass but not adjustable gastric banding. Surg Obes Relat Dis 2007; 3: 597–601. [DOI] [PMC free article] [PubMed] [Google Scholar]
- 5. Monte SV, Caruana JA, Ghanim H, et al. Reduction in endotoxemia, oxidative and inflammatory stress, and insulin resistance after roux‐en‐Y gastric bypass surgery in patients with morbid obesity and type 2 diabetes mellitus. Surgery 2012; 151: 587–593. [DOI] [PubMed] [Google Scholar]
- 6. Lee WJ, Chen CY, Chong K, et al. Changes in postprandial gut hormones after metabolic surgery: a comparison of gastric bypass and sleeve gastrectomy. Surg Obes Relat Dis 2011; 7: 683–690. [DOI] [PubMed] [Google Scholar]
- 7. Zaccaria M, De Palo E, Zago E, et al. Metabolic and endocrine responses to a standard mixed meal. A physiologic study. Acta Diabetol Lat 1979; 16: 45–53. [DOI] [PubMed] [Google Scholar]
- 8. Goldfine AB, Mun EC, Devine E, et al. Patients with neuroglycopenia after gastric bypass surgery have exaggerated incretin and insulin secretory responses to a mixed meal. J Clin Endocrinol Metab 2007; 92: 4678–4685. [DOI] [PubMed] [Google Scholar]
- 9. Laferrere B, Teixeira J, McGinty J, et al. Effect of weight loss by gastric bypass surgery versus hypocaloric diet on glucose and incretin levels in patients with type 2 diabetes. J Clin Endocrinol Metab 2008; 93: 2479–2485. [DOI] [PMC free article] [PubMed] [Google Scholar]
- 10. Ghanim H, Abuaysheh S, Sia CL, et al. Increase in plasma endotoxin concentrations and the expression of toll‐like receptors and suppressor of cytokine signaling‐3 in mononuclear cells after a high‐fat, high‐carbohydrate meal: Implications for insulin resistance. Diabetes Care 2009; 32: 2281–2287. [DOI] [PMC free article] [PubMed] [Google Scholar]
- 11. Deopurkar R, Ghanim H, Friedman J, et al. Differential effects of cream, glucose, and orange juice on inflammation, endotoxin, and the expression of toll‐like receptor‐4 and suppressor of cytokine signaling‐3. Diabetes Care 2010; 33: 991–997. [DOI] [PMC free article] [PubMed] [Google Scholar]
- 12. Christensen M, Vedtofte L, Holst JJ, Vilsboll T, Knop FK. Glucose‐dependent insulinotropic polypeptide: a bifunctional glucose‐dependent regulator of glucagon and insulin secretion in humans. Diabetes 2011; 60: 3103–3109. [DOI] [PMC free article] [PubMed] [Google Scholar]
- 13. Roslin MS, Dudiy Y, Brownlee A, Weiskopf J, Shah P. Response to glucose tolerance testing and solid high carbohydrate challenge: comparison between roux‐en‐Y gastric bypass, vertical sleeve gastrectomy, and duodenal switch. Surg Endosc 2014; 28: 91–99. [DOI] [PubMed] [Google Scholar]
- 14. Workgroup on Hypoglycemia, American Diabetes Association . Defining and reporting hypoglycemia in diabetes: a report from the american diabetes association workgroup on hypoglycemia. Diabetes Care 2005; 28: 1245–1249. [DOI] [PubMed] [Google Scholar]
- 15. Jimenez A, Ceriello A, Casamitjana R, et al. Remission of type 2 diabetes after roux‐en‐Y gastric bypass or sleeve gastrectomy is associated with a distinct glycemic profile. Ann Surg 2015; 261: 316–322. [DOI] [PubMed] [Google Scholar]
- 16. Nannipieri M, Baldi S, Mari A, et al. Roux‐en‐Y gastric bypass and sleeve gastrectomy: mechanisms of diabetes remission and role of gut hormones. J Clin Endocrinol Metab 2013; 98: 4391–4399. [DOI] [PubMed] [Google Scholar]
- 17. Salehi M, Prigeon RL, D'Alessio DA. Gastric bypass surgery enhances glucagon‐like peptide 1‐stimulated postprandial insulin secretion in humans. Diabetes 2011; 60: 2308–2314. [DOI] [PMC free article] [PubMed] [Google Scholar]
- 18. Vetter ML, Wadden TA, Teff KL, et al. GLP‐1 plays a limited role in improved glycemia shortly after roux‐en‐Y gastric bypass: A comparison to intensive lifestyle modification. Diabetes 2015; 64: 434–446. [DOI] [PMC free article] [PubMed] [Google Scholar]