

Abstract
Aim
To determine the effects of protein alone (independent of fat and carbohydrate) on postprandial glycaemia in individuals with Type 1 diabetes mellitus using intensive insulin therapy.
Methods
Participants with Type 1 diabetes mellitus aged 7–40 years consumed six 150 ml whey isolate protein drinks [0 g (control), 12.5, 25, 50, 75 and 100] and two 150 ml glucose drinks (10 and 20 g) without insulin, in randomized order over 8 days, 4 h after the evening meal. Continuous glucose monitoring was used to assess postprandial glycaemia.
Results
Data were collected from 27 participants. Protein loads of 12.5 and 50 g did not result in significant postprandial glycaemic excursions compared with control (water) throughout the 300 min study period (P > 0.05). Protein loads of 75 and 100 g resulted in lower glycaemic excursions than control in the 60–120 min postprandial interval, but higher excursions in the 180–300 min interval. In comparison with 20 g glucose, the large protein loads resulted in significantly delayed and sustained glucose excursions, commencing at 180 min and continuing to 5 h.
Conclusions
Seventy‐five grams or more of protein alone significantly increases postprandial glycaemia from 3 to 5 h in people with Type 1 diabetes mellitus using intensive insulin therapy. The glycaemic profiles resulting from high protein loads differ significantly from the excursion from glucose in terms of time to peak glucose and duration of the glycaemic excursion. This research supports recommendations for insulin dosing for large amounts of protein.
What's new?
This research looks at the postprandial glycaemic impact of dietary protein alone, without carbohydrate or fat, in people Type 1 diabetes mellitus.
Thirty‐two subjects were recruited; 16 were < 18 years of age.
To our knowledge, there are no published studies regarding this.
The results indicate that large amounts of protein consumed alone cause delayed and sustained postprandial glycaemic excursions 3–5 h after the meal.
Findings support recommendations to consider additional insulin doses for large amounts of protein.
Introduction
Postprandial glycaemic excursions are a significant problem for people with Type 1 diabetes mellitus, often despite accurate carbohydrate counting and insulin calculation 1, 2, 3. Postprandial hyperglycaemia may play an important role in the development of complications of diabetes, even when HbA1c is in target 4, 5. The importance of optimization of postprandial glycaemic profiles using intensive insulin therapy has been well established and is the current recommended therapy for people with Type 1 diabetes 6.
Currently, intensive insulin therapy requires carbohydrate quantification to calculate mealtime insulin doses. This is based on the recommendation that carbohydrate is the main macronutrient influencing postprandial glycaemia 7. However, studies have demonstrated that protein and fat may also impact upon postprandial blood glucose levels 8, 9.
Protein‐rich meals may result in delayed and sustained postprandial glycaemic excursions and increased insulin requirements in people with Type 1 diabetes 8, 9, 10, 11. Algorithms to calculate additional insulin for protein have been suggested 12, however, studies have indicated an increase in the frequency of postprandial hypoglycaemia with their use 10, 13.
To date, protein has been studied only as a component of mixed meals. No published studies of the glycaemic impact of only protein in individuals with Type 1 diabetes were found. The objective of this study was to determine the postprandial blood glucose dose‐response curves to varying amounts of protein, independent of carbohydrate and fat.
Patients and methods
We conducted a within‐subject repeated measures randomized crossover trial involving the provision of test drinks containing varied amounts of protein and glucose. The study was conducted across two centres in Newcastle, Australia. Eligibility criteria included age 7–40 years (inclusive), HbA1c ≤ 69 mmol/mol (8.5%) (Primus PDQ A1c Analyzer; Primus, Kansas City, MO, USA), Type 1 diabetes present for ≥ 12 months and using either insulin pump therapy or multiple daily injections (≥ 4 injections daily) for ≥ 6 months with a healthy BMI, defined as 18.50–24.99 for adults 14 and ≤ 91st percentile for children and adolescents 15. Participants were recruited from the John Hunter Children's Hospital and the Aim Diabetes Management Centre. Exclusion criteria included medical comorbidities and complications of diabetes. Ethics approval was obtained from Hunter New England Research Ethics Committee and the University of Newcastle Human Research Ethics Committee. Written informed consent was obtained. The study was registered with the Australian New Zealand Clinical Trials Registry (ACTRN12513000215729).
To determine protein loads that would be representative of protein‐rich meals, we conducted a web‐based analysis of popular steak restaurant menus in London, UK on travel website Trip Advisor 16. A 300 g grilled beef rump steak (containing ~90 g protein) 17 was offered on 17 menus. A further nine menus offered ≥ 400 g steaks (~120 g protein) 17, whereas an 850 g steak was offered on one menu.
Study procedure
Participants were contacted daily for one week by a credentialed diabetes educator, to review blood glucose levels, ensuring that 24 h targets were met. If fasting glucose levels were > 13 or < 3.6 mmol/l prior to the test drink, participants were instructed to treat as per usual management and the study day excluded and repeated.
Test drinks were administered in a randomized order 4 h post evening meal, over 8 days without insulin. Participants were randomized to the order of treatment using an eight by eight Latin square design. Randomization was achieved using Proc Plan in the SAS Statistical Software package (SAS Institute Inc., Cary, NC, USA).
The evening meal was standardized for amount and type of carbohydrate, fat and protein. Insulin was given as per individual insulin/carbohydrate ratios. Participants fasted for 5 h following test drinks and activity was standardized. Participants were contacted daily to ensure adherence to protocol. Insulin pump therapy infusion sites were changed second daily.
Test drinks
Pre‐measured test drinks of protein and glucose powders were provided to participants in sealed bags and blended with 150 ml water. Powder was weighed using Salter kitchen scales (model 323; Salter, Tonbridge, UK) (error ± 1 g).
In addition to the menu analysis, protein loads were based on the Pankowska fat–protein unit (FPU) algorithm 12 where additional insulin is calculated for every 100 kcal of fat and/or protein (25 g of protein). Protein loads were 0 kcal (0 g), 50 kcal (12.5 g), 100 kcal (25 g), 200 kcal (50 g), 300 kcal (75 g) and 400 kcal (100 g); glucose loads were 10 and 20 g. The glucose and water drinks were included as reference meals for comparison.
Protein drinks were made using 100% pure whey isolate protein powder (27 g protein, 0 g lipid, 0 g carbohydrate per 30 g) Isolyze™ (Species Nutrition, Westbury, NY, USA). Glucodin powder (5 g glucose, 0 g protein and 0 g lipid per 5 g) was used for glucose drinks (Valeant Pharmaceuticals Australasia, Rhodes, NSW, Australia).
Glucose measurement
Continuous glucose monitoring was used (Dexcom G4 Platinum, Inc., San Diego, CA, USA). The sensor was inserted in the abdominal subcutaneous tissue 24 h prior to study commencement to avoid potential bias from suboptimal continuous glucose monitoring performance on day 1. Participants were instructed to enter two blood glucose levels daily into the monitor for calibration. On completion of the study, continuous glucose monitoring data were downloaded using Dexcom studio data system (Dexcom Inc.).
Statistical analysis
A sample size of 32 was determined to provide 80% power at the 5% significance level to detect a potential mean difference in glucose of 2.0 mmol/l at 5 h between protein and glucose loads, assuming a within‐person standard deviation of differences in blood glucose levels of 3.1 mmol/l. The standard deviation for the sample size calculation was based on data from our previous published studies 11, 18. We did not base the sample size calculation on one particular comparison because our overall objective was to examine the potential dose response of a protein meal.
The primary outcome measure was the mean postprandial glucose excursion over 60–min intervals (60–120, 120–180, 180–240 and 240–300 min) for 5 h. Secondary outcomes included the mean time to reach maximal glucose level within the 300–min period and the proportion of time the blood glucose level exceeded 10 mmol/l. Glucose excursion data for hypoglycaemic events were not included after the time of the event. Differences in mean glucose excursions over each 60–min interval were tested using generalized linear mixed models to account for repeated measurements on the same subject, with the dataset restricted to the period of interest (e.g. all measures between 180 and 240 min). A model was fitted to the data with blood glucose level excursion as the outcome and categorical predictor variables for meal type and time, with subject included as a random effect. Error terms within subject were assumed to be independent. Generalized linear mixed models were also used to test for differences in time to reach maximal glucose level. Logistic regression within a generalized estimating equation framework was used to determine if there was a difference between meal types in the proportion of times subjects blood glucose level exceeded 10 mmol/l.
Values of P < 0.05 were considered statistically significant. Although we carried out a relatively large number of statistical tests, we have not adjusted the cut‐point to determine statistical significance because many of the tests are highly correlated and our main aim is to describe trends in the response profiles of subjects to the different meal types. This is also consistent with our use of 95% confidence intervals (95% CI). Summary statistics for demographic characteristics are presented as counts and percentages for categorical variables and mean ± sd for continuous variables. Effect sizes, such as differences in means, are presented as the effect size of interest with 95% CI.
Results
Thirty‐two participants were recruited, with 27 completing the protocol. Three participants withdrew prior to commencement and data from two further participants were excluded due to illness or failure to follow protocol. Sensor failure occurred on four occasions. On each occasion, the sensor was replaced and the day repeated. Incomplete days for hypoglycaemia, illness and failure to follow the protocol were excluded and repeated where possible. Data from all other days were included in the analysis. Recruitment and analysis attrition is presented in Fig. 1. The baseline characteristics of the 27 participants analysed are presented in Table 1.
Figure 1.
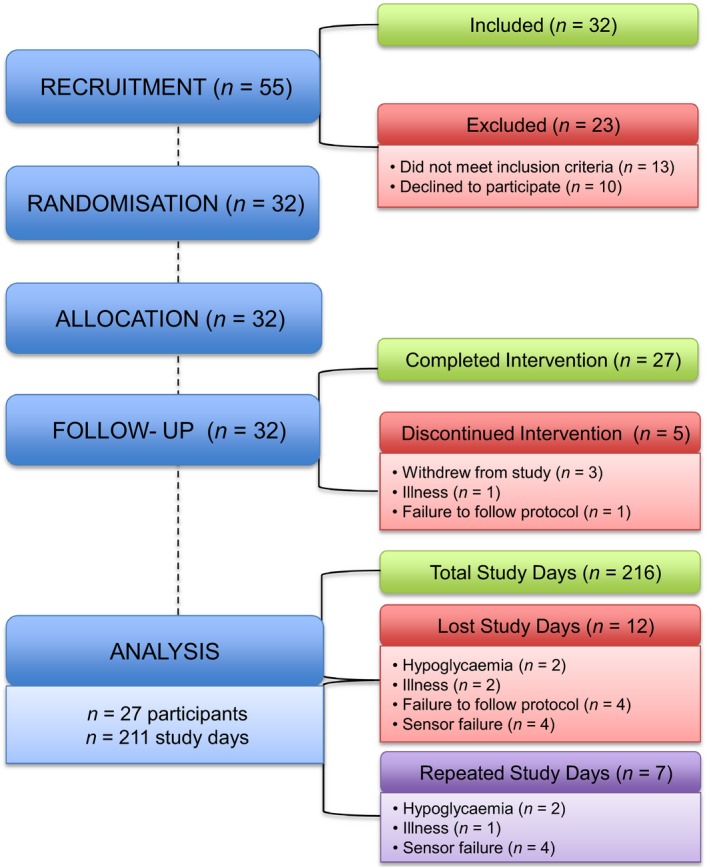
CONSORT diagram showing the attrition of participants from recruitment to data analysis. 55 participants were assessed for eligibility. 32 participants were randomized with 5 participants withdrawing from the intervention. A total of 211 study days were analysed.
Table 1.
Summary of clinical characteristics of participants (N = 27)
| Demographics | |
|---|---|
| Sex | |
| Male, n | 11 |
| Female, n | 16 |
| Insulin pump therapy, n | 14 |
| Multiple daily injection therapy, n | 12 |
| Age, years | 21.7 ± 11.7 |
| Duration of diabetes, years | 7.8 ± 6.8 |
| HbA1c, mmol/mol (%) | 52 ± 9.1 (6.9 ± 0.8) |
| BMI | 21 ± 3.1 |
Data are presented as means ± sd.
Postprandial glucose excursions
Figure 2 presents the mean postprandial glucose excursions by meal type at each time point for the full 300–min study period. There were no significant differences between starting blood glucose values in all participants at the commencement of the study (P > 0.05).
Figure 2.
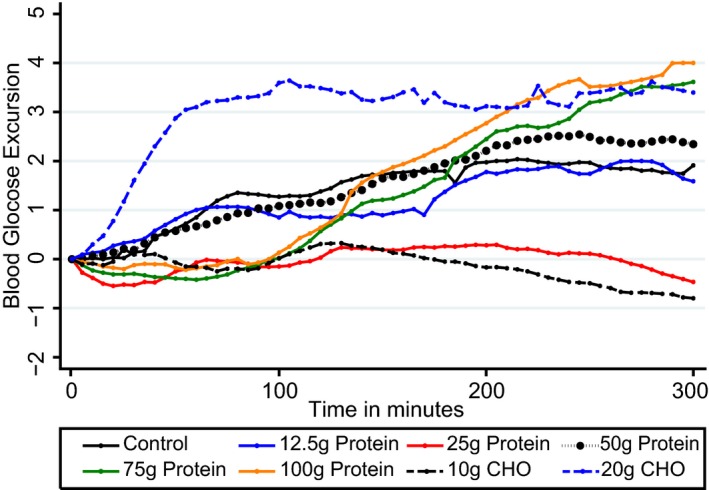
Mean postprandial glycaemic excursions for 27 participants following consumption of 8 test drinks containing 0, 12.5, 25, 50, 75 and 100 g of protein; with two glucose (CHO) test drinks given for comparison, in amounts of 10 and 20 g without insulin. Compared with 0, 75 and 100 g protein loads produced significantly higher glycaemic excursions from 180‐240 min (P = 0.002) and 240–300 min (P < 0.001). Glucose levels from 75 and 100 g protein were similar to that of 20 g CHO given without insulin however the shape of the response was different. CHO, carbohydrate.
Mean differences in glycaemic excursions from all test meals compared with control are presented in Table 2. The 20 g glucose drink was the only test drink to produce a statistically significant increased glycaemic excursion from 60 to 120 min compared with control, 1.9 mmol/l (95% CI 1.42– 2.51) higher (P < 0.001). The 25, 75 and 100 g protein drinks resulted in significantly lower mean glucose responses between 60 and 120 min [–1.06 mmol/l (95% CI –1.57 to –0.54), –1.10 mmol/l (95% CI –1.63 to –0.57), –1.22 mmol/l (95% CI –1.74 to –0.71)] compared with control (all P < 0.001).
Table 2.
Difference in mean postprandial glucose excursions of the 27 participants for each meal type (mmol/l) compared with the control mean
| Test meal | 60–120 min | 120–180 min | 180–240 min | 240–300 min |
|---|---|---|---|---|
| 0 g protein | Referent | Referent | Referent | Referent |
| 10 g carbohydrate | −1.37* (−1.89 to −0.86) | −1.75* (−2.34 to −1.17) | −2.49* (−3.15 to −1.83) | −2.83* (−3.50 to −2.15) |
| 20 g carbohydrate | 1.97* (1.42 to 2.51) | 1.38* (0.76 to 2.01) | 0.87* (0.14 to 1.59) | 1.37* (0.64 to 2.10) |
| 12.5 g protein | 0.00 (−0.53 to 0.52) | −0.43 (−1.04 to 0.18) | 0.21 (−0.48 to 0.90) | 0.43 (−0.28 to 1.14) |
| 25 g protein | −1.06* (−1.57 to −0.54) | −1.10* (−1.69 to −0.51) | −1.38* (−2.04 to −0.71) | −1.70* (−2.38 to −1.01) |
| 50 g protein | −0.26 (−0.76 to 0.25) | −0.09 (−0.66 to 0.48) | 0.28 (−0.37 to 0.94) | 0.50 (−0.17 to 1.17) |
| 75 g protein | −1.10* (−1.63 to −0.57) | −0.27 (−0.87 to 0.33) | 0.71* (0.01 to 1.41) | 1.65* (0.93 to 2.36) |
| 100 g protein | −1.22* (−1.74 to −0.71) | 0.00 (−0.59 to 0.58) | 1.06* (0.40 to 1.73) | 1.72* (1.04 to 2.41) |
Data are presented as means (95% CI). *Statistically different compared with 0 g protein at alpha = 0.05.
Significant differences in mean glucose excursions between the 75 and 100 g protein drinks and control became apparent from 180 min, with higher mean excursions of 0.71 (95% CI 0.01–1.41) (P = 0.045) and 1.06 mmol/l/l (95% CI 0.40–1.73) (P = 0.002) during the 180–240–min time interval. The glycaemic impact from 75 and 100 g protein was sustained during the 240–300–min interval, with significantly higher mean glycaemic excursions than control [1.65 mmol/l (95% CI 0.93–2.36) for 75 g and 1.72 mmol/l (95% CI 1.04–2.41) (both P < 0.001) for the 100 g protein load].
Glucose levels in the 180–240 and 240–300–min intervals for 75 and 100 g protein were similar to that of 20 g glucose (Fig. 1) (all P < 0.05); however, continuous glucose monitoring profiles suggest an ongoing rise after 5 h for 75 and 100 g protein compared with 20 g glucose. The glycaemic excursions following 25 and 50 g protein did not differ significantly from control over the 300–min study period (Fig. 1).
There was a statistically significant increase in the odds of glucose levels exceeding 10 mmol/l following 12.5 g protein [odds ratio (OR) = 2.70 (95% CI 2.19–3.34)], 50 g protein [OR = 2.61 (95% CI 2.13–3.18)], 75 g protein [OR 1.91 (95% CI 1.55–2.37)], 100 g protein [OR 2.03 (CI 1.66–2.49)] and 20 g of glucose [OR 1.48 (CI 1.19–1.84); all P < 0.001] from 180 to 300 min.
Mean time to peak glucose rise
The postprandial glycaemic excursion from 20 g of glucose peaked by 60 min and remained at the peak level until 300 min. By contrast, the glycaemic excursion following 75 and 100 g protein did not commence until 90 min, reaching the same level as 20 g glucose close to 180 min. The excursion from 75 and 100 g of protein continued for the 300–min study period and was statistically significantly longer in the 100 g protein group compared with control (P = 0.021). Time to peak blood glucose level over the 300 min was not significantly different in the 10 g or 20 g glucose or 12.5, 25, 50 or 75 g protein groups compared with control (all P > 0.05).
Discussion
This study demonstrated that ≥ 75 g of protein consumed alone causes significantly higher postprandial glycaemic excursions between 3 and 5 h compared with a control drink of water only.
As expected, 20 g of glucose produced the earliest peak level compared with other test drinks. Postprandial glucose rose within the first 30 min, peaked by 60 min and was sustained for 300 min. By contrast, following ingestion of 75 and 100 g protein, postprandial glucose decreased from 0 to 90 min and did not begin to increase until between 90 and 100 min, becoming significantly higher than control and reaching the peak excursion observed from 20 g glucose close to 180 min.
The glycaemic impact of dietary protein has long been a topic of debate. Early researchers hypothesized that 100 g of ingested protein produced 50–80 g glucose 19. Later, it was shown that only ~10 g of glucose appeared in the circulation following ingestion of 50 g protein; equating to ~1 g of glucose produced from every 5 g of protein 20. The results of the present study are consistent with this equation, indicating that ~75 and 100 g of protein alone may produce late glycaemic responses similar to that from 15 and 20 g of glucose. This is clinically relevant, given that 20 g of ingested glucose causes significant postprandial hyperglycaemia when insulin is not given 18. However, the impact from protein is delayed and sustained; with resultant implications for insulin dosing.
Previously it has been demonstrated that the addition of 40 g of protein to standard meals resulted in increased postprandial glucose levels 11. However, in the current study, ≤ 50 g of isolated protein did not produce a significant postprandial glucose response over the 300–min study period. Elevated glucose levels were not seen until ≥ 75 g protein was ingested.
This research highlights important clinical considerations. To our knowledge, this is the first study to document the postprandial glycaemic response to protein alone. This helps inform our understanding of the glycaemic impact of protein; providing further supporting evidence of additional insulin requirements to offset late glucose rises following high‐protein meals.
Our findings are consistent with previous studies, whereby the glycaemic response to protein occurred in the late postprandial period, i.e. 3 to 5 h 8, 9, 10, 11. This supports suggestions that insulin for protein‐rich meals should ideally be administered using an extended dual‐wave bolus for those using insulin pump therapy. Reduced postprandial glycaemic excursions have previously been demonstrated using this bolus function 21, 22, 23. Further studies are needed to help define the amount of additional insulin required for protein‐rich meals and importantly, how to effectively deliver these doses.
These findings also support evidence that high‐protein meals may assist in preventing nocturnal hypoglycaemia 11, 24, while also highlighting the need to consider the glycaemic impact of protein when assessing basal insulin profiles. Consumption of carbohydrate‐free meals (protein/fat only) is sometimes recommended clinically for this purpose, however, there are suggestions that skipping a meal altogether may be a more accurate method to determine basal insulin requirements 25. Further, our findings are of relevance for those following high‐protein, low‐carbohydrate diets, which are increasing in popularity.
The mechanisms by which protein causes late and sustained postprandial hyperglycaemia in Type 1 diabetes are still not fully understood. It has been postulated that postprandial hyperglycaemia may be a result of increased glucagon secretion 26. Gannon et al. 27 demonstrated this following ingestion of most proteins; however, this response was markedly attenuated by the co‐ingestion of glucose. These data suggest that glucagon may play an important role in protein metabolism. The glycaemic response to protein seen in this study might, therefore, be a result of glucagon secretion. However, it is difficult to be certain of this, given that the peak glucagon rise to protein in Gannon's study was seen by 60 min (although it did decline, the effect was still present at 300 min), whereas the postprandial glucose rise following ≥ 75 g of protein in this study does not commence until after 90 min.
Gluconeogenesis of amino acids has also been suggested as a possible cause of delayed postprandial hyperglycaemia from protein 9. Further studies are needed to fully understand these mechanisms.
A potential limitation of this study was that postprandial glucose was only measured for 5 h. This was consistent with previous research; however, data from the current study show that the glycaemic excursion from the large protein loads continues until 5 h and therefore a longer study period should be considered. Furthermore, continuous glucose monitoring was unblinded; however, traces were carefully monitored for non‐adherence to the protocol and these data excluded. Intra‐individual variation could be a limitation, although a crossover design removed the within‐participant effect controls for individual characteristics, removing sources of variability and increasing power. Lastly, the large protein loads used may not represent average protein intake. However, we chose to include these amounts to ensure that the potential impact of a range of protein loads was investigated.
In conclusion, this is the first study to demonstrate the glycaemic impact of protein alone on postprandial glycaemia in individuals with Type 1 diabetes using intensive insulin therapy. This study has shown that when protein is consumed alone, a substantially larger amount is required to have an impact on postprandial glucose than when part of a mixed meal. We have demonstrated that ingestion of ≥ 75 g of protein produced a late and sustained glycaemic excursion. These findings support the recommendation to consider dietary protein when calculating insulin doses for protein‐rich meals.
Funding sources
This project was supported by a competitive Novo Nordisk Regional Support Scheme Grant, administered by the Australian Paediatric Endocrine Group (APEG).
Competing interests
None declared.
Acknowledgements
The authors would like to thank the Paediatric diabetes team at the John Hunter Children's Hospital for assistance with subject recruitment. Parts of this study were presented at the 74th Scientific Sessions of the American Diabetes Association, San Francisco, California, 13–17 June 2014.
Diabet. Med. 33, 592–598 (2016)
(Australian New Zealand Clinical Trials Registry No.: ACTRN12513000215729)
References
- 1. Boland E, Monsod T, Delucia M, Brandt CA, Fernando S, Tamborlane WV. Limitations of conventional methods of self‐monitoring of blood glucose: lessons learned from 3 days of continuous glucose sensing in pediatric patients with type 1 diabetes. Diabetes Care 2001; 24: 1858–1862. [DOI] [PubMed] [Google Scholar]
- 2. MacDonald K, Lowe JM, Barker D, Mensch M, Attia J. Effect of popular takeaway foods on blood glucose levels in type 1 diabetes mellitus patients on intensive insulin therapy. Int J Clin Pract 2009; 63: 189–194. [DOI] [PubMed] [Google Scholar]
- 3. Ann Ahern J, Gatcomb PM, Held NA, Petit WA, Tamborlane WV. Exaggerated hyperglycemia after a pizza meal in well‐controlled diabetes. Diabetes Care 1993; 16: 578–580. [DOI] [PubMed] [Google Scholar]
- 4. Brownlee M, Hirsch IB. Glycaemic variability: a hemaglobin A1c‐independent risk factor for diabetic complications. JAMA 2006; 295: 1707–1708. [DOI] [PubMed] [Google Scholar]
- 5. Hirsch IB, Brownlee M. Should minimal glucose variabilty become the gold standard of glycaemic control? J Diabetes Complicat 2005; 19: 178–181. [DOI] [PubMed] [Google Scholar]
- 6. American Diabetes Association . Standards of medical care in diabetes – 2014. Diabetes Care 2014; 37(Suppl 1): S14–S80. [DOI] [PubMed] [Google Scholar]
- 7. Rabasa‐Lhoret R, Garon J, Langelier H, Poisson D, Chiasson JL. Effects of meal carbohydrate content on insulin requirements in type 1 diabetic patients treated intensively with the basal–bolus (ultralente–regular) insulin regimen. Diabetes Care 1999; 22: 667–673. [DOI] [PubMed] [Google Scholar]
- 8. Peters AL, Davidson MB. Protein and fat effects on glucose responses and insulin requirements in subjects with insulin‐dependent diabetes mellitus. Am J Clin Nutr 1993; 58: 555–560. [DOI] [PubMed] [Google Scholar]
- 9. Winiger G, Keller U, Laager R, Girard J, Berger W. Protein content of the evening meal and nocturnal plasma glucose reglulation in Type 1 diabetic subjects. Horm Res 1995; 44: 101–104. [DOI] [PubMed] [Google Scholar]
- 10. Pankowska E, Blazik M, Groele L. Does the fat–protein meal increase postprandial glucose level in type 1 diabetes patients on insulin pump: the conclusion of a randomized study. Diabetes Technol Ther 2012; 14: 16–22. [DOI] [PubMed] [Google Scholar]
- 11. Smart CE, Evans M, O'Connell SM, McElduff P, Lopez PE, Jones TW et al Both dietary protein and fat increase postprandial glucose excursions in children with type 1 diabetes, and the effect is additive. Diabetes Care 2013; 36: 3897–3902. [DOI] [PMC free article] [PubMed] [Google Scholar]
- 12. Pańkowska E, Szypowska A, Lipka M, Szpotańska M, Błazik M, Groele L. Application of novel dual wave meal bolus and its impact on glycated hemoglobin A1c level in children with type 1 diabetes. Pediatr Diabetes 2009; 10: 298–303. [DOI] [PubMed] [Google Scholar]
- 13. Kordonouri O, Hartmann R, Remus K, Bläsig S, Sadeghian E, Danne T. Benefit of supplementary fat plus protein counting as compared with conventional carbohydrate counting for insulin bolus calculation in children with pump therapy. Pediatr Diabetes 2012; 13: 540–544. [DOI] [PubMed] [Google Scholar]
- 14. World Health Organization . Obesity: preventing and managing the global epidemic. Report of a WHO consultation. World Health Organ Tech Rep Ser 2000; 894: i–xii, 1–253. [PubMed] [Google Scholar]
- 15. Cole TJ, Bellizzi MC, Flegal KM, Dietz WH. Establishing a standard definition for child overweight and obesity worldwide: international survey. BMJ 2000; 320: 1240–1243. [DOI] [PMC free article] [PubMed] [Google Scholar]
- 16. Trip Advisor . Best steakhouses in London 2013. Available at www.tripadvisor.com Last accessed 3 July 2013.
- 17. Calorie King Australia . Calories in rump steak 2015. Available at http://www.calorieking.com.au/foods/search.php?keywords=rump+steak&partner=&showresults=yes Last accessed 3 July 2015.
- 18. Smart CE, King B, McElduff P, Collins C. In children using intensive insulin therapy, a 20 g variation in carbohydrate amount significantly impacts on postprandial glycemia. Diabet Med 2012; 29: e21–e24. [DOI] [PubMed] [Google Scholar]
- 19. Janney NW, Blatherwick NR. The metabolic relationship to glucose. J Biol Chem 1915; 20: 321–350. [Google Scholar]
- 20. Khan MA, Gannon MC, Nuttall FQ. Glucose appearance rate following protein ingestion in normal subjects. J Am Coll Nutr 1992; 11: 701–706. [DOI] [PubMed] [Google Scholar]
- 21. Lee SW, Cao M, Sajid S, Hayes M, Choi L, Rother C et al The dual‐wave bolus feature in continuous subcutaneous insulin infusion pumps controls prolonged post‐prandial hyperglycaemia better than standard bolus in Type 1 diabetes. Diabetes Nutr Metab 2004; 17: 211–216. [PubMed] [Google Scholar]
- 22. Chase HP, Saib SZ, MacKenzie T, Hansen MM, Garg SK. Post‐prandial glucose excursions following four methods of bolus insulin administration in subjects with Type 1 diabetes. Diabet Med 2002; 19: 317–321. [DOI] [PubMed] [Google Scholar]
- 23. O'Connell MA, Gilbertson HR, Donath SM, Cameron FJ. Optimizing postprandial glycemia in pediatric patients with type 1 diabetes using insulin pump therapy: impact of glycemic index and prandial bolus type. Diabetes Care 2008; 31: 1491–1495. [DOI] [PMC free article] [PubMed] [Google Scholar]
- 24. Kalergis M, Schiffrin A, Gougeon R, Jones PJH, Yale J‐F. Impact of bedtime snack composition on prevention of nocturnal hypoglycemia in adults with Type 1 diabetes undergoing intensive insulin management using lispro insulin before meals: a randomized, placebo‐controlled, crossover trial. Diabetes Care 2003; 26: 9–15. [DOI] [PubMed] [Google Scholar]
- 25. Uthoff H, Lehmann R, Sprenger M, Wiesli P. Skipping meals or carbohydrate‐free meals in order to determine basal insulin requirements in subjects with type 1 diabetes mellitus? Exp Clin Endocrinol Diabetes 2010; 118: 325–327. [DOI] [PubMed] [Google Scholar]
- 26. Unger RH, Orci L. Physiology and pathophysiology of glucagon. Physiol Rev 1976; 56: 778–826. [DOI] [PubMed] [Google Scholar]
- 27. Gannon MC, Nuttall FQ, Lane JT, Burmeister LA. Metabolic response to cottage cheese or egg white protein, with or without glucose, in type II diabetic subjects. Metabolism 1992; 41: 1137–1145. [DOI] [PubMed] [Google Scholar]