

Abstract
We investigated the normal mode composition and the aqueous solvation dependence of the primary amide vibrations of propanamide. Infrared, normal Raman, and UV resonance Raman (UVRR) spectroscopy were applied in conjunction with density functional theory (DFT) to assign the vibrations of crystalline propanamide. We examined the aqueous solvation dependence of the primary amide UVRR bands by measuring spectra in different acetonitrile/water mixtures. As previously observed in the UVRR spectra of N-methylacetamide, all of the resonance enhanced primary amide bands, except for the Amide I (AmI), show increased UVRR cross sections as the solvent becomes water-rich. These spectral trends are rationalized by a model wherein the hydrogen bonding and the high dielectric constant of water stabilizes the ground state dipolar −O—C=NH2+ resonance structure over the neutral O=C—NH2 resonance structure. Thus, vibrations with large C—N stretching show increased UVRR cross sections because the C—N displacement between the electronic ground and excited state increases along the C—N bond. In contrast, vibrations dominated by C=O stretching, such as the AmI, show a decreased displacement between the electronic ground and excited state, which result in a decreased UVRR cross section upon aqueous solvation. The UVRR primary amide vibrations can be used as sensitive spectroscopic markers to study the local dielectric constant and hydrogen bonding environments of the primary amide side chains of glutamine (Gln) and asparagine (Asn).
Graphical Abstract
INTRODUCTION
The primary amide functional group is of significant biological interest since it is found in the side chains of Gln and Asn. These side chains may be of structural and functional significance to peptides and proteins since they can participate in both intra- and intermolecular hydrogen bonding, which may be important to the formation and stabilization of prion and amyloid-like fibril aggregates that are involved in a number of protein diseases.1–5 Given the importance of these primary amide groups, it is of great value to find spectroscopic markers that can be used to monitor the Asn and Gln hydrogen bonding and dielectric environments.
UV resonance Raman (UVRR) spectroscopy is a powerful tool for studying the conformations of proteins,6 as well as for determining hydrogen bonding, protonation states, and local dielectric environments of aromatic amino acids,7 arginine,8 and histidine9,10 side chains. Deep UV excitation (~200 nm) selectively enhances the peptide bond secondary amide vibrations of the protein backbone6 and the primary amide vibrations of the Asn and Gln side chains.11 Investigations of the secondary amide vibrations12–18 have developed a deep understanding of the spectral dependence of the peptide bond secondary structure and its hydrogen bonding. This understanding has enabled incisive investigations of protein and peptide structure. The work presented here is developing a similar deep understanding of the structural, hydrogen bonding, and dielectric environmental dependence of primary amide vibrations.
We investigated propanamide, one of the simplest primary amide compounds with a structure similar to that of the Asn and Gln side chains. We assigned the vibrations observed in the infrared, non-resonance Raman, and UVRR spectra of crystalline propanamide with the aid of density functional theory (DFT). We then examined the solution behavior of the primary amide UVRR bands in mixtures of acetonitrile and water. The primary amide bands are very sensitive to their hydrogen bonding and dielectric environments. These bands will be useful as spectroscopic probes to monitor the side chain environment and structure of Gln and Asn.
MATERIALS AND METHODS
Materials
Propanamide (CH3CH2CONH2, 97% purity) and acetonitrile (HPLC, far-UV grade) were purchased from Acros Organics. N-Methylacetamide (CH3CH2CONHCH3, NMA, ≥99% purity) and sodium perchlorate (NaClO4, ≥98% purity) were purchased from Sigma-Aldrich. D2O (99.9% atom D purity) was purchased from Cambridge Isotope Laboratories, Inc.
Sample Preparation
The propanamide solid samples consisted of a crystalline powder, which was used without further purification or recrystallization. N-deuterated propanamide crystals were prepared by multiple recrystallizations in D2O. Propanamide solutions were prepared in H2O at 10 mM concentration. Samples prepared in mixtures of acetonitrile and water were prepared at 30 mM concentrations. For these experiments, NaClO4 (200 mM) was used as an internal standard. The N-deuterated propanamide solution was prepared at 30 mM concentration in pure D2O.
Infrared and Non-Resonance Raman Spectroscopy
The mid-infrared spectrum of propanamide crystals was measured in the 600–4000 cm−1 region at 1 cm−1 resolution. The data were collected using a PerkinElmer model Spectrum 100 series FTIR equipped with a Universal diamond ATR. The propanamide crystals were lightly ground for ~30 s using a mortar and pestle in order to ensure good optical contact between the sample and the diamond crystal. The sample was placed on the diamond crystal and a force of ~145 N was applied using a pressure arm.
The visible excitation Raman spectra of propanamide crystals were measured using a Renishaw inVia Raman spectrometer equipped with a research-grade Leica microscope. Spectra were collected using a 5× objective lens with a ~2 cm −1 resolution spectrometer. The 633 nm exciting line was generated by a HeNe laser. The 380 cm−1, 918 cm−1, 1376 cm−1, 2249 cm−1, and 2942 cm−1 bands of acetonitrile19 were used for calibration.
UV Resonance Raman (UVRR) Spectroscopy
The UVRR spectra of crystalline propanamide were measured using cw 229 nm light generated by an Innova 300C FreD frequency doubled Ar+ laser.20 Solid samples were spun by using a cylindrical brass rotation cell to prevent thermal degradation or photodegradation. A SPEX Triplemate spectrograph, modified for use in the UV, was utilized to disperse the Raman scattered light. A Spec-10 system charge-coupled device (CCD) camera (Princeton Instruments, Model 735-0001) was employed to detect the scattered light.
UVRR solution-state measurements were made using ~204 nm excitation. The UV light was generated by Raman shifting the third harmonic of a Nd:YAG Infinity laser (Coherent, Inc.) in H2 gas (~30 psi) and selecting the fifth anti-Stokes line. Solutions were circulated using a thermostated (20°C) flow cell21 to prevent accumulation of photodegradation products. The scattered light was dispersed and imaged using a double monochromator, modified for use in the UV in a subtractive configuration,22 and detected with a Spec-10 CCD camera.
UV Absorption Measurements
Absorption spectra were taken of 30 mM propanamide and 10 mM N-methylacetamide solutions dissolved in acetonitrile and water. A Varian Cary 5000 spectrophotometer with a 0.2 mm path length quartz cuvette was used for all measurements.
Raman Cross Section Calculations
The UVRR scattering cross sections of the spectrally deconvoluted propanamide Raman bands (see Supporting Information for details) were calculated using the following equation:11
| (1) |
where σi is the cross section of the ith propanamide Raman band, and σr is the cross section of the 932 cm−1 ClO4− stretching band from our internal standard. Cr and Ci are the concentrations of NaClO4 and propanamide, respectively. The factors kr and ki are the spectrometer efficiencies at the 932 cm−1 and ith propanamide Raman bands. Assuming only the analyte absorbs, the factors εi, εr, and εex are the molar absorptivities at the ith propanamide Raman band, the 932 cm−1 band, and the excitation wavelength, respectively. The expression in the parentheses corrects the cross section measurement for self-absorption.23,24 The Raman cross section of the 932 cm−1 reference band, σr, at 204 nm excitation, was estimated to be ~1.18 × 10⁻²⁷ cm 2· molecule −1· sr−1 by extrapolating the Raman cross section measurements of Dudik et al.25
DFT Calculations
The DFT calculations26 were performed using the GAUSSIAN 09 package27 with the M06-2X functional28 and the 6-311++g** basis set. The calculated frequencies of the propanamide vibrations were calculated using a harmonic approximation and scaled linearly to the average band frequencies observed experimentally. The calculations simulated solvation implicitly by placing the propanamide molecule in an ellipsoidal cavity surrounded by a polarizable continuum dielectric modeled to simulate water. The potential energy distribution (PED) of each vibration was obtained from the GAUSSIAN output files by employing the GAR2PED program.29
RESULTS AND DISCUSSION
Normal Mode Analysis
The infrared and Raman spectra of propanamide were reported previously.30–35 The most detailed normal mode analysis and assignments were carried out by Kuroda et al.34 and Nandini and Sathyanarayana.35 Kuroda et al.34 utilized semi-empirical calculations that employed modified Urey–Bradley and valence force fields, while Nandini and Sathyanarayana35 employed ab initio Hartree–Fock calculations. The band assignments significantly differ between these studies, particularly in regard to the amide vibrations. In the work here, we performed a new normal mode analysis for propanmide using more accurate DFT calculations, and use these results to assign our infrared, normal Raman, and UVRR spectral bands.
Propanamide Molecular Structure
We determined the crystal structure of our propanamide crystals (see Supporting Information for details), and found it to be close to the structure reported previously.36 The crystal unit cell is monoclinic (P21/c space group), with four molecules per unit cell (Figure S1). The measured crystallographic axes and angles are a = 8.851(4) Å, b = 5.750(2) Å, c = 9.766(3) Å, and β = 114.780(15)°.
We optimized the propanamide geometry (Figure 1) for the DFT calculations by taking the crystal structure as an initial starting point and determining the minimum energy geometry. As in the crystal, the calculated ground state equilibrium geometry of propanamide shows C1 symmetry since the NCCC dihedral angle deviates from 180°. Our results agree with the calculated structure of Nandini and Sathyanarayana.35 However, our calculated structure differs from that of Kuroda et al.,34 who assumed a Cs symmetry for propanamide, since its crystal structure had not been determined at that time. Propanamide has 30 fundamental vibrations, which, for a C1 point group are all both infrared and Raman active, and unlike in the Cs point group, there is no differentiation between in-plane (a′) and out-of-plane (a″) modes.
Figure 1.
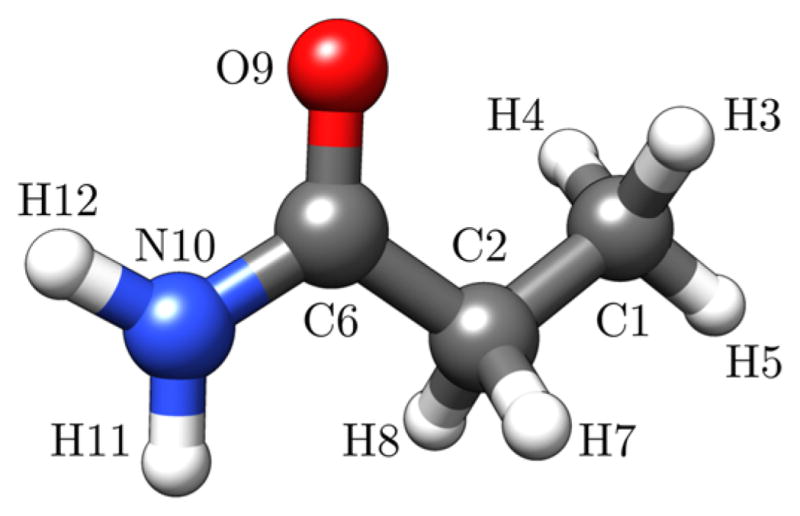
DFT-optimized structure of propanamide showing atomic numbering scheme used for normal mode analysis.
Tables S4–S6 enable comparisons between the structural parameters of the energy minimized structure used in our calculations and our measured crystal structure. The geometry and heavy atom bond lengths and angles of the minimized structure are close to the crystal structure, but not identical. This is most likely because the polarizable continuum model (PCM) employed in our calculations does not take into account crystal packing forces and hydrogen bonding.
Vibrational Band Assignments
Figure 2 shows the infrared, visible Raman, and UVRR spectra of CH3CH2CONH2 and CH3CH2COND2. Table 1 compares the frequencies and relative intensities of the infrared and non-resonance Raman spectra. We utilized UVRR to help identify the primary amide Raman bands. The primary amide NV1 electronic transition absorption band at ~180 nm resonance enhances the 204 nm excited UVRR spectra and pre-resonance enhances the 229 nm excited UVRR spectra. We expect that most resonance enhanced bands will consist of vibrations with large contributions of C–N stretching, since the excited state is expected to be expanded along this coordinate.37 Tables 2 and 3 list the vibrational assignments, calculated, scaled frequencies, and PEDs for CH3CH2CONH2 and CH3CH2COND2, respectively.
Figure 2.

(a,b) Infrared, (c,d) non-resonance Raman (633 nm excitation), and (e,f) UVRR (229 nm excitation) spectra of crystalline CH3CH2CONH2 and CH3CH2COND2.
Table 1.
Infrared and Non-Resonance Raman Frequencies (cm−1) of Crystalline CH3CH2CONH2 and CH3CH2COND2
| CH3CH2CONH2a
|
CH3CH2COND2a,b
|
||
|---|---|---|---|
| Infrared | Raman | Infrared | Raman |
| 3356 vs, br | 3356 s, br | ||
| 3309 sh | |||
| 3265 sh | |||
| 3177 vs, br | 3171 s, br | ||
| 2979 s | 2975 s | 2981 m | 2977 s |
| 2943 m | 2940 vs | 2943 w | 2941 vs |
| 2922 w | 2909 s | 2923 sh | 2912 s |
| 2882 w | 2882 sh | 2884 vw | 2886 sh |
| 2811 m | 2827 vw | 2833 sh | |
| 2737 sh | 2734 m | 2734 w | |
| 2527 s | 2523 s | ||
| 2407 s, br | 2393 s, br | ||
| 1643 sh, vs | 1676 vw | 1623 vs | 1610 s |
| 1628 vs | 1588 m | ||
| 1464 m | 1464 s | 1466 m | 1464 m |
| 1450 s | 1450 sh | ||
| 1434 s | |||
| 1418 vs | 1420 s | 1425 s | 1422 sh |
| 1379 w | 1381 w | 1379 w | 1378 sh |
| 1294 s | 1302 w | 1318 w | 1317 vw |
| 1260 s | 1261 m | ||
| 1168 vw | 1176 w | ||
| 1141 s | 1148 s | ||
| 1068 m | 1070 m | 1079 m | 1079 s |
| 1007 w | 1009 m | 1007 w | 1006 sh |
| 989 sh | 992 m | ||
| 940 m | 942 s | ||
| 822 m | 822 s | 819 sh | |
| 811 sh | 812 sh | 807 m | 806 m |
| 770 s | |||
| 731 sh | |||
| 648 s, br | 632 sh, br | ||
| 563 w, br | 549 w, br | ||
| 471 s | 441 m | ||
| 287 vw | 274 w, br | ||
| 210 vw | |||
vs: very strong; s: strong; m: medium; w: weak; vw: very weak; br: broad; sh: shoulder.
Bands that derive from the monodeuterated amide group are not reported.
Table 2.
Frequencies (cm−1) and Assignments of Infrared and Raman Bands for Crystalline CH3CH2CONH2
| Infrared | Raman | Calcd | δa (%) | PEDb (≥5% contribution) | |
|---|---|---|---|---|---|
| ν1 | 3356 | 3356 | 3434 | 2.3 | νNH (57), –νNH (43) |
| ν2 | 3177 | 3171 | 3319 | 4.6 | νNH (57), νNH (43) |
| ν3 | 2979 | 2975 | 2906 | 2.4 | νC1H (69), –νC1H (22) |
| ν4 | 2979 | 2975 | 2894 | 2.8 | νC1H (49), –νC1H (45) |
| 2ν10 | 2943 | 2940 | – | – | |
| ν5 | 2922 | 2909 | 2866 | 1.7 | νC2H (75), –νC2H (19) |
| ν6 | 2882 | 2882 | 2830 | 1.8 | νC1H (42), νC1H (32), νC2H (23) |
| ν7 | 2811 | 2827 | 2825 | 0.2 | νC2H (76), νC2H (20) |
| 2ν14 | 2737 | 2734 | – | – | |
| ν8 | 1643 | 1676 | 1667 | 0.5 | νC=O (75), –νCN (7), δsNC(O)C (7) |
| ν9 | 1628 | 1588 | 1562 | 2.9 | σNH2 (86), νCN (10) |
| ν10 | 1464 | 1464 | 1453 | 0.7 | δas′CH3 (43), –δasCH3 (38), ρ′CH3 (8) |
| ν11 | – | 1450 | 1443 | 0.5 | δasCH3 (51), δas′CH3 (39), –ρ′CH3 (8) |
| ν12 | – | 1430c | 1393 | 2.6 | ωCH2 (30), νC2C6 (20), –νCN (19), –βC=O (10), –νC1C2 (7), δas′CH3 (6) |
| ν13 | 1418 | 1420 | 1422 | 0.2 | σCH2 (89) |
| ν14 | 1379 | 1381 | 1374 | 0.4 | δsCH3 (89), νC1C2 (6) |
| ν15 | 1294 | 1302 | 1278 | 1.6 | ωCH2 (31), νCN (28), –τCH2 (12), βC=O (8), ρNH2 (5) |
| ν16 | – | 1260 | 1271 | 0.9 | τCH2 (61), ωCH2 (13), –ρ′CH3 (7), –ρCH2 (6) |
| ν17 | 1141 | 1148 | 1130 | 1.3 | ρNH2 (30), –νC1C2 (19), ρ′CH3 (11), –ρCH3 (10), –νC=O (8), δsNC(O)C (7), δCCC (7) |
| ν18 | 1068 | 1070 | 1108 | 3.6 | ρCH2 (27), –ρCH3 (21), –τCH2 (17), –ρ′CH3 (16), –ΠC=O (11) |
| ν19 | 1068 | 1070 | 1090 | 1.9 | νC1C2 (38), ρNH2 (26), –νCN (16), ρCH3 (6) |
| ν20 | 1007 | 1009 | 1028 | 2.0 | ρ′CH3 (28), ωCH2 (19), νC1C2 (18), –ρCH3 (11), –νC2C6 (9), –ρCH2 (8) |
| ν21 | 822 | 822 | 853 | 3.8 | ρCH2 (23), ρ′CH3 (18), –ΠC=O (18), ρCH3 (15), τCH2 (10), νC2C6 (8) |
| ν22 | 811 | 812 | 850 | 4.7 | νC2C6 (43), –ρCH3 (14), ρNH2 (11), –ρCH2 (7), νC1C2 (6) |
δ = |νobs – νcalc|/νobs × 100%.
ν: stretch; δs: sym deformation; σ: scissoring; δas: asym deformation; ρ: rocking; ω: wagging; β: in-plane bending; τ: twisting; Π: out-of-plane bending.
Frequency obtained from 229 nm excitation UVRR data.
Table 3.
Frequencies (cm−1) and Assignments of Infrared and Raman Bands for Crystalline CH3CH2COND2
| Infrared | Raman | Calcd | δa (%) | PEDb (≥5% contribution) | |
|---|---|---|---|---|---|
| ν1 | 2981 | 2977 | 2941 | 1.3 | νC1H (69), –νC1H (22) |
| ν2 | 2981 | 2977 | 2929 | 1.7 | νC1H (49), –νC1H (45) |
| 2ν10 | 2943 | 2941 | – | – | – |
| ν3 | 2923 | 2912 | 2900 | 0.6 | νC2H (75), –νC2H (19) |
| ν4 | 2884 | 2886 | 2863 | 0.8 | νC1H (42), νC1H (32), νC1H (23) |
| ν5 | – | 2833 | 2858 | 0.9 | νC2H (76), νC2H (20) |
| 2ν13 | – | 2734 | – | – | – |
| ν6 | 2527 | 2523 | 2607 | 3.3 | νND (54), –νND (45) |
| ν7 | 2407 | 2393 | 2458 | 2.4 | νND (54), νND (45) |
| ν8 | 1623 | 1610 | 1662 | 2.8 | νC=O (78), δsNC(O)C (7), –νCN (7) |
| ν9 | 1466 | 1464 | 1447 | 1.2 | δas′CH3 (42), –δasCH3 (37), ρ′CH3 (8) |
| ν10 | – | 1450 | 1437 | 0.9 | δasCH3 (52), δas′CH3 (38), –ρCH3 (8) |
| ν11 | – | 1434c | 1401 | 2.3 | νCN (33), –ωCH2 (19), –νC2C6 (19), βC=O (10), –δas′CH3 (6), δsND2 (5) |
| ν12 | 1425 | 1422 | 1415 | 0.6 | σCH2 (89) |
| ν13 | 1379 | 1378 | 1367 | 0.8 | δsCH3 (89), νC1C2 (8) |
| ν14 | 1318 | 1317 | 1295 | 1.7 | ωCH2 (45), νCN (23), δsND2 (15) |
| ν15 | – | 1261 | 1261 | 0.0 | τCH2 (75), –ρCH3 (9), –ρ′CH3 (5) |
| ν16 | 1168 | 1176 | 1134 | 3.2 | δsND2 (60), βC=O (12), νC2C6 (8), –ωCH2 (5) |
| ν17 | 1079 | 1079 | 1093 | 1.3 | νC1C2 (35), ρCH3 (19), –ρ′CH3 (11), –δCCC (7), –δsNC(O)C (5) |
| ν18 | 1079 | 1079 | 1091 | 1.1 | ρCH2 (25), –ρ′CH3 (19), ρCH3 (17), –τCH2 (16), –ΠC=O (11), νC1C2 (7) |
| ν19 | 1007 | 1006 | 1019 | 1.2 | νC1C2 (33), ρ′CH3 (20), ωCH2 (14), –νC2C6 str (9), –ρCH3 (6), δsND2 (5) |
| – | 989 | 992 | – | – | |
| ν20 | 940 | 942 | 936 | 0.5 | ρND2 (34), –νCN (15), –ρ′CH3 (11), δsNC(O)C (9), δsND2 (8), ρCH3 (6) |
| – | – | 819 | – | – | – |
| ν21 | 807 | 806 | 828 | 2.7 | ρCH2 (29), ρCH3 (24), –ΠC=O (19), ρ′CH3 (13), τCH2 (12) |
| ν22 | – | 770 | 776 | 0.7 | νC2C6 (51), ρND2 (25), –δCCC (7) |
δ = |νobs – νcalc|/νobs × 100%.
ν: stretch; δs: sym deformation; σ: scissoring; δas: asym deformation; ρ: rocking; ω: wagging; β: in-plane bending; τ: twisting; Π: out-of-plane bending.
Frequency obtained from 229 nm excitation UVRR data.
2000–3500 cm−1 Region
The high frequency region is dominated by N–H and C–H stretching bands. The N–H stretches show broad, strong peaks in both the infrared and Raman spectra that substantially downshift in frequency upon N-deuteration. The NH2 asymmetric stretching band is located at ~3355 cm−1, but downshifts to ~2525 cm−1 upon N-deuteration. The NH2 symmetric stretching band appears at ~3175 cm−1, while its ND2 counterpart appears at ~2400 cm−1. The ~3320 cm−1 feature observed in the CH3CH2COND2 spectra derives from an N–H stretching vibration for mono-N-deuterated propanamide.
The bands located between 2700 and 3100 cm−1 are insensitive to N-deuteration, which indicates that they are primarily C–H stretching modes. The ~2975 cm−1 and ~2880 cm−1 bands derive from CH3 asymmetric and symmetric stretching modes, respectively. The CH2 asymmetric stretching mode appears at ~2910 cm−1 in the Raman, and at ~2920 cm−1 in the infrared spectra. In contrast, the CH2 symmetric stretching band appears at ~2830 cm−1 and ~2810 cm−1 in the Raman and infrared spectra, respectively.
The bands at ~2735 cm−1 and ~2940 cm−1 cannot be assigned to fundamentals. Neither band shifts upon N-deuteration, and according to Kuroda et al.’s34 data, these bands also do not shift upon deuteration of the methlyene group. This indicates that they do not derive from overtone or combination of amide or methlyene bands. Therefore, we assign the ~2735 cm−1 band to the first overtone of the ~1380 cm−1 CH3 symmetric deformation vibration. The ~2940 cm−1 band is strong in both the non-resonance Raman and UVRR spectra, but is of only moderate intensity in the infrared. We assign this band to a Fermi resonance between the first overtone of the ~1460 cm−1 CH3 asymmetric deformation and the CH3 symmetric stretching fundamental based on the suggestions of Kuroda et al.34 and Nolin and Jones.38 This assignment disagrees with Nandini and Sathyanarayana,35 who attribute this band to a CH2 asymmetric stretching mode. We disagree with the Nandini and Sathyanarayana35 assignment since this band is upshifted beyond the typical frequency range (~2910–2930 cm−1) observed for CH2 asymmetric stretching vibrations.39,40
1500–1800 cm−1 Region
In this region there are two vibrations that involve the primary amide group, the Amide I (AmI) and Amide II (AmII) vibrations. The AmI at ~1640 cm−1 and the AmII at ~1620 cm−1 are strong and overlap in the infrared spectrum. In contrast, in the non-resonance Raman spectrum they are well-resolved, and show up as a moderately weak band located at ~1675 cm−1 (AmI) and a stronger band at ~1590 cm−1 (AmII). In the UVRR spectrum, the AmI band shows a ~1675 cm−1 peak followed by an overlapping ~1640 cm−1 feature. The AmII band is strong and occurs at ~1590 cm−1.
The large frequency differences between the infrared and Raman bands for the AmI and AmII vibrations presumably derive from the coupling of molecular vibrations within the crystal lattice into phonons. The spectral frequency differences for the infrared, normal Raman, and resonance Raman spectra derive from their differing selection rules for the different phonon modes with different phasings of relative molecular motion.
Kuroda et al.34 indicated that C=O stretching and NH2 scissoring motions are both important to the PEDs of the AmI and AmII vibrations. In contrast, Nandini and Sathyanarayana’s35 normal mode analysis, as well as other studies on acetamide,41–43 indicate that the AmI vibration is mainly C=O stretching and the AmII is mainly NH2 bending. Our analysis concludes that the AmI mode consists mostly of C=O stretching (~75%), with minor C—N stretching and NC(O)C in-plane bending (~7% each) components, while the AmII mode is essentially pure NH2 scissoring (~86%) with a small C—N stretching component (~10%).
The spectral changes that are observed upon N-deuteration are consistent with our normal mode analysis of the AmI and AmII bands. The AmII band completely disappears, and a new band, which derives from ND2 scissoring, appears at ~1170 cm−1, supporting the notion that this mode is essentially pure NH2 scissoring. In contrast, N-deuteration results in the AmI mode downshifting to ~1610 cm−1 in the non-resonance Raman and UVRR spectra, and to ~1620 cm−1 in the infrared spectrum. This behavior is similar to the AmI band in secondary amides, and strongly supports the idea that this mode is predominately C=O stretching.
1200–1500 cm−1 Region
Most bands in this region are easily assigned to CH3 or CH2 deformations and bending vibrations. The bands at ~1464 cm−1 and ~1450 cm−1 derive from CH3 asymmetric deformations, while the ~1380 cm−1 band is assigned to the CH3 symmetric deformation. In the non-resonance Raman and UVRR spectra, there is a weak band at ~1260 cm−1 that is assigned to a CH2 twisting mode.
C–N Stretching Modes
Our assignments of the remaining bands observed in the 1200–1500 cm−1 region differ from Kuroda et al.34 and Nandini and Sathyanarayana.35 Kuroda et al.34 previously assigned the ~1420 cm−1 band to two fundamentals, a CH2 scissoring mode and a C–N stretching mode. Nandini and Sathyanarayana35 also assigned this band to two fundamentals, viz., a CH2 bending mode and a CH3 symmetric bending vibration. Nandini and Sathyanarayana35 assigned a ~1300 cm−1 band to a vibration that consists of ~30% C–N stretching and CH2 wagging. They conflate this vibration with the C–N stretching mode that Kuroda et al.34 assigned to the ~1420 cm−1 band. In contrast, Kuroda et al.34 assigns the ~1300 cm−1 band to an almost pure CH2 wagging vibration.
Our normal mode analysis and UVRR data lead to very different assignments of these two vibrations. In the UVRR spectrum of CH3CH2CONH2, there is a very intense band at ~1430 cm−1, which we assign to the ν12 fundamental (Table 2) since it contains significant C–N stretching character. This band is not apparent in Kuroda et al.’s34 or our non-resonance Raman spectra of CH3CH2CONH2. The assignment of this resonance enhanced ~1430 cm−1 mode allows us to unambiguously assign the ~1420 cm−1 band to a CH2 scissoring vibration. The ~1300 cm−1 band, which appears weak in both the non-resonance Raman and UVRR spectra, is assigned to the ν15 vibration, which appears to be related to the ν12 mode.
Our normal mode analysis shows that the ν12 and ν15 amide vibrations contain significant C—N stretching. The largest ν12 PED components are CH2 wagging (~30%), C—CH2 stretching (~20%), C—N stretching (~19%), and C=O in-plane bending (~10%). For ν15, the major PED components are CH2 wagging and C—N stretching (~30% each), followed by CH2 twisting (~12%) and C=O in-plane bending (~8%).
1000–1200 cm−1 Region
In this spectral region, we expect NH2 rocking, CH2 rocking, CH3 rocking, and C–CH3 stretching vibrations. The ~1141 cm−1 infrared and ~1148 cm−1 Raman bands are easily assigned to the NH2 rocking vibration, since they downshift to ~940 cm−1 upon N-deuteration. The C–CH3 (ν19) stretching vibration was previously assigned,34 but our normal mode calculation suggests that this mode is more complicated and contains significant contributions of NH2 rocking (~26%) and C–N stretching (~16%). The infrared and Raman spectra show only two bands located at ~1070 cm−1 and ~1010 cm−1. We assign the ~1070 cm−1 band to both the CH2 rocking (ν18) and C– CH3 stretching (ν19) modes. In contrast, the ~1010 cm−1 band shows a negligible change in frequency upon N-deuteration, and is thus assigned to the CH3 rocking mode.
<1000 cm−1 Region
The region below 1000 cm−1 is dominated mainly by torsional motions, as well as extensively coupled skeletal stretching and deformation modes. This region is difficult to unambiguously assign, especially below 700 cm−1. We assign the two bands at ~820 and 810 cm−1 to CH2 rocking and C–CH3 stretching fundamentals, respectively. The C– CH3 stretching mode shows a modest contribution of NH2 rocking, which likely accounts for its ~42 cm−1 downshift to ~770 cm−1 upon N-deuteration.
Solvation Dependence of UVRR Bands
UVRR of Propanamide in Aqueous Solutions
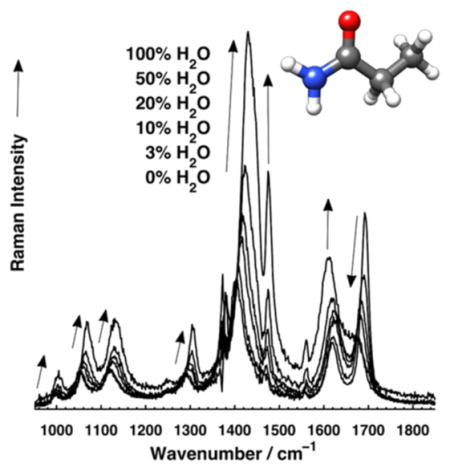
We measured the ~204 nm excited UVRR spectra of propanamide in mixtures of acetonitrile and water in order to determine the effects of solvation on the primary amide vibrations. The spectra of propanamide in aqueous solutions (Figure 3) differ from that of crystalline propanamide. Compared to crystalline spectra, propanamide in H2O (Table 4) shows an AmI (ν8) band that downshifts ~7 cm−1 and appears as a shoulder, while the AmII (ν9) band upshifts ~22 cm−1. The ν12 and C–CH3 stretching (ν19) bands do not change frequency, while the NH2 rocking (ν17) mode downshifts ~16 cm−1.
Figure 3.

UVRR (204 nm excitation) spectra of propanamide (a) in H2O and (b) in D2O. The contribution of solvent was subtracted from both spectra. For (a) 200 mM NaClO4 was used as an internal standard. The contribution of the ClO4− stretching band was also subtracted.
Table 4.
Measured Frequencies (cm−1) and Cross Sections (σ, mbarns · molecule−1· sr−1) of UVRR Bands in CH3CH2CONH2
| vibration | crystala
|
waterb
|
acetonitrilec
|
||
|---|---|---|---|---|---|
| Freq | Freq | σ | Freq | σ | |
| ν8 (AmI) | 1676 | 1669 ± 1 | 3.5 ± 0.70 | 1692 | 9.8 |
| ν9 (AmII) | 1588 | 1610 ±1 | 18± 1.1 | 1619 | 4.9 |
| ν12 | 1430 | 1428 ±1 | 30± 0.90 | 1403 | 9.1 |
| ν17 | 1148 | 1132 ± 1 | 8.8 ± 0.24 | 1121 | 3.0 |
| ν19 | 1070 | 1069 ± 1 | 6.0 ± 0.14 | 1051 | 2.3 |
UVRR cross sections were not calculated due to the lack of an internal standard.
Values measured from n = 4 sample size.
Values measured from n = 1 sample size.
The bands of propanamide in D2O (Figure 3b) also show significant changes compared to their N-deuterated crystal spectra. The AmI′ (ν8) band is broad and is located at ~1633 cm−1. The AmII band disappears, and the ND2 (ν16) scissoring band occurs at ~1168 cm−1, while the ν11 band is at ~1443 cm−1.
Effect of Solvation on UVRR Spectra
Figure 4 shows the dramatic effect of solvation on the UVRR bands of primary amides. The spectra show that all bands, except for the AmI, increase their Raman cross sections as the mole fraction of H2O increases (Table 4). The AmII and ν12 bands show the largest cross section increases (~3–4-fold), while the NH2 rocking (ν17) and the C–CH3 stretching (ν19) bands increase ~2–3- fold. The AmI band is the only band whose Raman cross section decreases as the mole fraction of H2O increases.
Figure 4.

UVRR (204 nm excitation) spectra of propanamide (30 mM) in different acetonitrile and water mixtures. Arrows show frequency and intensity trends of UVRR bands as the fraction of H2O increases. NaClO4 (0.2 M) was used as an internal intensity and calibration standard in the solutions. Spectra were normalized to the integrated area of the 932 cm−1 ClO4 − stretching band. The spectral contributions of acetonitrile, ClO4−, and water were subtracted. The asterisk indicates a spectral feature that is an artifact of subtracting out the ~1376 cm−1 acetonitrile band.
Figure 5 shows that there is a roughly linear cross section and frequency increase for most bands. The ν12 band shows a ~29 cm−1 per mole fraction H2O frequency increase, the NH2 rocking (ν17) band shows a ~14 cm−1 per mole fraction H2O frequency increase, while the C–CH3 stretching (ν19) vibration shows a ~19 cm−1 per mole fraction H2O frequency increase. In contrast, the AmI band shows a ~22 cm−1 per mole fraction H2O frequency decrease. The AmII band shows only a modest frequency decrease with increasing water mole fractions.
Figure 5.

Dependence of UVRR propanamide band (a) cross sections and (b) frequencies on the mole fraction of water.
The dependence of the UVRR spectra of propanamide on the mole fraction of water shown in Figure 4 is very similar to that observed in valeramide11 and NMA.44–48 To understand this behavior, we compared the UV absorption spectra of propanamide and NMA in acetonitrile and in H2O (Figure 6). The molar absorptivities of the ~200 nm NV1 transitions increase for both propanamide and NMA as the solvent transfers from acetonitrile to H2O. For NMA, the absorption peak maximum of the NV1 transition redshifts going from acetonitrile to water. This is less clearly evident in the case of propanamide where the NV1 absorption maximum lies deeper in the UV at ~180 nm. This trend is expected from the results of Nielsen and Schellman.49 They observe redshifts in the absorption maxima of several primary and secondary amides going from cyclohexane to water. This increase in molar absorptivity of the NV1 transition, upon aqueous solvation, is in part responsible for increasing the UVRR cross sections due to the fact that the Raman scattering cross section is proportional to the square of the molar absorptivity.
Figure 6.

UV absorption spectra of (a) NMA and (b) propanamide in acetonitrile and water. Arrows show trend of molar absorptivity as the fraction of water increases.
However, most of the cross section increase results from changes in the ground state structure. The effect of aqueous solvation on the UVRR secondary amide band intensities and frequencies has been traditionally rationalized by considering the effects of the solvent dielectric and direct hydrogen bonding on the amide group resonance structures.44–48 We can invoke a similar argument for primary amides.
In low dielectric constant and hydrogen bonding environments, the primary amide O=C—NH2 resonance form is typically dominant over the −O—C=NH2 + structure in the propanamide electronic ground state (Scheme 1). The dipolar resonance structure becomes more favorable in water due to the high dielectric constant and the stabilizing hydrogen bonding to propanamide’s C=O and NH2 groups. These two effects increase the C—N bond order and decrease the C—O bond order of the primary amide group in the electronic ground state.
Scheme 1.
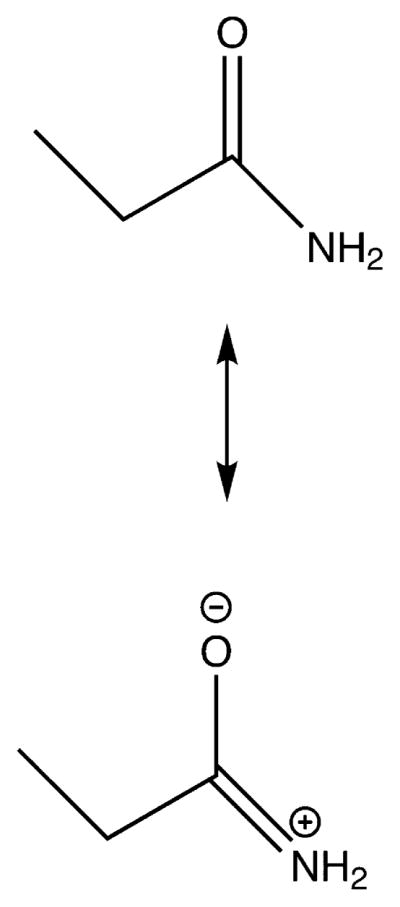
Resonance Structures of Propanamide
It is also important to note that the electronic excited state can also be impacted by solvation effects. For example, in NMA, Hudson and Markham47 argued that their ab initio post- Hartree–Fock calculations indicate that the effects of hydrogen bonding due to solvation are greater in magnitude on the π → π* electronic excited state equilibrium geometry than for the ground state geometry. They argue that the changes in the C=O and C—N bond lengths in the excited state due to solvation were also in the opposite direction of the excited state bond length changes of unsolvated NMA; i.e., the C—N bond length is larger and the C=O bond length is smaller in the excited state for a NMA(H2O)3 cluster compared to an isolated NMA molecule.
The changes in C—O and C—N bond orders (and bond lengths) of the amide group going from acetonitrile to water profoundly affect the resonance Raman cross sections and the band frequencies. This is because resonance Raman cross sections scale with the square of the displacement along the enhanced vibrational normal coordinate between the equilibrium geometries of the electronic ground and excited states.50 For example, the most resonance enhanced UVRR bands of NMA in water involve C—N stretching44–46,51,52 because of the large expansion of the electronic excited state along the C—N bond.47,48,52 In contrast, there is a relatively small enhancement of the AmI band for NMA in water because the excited state expansion along the C=O bond is much less.
In the case of propanamide, the dramatic spectral changes observed in Figure 4 can likewise be explained by changes in C=O and C—N bond lengths upon solvation. The elongation of the C=O bond results in a decrease of the C=O stretching force constant. This results in a downshift in the AmI band frequency. The AmI band UVRR cross section also decreases because the magnitude of the displacement between the electronic ground and excited states along the C—O coordinate must decrease in water since the ground state C=O bond length elongates.
In contrast, for vibrations with significant C—N stretching, the contraction of the C—N bond length results in a vibrational frequency upshift due to the increase in the stretching force constant. This bond contraction also increases the magnitude of the displacement between the electronic ground and excited states along the C—N coordinate, which results in an increase in the Raman cross sections. It will be more difficult to explain the origin of the UVRR cross section increases for heavily coupled modes, such as the ~1430 cm−1 ν12 and the ~1300 cm−1 ν15 modes, which contain displacements of multiple atoms. The displacements of all of the primary amide atoms contribute to resonance enhancement. Phasing of this motion can be very important.52 However, we conclude that the C—N stretching motion in these vibrations is predominantly responsible for their UVRR intensity enhancements.
CONCLUSION
We utilized DFT calculations, infrared, non-resonance Raman, and UVRR spectra to assign the vibrational bands of crystalline propanamide. Our study resolves previous inconsistencies in the vibrational assignments and normal mode compositions of primary amide bands. We also studied the effect of aqueous solvation on the primary amide UVRR bands by examining the ~204 nm UVRR dependence as the solvent transfers from acetonitrile to water. The aqueous solvation dependence of primary amide UVRR bands can be rationalized by the stabilization between dipolar resonance structures of the ground electronic state of the amide group. Both hydrogen bonding interactions and the increased dielectric constant as the solvent transfers from acetonitrile to water contribute to the stabilization of the dipolar resonance structure in the ground state, which effectively increases the C–N bond order while decreasing the C–O bond order.
The resulting increased displacement between electronic ground and excited state geometries along the C–N coordinate increases the UVRR cross sections of vibrations that contain significant C–N stretching. In contrast, the decreased displacement between the electronic ground and excited state geometries along the C–O coordinate results in a dramatic decrease in the AmI band UVRR cross section. These results indicate that the AmI, AmII, and ν12 band UVRR cross sections and their frequencies can be used as sensitive spectroscopic markers for hydrogen bonding and local dielectric environment of the side chains of Gln and Asn.
Acknowledgments
Funding for this work was provided by the University of Pittsburgh. E.M.D. gratefully acknowledges support through the NIH Molecular Biophysics and Structural Biology Training Grant (T32 GM88119-3). The computational work was supported by the University of Pittsburgh Center for Simulation and Modeling through the supercomputing resources provided.
Footnotes
Notes
The authors declare no competing financial interest.
Supporting Information
Tables S1–S6 and Figures S1–S3. Description of X-ray crystallographic methods to determine structure of propanamide and UVRR spectral deconvolution methods. This material is available free of charge via the Internet at http://pubs.acs.org/.
Supplementary Material
References
- 1.Perutz MF, Finch JT, Berriman J, Lesk A. Amyloid Fibers are Water-Filled Nanotubes. Proc Natl Acad Sci U S A. 2002;99:5591–5595. doi: 10.1073/pnas.042681399. [DOI] [PMC free article] [PubMed] [Google Scholar]
- 2.Schneider R, Schumacher MC, Mueller H, Nand D, Klaukien V, Heise H, Riedel D, Wolf G, Behrmann E, Raunser S. Structural Characterization of Polyglutamine Fibrils by Solid-State NMR Spectroscopy. J Mol Biol. 2011;412:121–136. doi: 10.1016/j.jmb.2011.06.045. [DOI] [PubMed] [Google Scholar]
- 3.Sikorski P, Atkins E. New Model for Crystalline Polyglutamine Assemblies and their Connection with Amyloid Fibrils. Biomacromolecules. 2005;6:425–432. doi: 10.1021/bm0494388. [DOI] [PubMed] [Google Scholar]
- 4.Natalello A, Frana AM, Relini A, Apicella A, Invernizzi G, Casari C, Gliozzi A, Doglia SM, Tortora P, Regonesi ME. A Major Role for Side-Chain Polyglutamine Hydrogen Bonding in Irreversible Ataxin-3 Aggregation. PLoS One. 2011;6:e18789. doi: 10.1371/journal.pone.0018789. [DOI] [PMC free article] [PubMed] [Google Scholar]
- 5.Wang X, Vitalis A, Wyczalkowski MA, Pappu RV. Characterizing the Conformational Ensemble of Monomeric Polyglutamine. Proteins. 2006;63:297–311. doi: 10.1002/prot.20761. [DOI] [PubMed] [Google Scholar]
- 6.Oladepo SA, Xiong K, Hong Z, Asher SA, Handen J, Lednev IK. UV Resonance Raman Investigations of Peptide and Protein Structure and Dynamics. Chem Rev. 2012;112:2604–2628. doi: 10.1021/cr200198a. [DOI] [PMC free article] [PubMed] [Google Scholar]
- 7.Chi Z, Asher SA. UV Raman Determination of the Environment and Solvent Exposure of Tyr and Trp Residues. J Phys Chem B. 1998;102:9595–9602. [Google Scholar]
- 8.Hong Z, Wert J, Asher SA. UV Resonance Raman and DFT Studies of Arginine Side Chains in Peptides: Insights into Arginine Hydration. J Phys Chem B. 2013;117:7145–7156. doi: 10.1021/jp404030u. [DOI] [PMC free article] [PubMed] [Google Scholar]
- 9.Caswell DS, Spiro TG. Ultraviolet Resonance Raman Spectroscopy of Imidazole, Histidine, and Cu(Imidazole)42+: Implications for Protein Studies. J Am Chem Soc. 1986;108:6470–6477. [Google Scholar]
- 10.Markham LM, Mayne LC, Hudson BS, Zgierski MZ. Resonance Raman Studies of Imidazole, Imidazolium, and their Derivatives: the Effect of Deuterium Substitution. J Phys Chem. 1993;97:10319–10325. [Google Scholar]
- 11.Xiong K, Punihaole D, Asher SA. UV Resonance Raman Spectroscopy Monitors Polyglutamine Backbone and Side Chain Hydrogen Bonding and Fibrillization. Biochemistry. 2012;51:5822–5830. doi: 10.1021/bi300551b. [DOI] [PMC free article] [PubMed] [Google Scholar]
- 12.Asher SA, Ianoul A, Mix G, Boyden MN, Karnoup A, Diem M, Schweitzer-Stenner R. Dihedral ψ Angle Dependence of the Amide III Vibration: a Uniquely Sensitive UV Resonance Raman Secondary Structural Probe. J Am Chem Soc. 2001;123:11775–11781. doi: 10.1021/ja0039738. [DOI] [PubMed] [Google Scholar]
- 13.Asher SA, Mikhonin AV, Bykov S. UV Raman Demonstrates that α-Helical Polyalanine Peptides Melt to Polyproline II Conformations. J Am Chem Soc. 2004;126:8433–8440. doi: 10.1021/ja049518j. [DOI] [PubMed] [Google Scholar]
- 14.Chen XG, Schweitzer-Stenner R, Asher SA, Mirkin NG, Krimm S. Vibrational Assignments of Trans-N-Methylacetamide and Some of Its Deuterated Isotopomers from Band Decomposition of IR, Visible, and Resonance Raman Spectra. J Phys Chem. 1995;99:3074–3083. [Google Scholar]
- 15.Mikhonin AV, Ahmed Z, Ianoul A, Asher SA. Assignments and Conformational Dependencies of the Amide III Peptide Backbone UV Resonance Raman Bands. J Phys Chem B. 2004;108:19020–19028. [Google Scholar]
- 16.Mikhonin AV, Asher SA. Uncoupled Peptide Bond Vibrations in α-Helical and Polyproline II Conformations of Polyalanine Peptides. J Phys Chem B. 2005;109:3047–3052. doi: 10.1021/jp0460442. [DOI] [PubMed] [Google Scholar]
- 17.Mikhonin AV, Bykov SV, Myshakina NS, Asher SA. Peptide Secondary Structure Folding Reaction Coordinate: Correlation Between UV Raman Amide III Frequency, Ψ Ramachandran Angle, and Hydrogen Bonding. J Phys Chem B. 2006;110:1928–1943. doi: 10.1021/jp054593h. [DOI] [PubMed] [Google Scholar]
- 18.Mikhonin AV, Asher SA. Direct UV Raman Monitoring of 310-Helix and π-Bulge Premelting During α-Helix Unfolding. J Am Chem Soc. 2006;128:13789–13795. doi: 10.1021/ja062269+. [DOI] [PubMed] [Google Scholar]
- 19.Shimanouchi T. Tables of Molecular Vibrational Frequencies Consolidated Vol. I National Bureau of Standards. National Bureau of Standards; 1972. [Google Scholar]
- 20.Asher SA, Bormett RW, Chen XG, Lemmon DH, Cho N, Peterson P, Arrigoni M, Spinelli L, Cannon J. UV Resonance Raman Spectroscopy Using a New cw Laser Source: Convenience and Experimental Simplicity. Appl Spectrosc. 1993;47:628–633. [Google Scholar]
- 21.Lednev IK, Karnoup AS, Sparrow MC, Asher SA. α-Helix Peptide Folding and Unfolding Activation Barriers: A Nanosecond UV Resonance Raman Study. J Am Chem Soc. 1999;121:8074–8086. [Google Scholar]
- 22.Bykov S, Lednev I, Ianoul A, Mikhonin A, Munro C, Asher SA. Steady-State and Transient Ultraviolet Resonance Raman Spectrometer for the 193–270 nm Spectral Region. Appl Spectrosc. 2005;59:1541–1552. doi: 10.1366/000370205775142511. [DOI] [PubMed] [Google Scholar]
- 23.Shriver DF, Dunn JBR. The Backscattering Geometry for Raman Spectroscopy of Colored Materials. Appl Spectrosc. 1974;28:319–323. [Google Scholar]
- 24.Ludwig M, Asher SA. Self-Absorption in Resonance Raman and Rayleigh Scattering: A Numerical Solution. Appl Spectrosc. 1988;42:1458–1466. [Google Scholar]
- 25.Dudik JM, Johnson CR, Asher SA. Wavelength Dependence of the Preresonance Raman Cross Sections of CH3CN, , and J Chem Phys. 1985;82:1732–1740. [Google Scholar]
- 26.Kohn W, Sham LJ. Self-Consistent Equations Including Exchange and Correlation Effects. Phys Rev. 1965;140:A1133–A1138. [Google Scholar]
- 27.Frisch MJ, Trucks GW, Schlegel HB, Scuseria GE, Robb MA, Cheeseman JR, Scalmani G, Barone V, Mennucci B, Petersson GA. Gaussian09, revision D.01. Gaussian Inc; Wallingford, CT: 2009. [Google Scholar]
- 28.Zhao Y, Truhlar D. The M06 Suite of Density Functionals for Main Group Thermochemistry, Thermochemical Kinetics, Noncovalent Interactions, Excited States, and Transition Elements: Two New Functionals and Systematic Testing of Four M06-class Functionals and 12 Other Functionals. Theor Chem Acc. 2008;120:215–241. [Google Scholar]
- 29.Martin J, van Alsenoy C. GAR2PED:A Program to Obtain a Potential Energy Distribution from a Gaussian Archive Record. University of Antwerp; Antwerp, Belgium: 2009. [Google Scholar]
- 30.Kohlrausch KWF, Pongratz A. Raman-Effekt und Konstitutions-Probleme, V. Mitteil.: Keto-Enol-Tautomerie in β-Ketosaeure-estern. Ber Dtsch Chem Ges. 1934;67:976–989. [Google Scholar]
- 31.Ananthakrishnan R. The Raman Spectra of Crystal Powders IV. Some Organic and Inorganic Compounds. Proc Indian Acad Sci Sect A. 1937;5:200–221. [Google Scholar]
- 32.Katon JE, Feairheller WR, Pustinger JV. Infrared Spectra-Structure Correlations of Aliphatic Amides in the 700-to 250-cm−1 Region. Anal Chem. 1964;36:2126–2130. [Google Scholar]
- 33.Machida K, Kojima S, Uno T. Infrared Spectra of Finite Chain Molecules-III: N-Fatty Acid Amides. Spectrochim Acta, Part A. 1972;28:235–256. [Google Scholar]
- 34.Kuroda Y, Saito Y, Machida K, Uno T. Vibrational Spectra of Propionamide and Its C-and N-Deuterated Compounds. Bull Chem Soc Jpn. 1972;45:2371–2383. [Google Scholar]
- 35.Nandini G, Sathyanarayana D. Ab Initio Studies on Molecular Conformation and Vibrational Spectra of Propionamide. J Mol Struct: THEOCHEM. 2002;586:125–135. doi: 10.1016/j.saa.2003.07.008. [DOI] [PubMed] [Google Scholar]
- 36.Usanmaz A, Adler G. Structure of Propionamide at 123 K. Acta Crystallogr Sect B. 1982;38:660–662. [Google Scholar]
- 37.Clark LB. Polarization Assignments in the Vacuum UV Spectra of the Primary Amide, Carboxyl, and Peptide Groups. J Am Chem Soc. 1995;117:7974–7986. [Google Scholar]
- 38.Nolin B, Jones RN. The Infrared Absorption Spectra of Diethyl Ketone and its Deuterium Substitution Products. J Am Chem Soc. 1953;75:5626–5628. [Google Scholar]
- 39.Bellamy LJ. The Infra-red Spectra of Complex Molecules. 3. Vol. 1. Chapman and Hall; London: 1975. [Google Scholar]
- 40.Schachtschneider J, Snyder R. Vibrational Analysis of the N-paraffins-II: Normal Co-ordinate Calculations. Spectrochim Acta. 1963;19:117–168. [Google Scholar]
- 41.Suzuki I. Infrared Spectra and Normal Vibrations of Acetamide and its Deuterated Analogues. Bull Chem Soc Jpn. 1962;35:1279–1286. [Google Scholar]
- 42.Sugawara Y, Hirakawa AY, Tsuboi M, Kato S, Morokuma K. Ab Initio S.C.F. MO Study on the Force Field of Amides. J Mol Spectrosc. 1986;115:21–33. [Google Scholar]
- 43.Hase Y. Theoretical Study of the Force Field and Vibrational Assignments of Acetamide and Deuterated Analogues. Spectrochim Acta, Part A. 1995;51:2561–2573. doi: 10.1016/s1386-1425(99)00201-2. [DOI] [PubMed] [Google Scholar]
- 44.Mayne LC, Hudson B. Resonance Raman Spectroscopy of N-methylacetamide: Overtones and Combinations of the C-N Stretch (Amide II’) and Effect of Solvation on the C=O Stretch (Amide I) Intensity. J Phys Chem. 1991;95:2962–2967. [Google Scholar]
- 45.Myshakina NS, Ahmed Z, Asher SA. Dependence of Amide Vibrations on Hydrogen Bonding. J Phys Chem B. 2008;112:11873–11877. doi: 10.1021/jp8057355. [DOI] [PMC free article] [PubMed] [Google Scholar]
- 46.Wang Y, Purrello R, Georgiou S, Spiro TG. UVRR Spectroscopy of the Peptide Bond. 2. Carbonyl H-Bond Effects on the Ground- and Excited-State Structures of N-methylacetamide. J Am Chem Soc. 1991;113:6368–6377. [Google Scholar]
- 47.Markham LM, Hudson BS. Ab Initio Analysis of the Effects of Aqueous Solvation on the Resonance Raman Intensities of N-Methylacetamide. J Phys Chem. 1996;100:2731–2737. [Google Scholar]
- 48.Hudson BS, Markham LM. Resonance Raman Spectroscopy as a Test of Ab Initio Methods for the Computation of Molecular Potential Energy Surfaces. J Raman Spectrosc. 1998;29:489–500. [Google Scholar]
- 49.Nielsen EB, Schellman JA. The Absorption Spectra of Simple Amides and Peptides. J Phys Chem. 1967;71:2297–2304. doi: 10.1021/j100866a051. [DOI] [PubMed] [Google Scholar]
- 50.Heller EJ, Sundberg R, Tannor D. Simple Aspects of Raman Scattering. J Phys Chem. 1982;86:1822–1833. [Google Scholar]
- 51.Asher SA, Chi Z, Li P. Resonance Raman Examination of the Two Lowest Amide ππ* Excited States. J Raman Spectrosc. 1998;29:927–931. [Google Scholar]
- 52.Chen XG, Asher SA, Schweitzer-Stenner R, Mirkin NG, Krimm S. UV Raman Determination of the ππ* Excited State Geometry of N-Methylacetamide: Vibrational Enhancement Pattern. J Am Chem Soc. 1995;117:2884–2895. [Google Scholar]
Associated Data
This section collects any data citations, data availability statements, or supplementary materials included in this article.