

Abstract
Aquaporins (AQPs) are a family of membrane proteins that function as channels facilitating water transport in response to osmotic gradients. These play critical roles in several normal physiological and pathological states and are targets for drug discovery. Selective inhibition of the AQP1 water channel may provide a new approach for the treatment of several disorders including ocular hypertension/glaucoma, congestive heart failure, brain swelling associated with a stroke, corneal and macular edema, pulmonary edema, and otic disorders such as hearing loss and vertigo. We developed a high-throughput assay to screen a library of compounds as potential AQP1 modulators by monitoring the fluorescence dequenching of entrapped calcein in a confluent layer of AQP1-overexpressing CHO cells that were exposed to a hypotonic shock. Promising candidates were tested in a Xenopus oocyte-swelling assay, which confirmed the identification of two lead classes of compounds belonging to aromatic sulfonamides and dihydrobenzofurans with IC50s in the low micromolar range. These selected compounds directly inhibited water transport in AQP1-enriched stripped erythrocyte ghosts and in proteoliposomes reconstituted with purified AQP1. Validation of these lead compounds, by the three independent assays, establishes a set of attractive AQP1 blockers for developing novel, small-molecule functional modulators of human AQP1.
Keywords: aquaporin, drug discovery, membrane transport, protein expression, water channel
The discovery of ‘aquaporins’ (AQPs), a large family of membrane protein channels that facilitate transport of water reviewed in refs. (1–24), has drawn attention to their role in several normal physiological and pathological states that involve rapid water transport. As water is so vital to all living cells and tissues, AQPs represent key targets for therapeutic intervention. At least thirteen AQPs, numbered 0 through 12, have been identified from various mammalian tissues. Homologous genes for AQPs in amphibians, insects, and bacteria highlight the evolutionary conservation and thus the importance of these water channels. AQP proteins are similar in size (256–281 amino acids) and possess six transmembrane α-helices and two half-helices one each in the N-terminal and C-terminal half of the protein. These N-terminal and C-terminal halves exhibit substantial sequence similarity to each other, but are oriented in opposite directions in the membrane elaborating in-plane pseudo twofold symmetry (25). In this manner, corresponding regions are found on opposite sides of the membrane and contain the Asp-Pro-Ala (NPA) sequence that is characteristic of the major intrinsic protein of the lens (MIP) family of proteins of which the AQPs are members. The first member of the aquaporin family, AQP1, was isolated from erythrocytes (26,27). MIP26 of the lens fiber cell membrane, which was identified before the discovery of AQP1, and initially thought to be a gap junction protein was shown to function as a water channel (28) and therefore renamed as AQP0. AQPs are broadly classified into those that transport exclusively water and those that have a broader specificity, for example in transporting glycerol and other small solutes.
With more than 5000 papers published in the field during the last 18 years, much is now known about the structure and function, tissue distribution, developmental expression, and regulation of AQPs (see refs. 7–9,13,14,17,29–31 for recent reviews). Results from AQP knockout mice experiments indicate that AQPs are important in mammalian physiology in two general situations: when water movement is driven across a barrier by a continuous osmotic gradient (as in the collecting duct of the kidney), and for active, near, iso-osmolar fluid absorption/secretion (as in the salivary gland or kidney proximal tubule). High-resolution three-dimensional crystal structures of AQP0, 1 and 4 are also available for biophysical studies (32–36). Arguably the best known inhibitors of many AQPs are sulphydryl-reactive compounds, which are non-specific cysteine-binding reagents. In the case of AQP1, compounds in this family such as HgCl2 and pCMBS (p-chloromercurylbenzene sulfonate) were shown to inhibit water permeability through binding to Cys189 residue that was reversed by reducing agents (37). Solutes which transport through other aquaporins have been shown to be inhibited by gold (38) and copper (39) compounds, which are all non-selective and uniformly toxic. In recent years, a number of potential aquaporin blockers including tetraethylammonium (TEA) (40), acetazolamide (41,42), with many turning out to be non-specific, for example, acetazolamide showing inhibitory effect to both AQP1 (43) and AQP4 (42) have been suggested. In addition, a series of arylsulfonamides (e.g. sumatriptan 1), anti-epileptic drugs (AEDS; e.g. topiramate) and their analogs were shown to be inhibitory toward AQP4 (44,45). Yool et al. (45) indicate AqB013, an arylsulfonamide as an antagonist for both AQP1 and AQP4 postulating a putative binding site for this compound proximal to the cytoplasmic vestibule. Results from other groups question the validity of most of the reported non-mercurial compounds. For example, a comprehensive study by Sogaard and Zeuthen (46) in Xenopus oocytes showed no inhibition of AQP1 water transport by TEA and acetazolamide contrary to the theoretical studies (47). Further, inhibitory effects of AEDS and other compounds on AQP4 could not be reproduced (33,48). In the case of AQP4, Mola et al. (49) have carried out a careful screening study of a library of compounds for AQP4 inhibition and found four top candidates. Also, more recently, Seeliger et al. (50) report identification of three small molecular mass compounds using virtual screening that showed inhibition of water permeability in Xenopus oocytes with ~8 to 18 μM IC50.
Two potentially useful approaches to identify pharmacologically active AQP modulators include structure-based drug design using computer modeling and high-throughput screening (HTS) of combinatorial drug libraries. The compounds identified by HTS may be useful in probing the AQP pore and sites of allosteric modulation; for studying animal physiology; and potentially for the development of treatments for human disorders such as brain swelling associated with the stroke, Sjogren’s syndrome, hypertension, pulmonary edema, glaucoma, and otic disorders such as hearing loss and vertigo. Here, using a novel high-throughput screening method, we report identification of several small-molecule AQP1 inhibitors that appear to be more potent than those reported in the literature to-date.
Methods and Materials
Transfection of the CHO-K1 cell line with human aqp1 gene
The plasmid construct with the human aqp1 gene was generated using the aqp1 coding sequence amplified from the I.M.A.G.E. consortium clone ID: CS0DA009YJ21 accession: AL518392 from Invitrogen (Invitrogen, Carlsbad, CA, USA). The full-length human aqp1 gene was amplified using appropriate primers and a Kozak sequence was inserted at the 5′ of the coding region and ligated into pcDNA3.1+ vector (Invitrogen). The sequences of selected clones were verified by restriction analysis, colony PCR, and sequence analysis. The aqp1 plasmid was used to transfect CHO-K1 cell lines (ATCC, Manassas, VA, USA) using Lipofectamine 2000 (Invitrogen) according to manufacturer’s recommendations. After 48 h, the transfected cells were selected by the addition of 2 mg/mL of Geneticin (Invitrogen). In parallel, a control-transfected cell line, the pcDNA3.1+ vector with no insert was transfected in CHO-K1 cells. Expression of AQP1 was confirmed by Western blot analysis of cell extracts prepared from stably transfected cell lines using an antibody directed against the AQP1 carboxyl-terminal tail (amino acid region 243–261) (Millipore, Temecula, CA, USA). From several evaluated clones, the CHO-AQP-1_9C8 clone was chosen for the screening assay; in addition, one CHO-pcDNA3.1+ (no insert) clone was selected as a background control.
Screening method using FlexStation II 384™ and FLIPR fluorescent kinetic readers
The detection of rapid osmotic changes of the overexpressing AQP1 cell line using the Calcein-AM fluorescent dye (Dojindo, Rockville, MD, USA) was used to characterize the cell line as well as to establish the screening assay for inhibitors of AQP1. For the development of the cell line, we used the FlexStation II 384™ microplate reader, and for the screening exercise, we use (FLIPR Tetra; Molecular Devices, Sunnyvale, CA, USA).
For the screening, CHO-AQP-1_9C8 cell line was seeded at 33 × 106 cells/T-150 cm2 flask density in staining medium (Dulbecco’s modified Eagle’s medium [DMEM] without pyruvate and L-glutamine containing 10% FBS from Invitrogen and 6 μM Calcein-AM) and incubated for approximately 30 min at room temperature (RT). Next, cells were harvested and seeded at 10 000 cells/well in 20 μL of assay media (DMEM without pyruvate and L-glutamine containing 10% FBS) into 384-well black clear bottom assay plates (Corning, Lowell, MA, USA) using the multidrop liquid dispenser (Thermo Fisher Labsystems, Waltham, MA, USA). Cells were incubated overnight at 37 °C and 5% CO2 tissue culture incubator. On the day of the assay, 80–90% confluent cell plates were washed with 50 μL PBS twice using a plate washer (ELx405 BioTek; Winooski, VT, USA) and centrifuged at 100 × g for 10 seconds. Twenty microliters per well of PBS buffer was added to each assay plate well and incubated at RT for 15 min. Then, 2.2 μL of compound samples at 9% v/v DMSO was dispensed into the assay plates with a Biomek FX (Beckman Coulter, Indianapolis, IN, USA) and incubated for an additional 10 min at RT. Assay plates were transferred to the FLIPR Tetra where the baseline fluorescence reading was registered and after about 18 seconds, 22 μL of DPBS without Ca2+ and Mg2+ (minimum response; Invitrogen) or H2O (maximum response) was added automatically to specified wells. The fluorescence in relative fluorescence units (RFU) was recorded at intervals of 0.5 seconds using an excitation filter (λex = 470–495 nm) and an emission filter (λem = 515–575 nm, cutoff 515 nm). Fluorescent readings were acquired using the SOFTMAX PRO software (Molecular Devices) and analyzed with Excel fit (Microsoft). A running average of five consecutive points enabled rapid assessment of the rise time in fluorescence yielding the rate V (RFU/second). The start point of the running average was the instance of dispensing plus the dispensing (dead time) and the mixing time (0.5 seconds). The extent of inhibition I in terms of a dynamic range may be defined by the following expression:
where Vm is the maximum RFU rate for AQP1-expressing cells subject to hypo-osmosis, Vi is the RFU rate for AQP1-expressing cells treated with a compound. Vo is the minimum RFU rate measured from AQP1-deficient cells subject to hypo-osmosis. Vm−Vo defines the functional dynamic range, and I is the percent inhibition. Compounds identified as hits, based on the above formula, were selected and retested for confirmation. To assess the overall quality of the high-throughput screen (HTS), the statistical parameter for examination of the HTS assay, the Z-factor (51) was evaluated. Briefly, Z relates to the equipment dynamic range, Vm−Vc, and the variation in RFU according to
where Vc is the control (AQP1-expressing cells) response, that is, the signal variation in RFU obtained by an isotonic shock. In our hands, Vc was indistinguishable at the level of measurement accuracy from Vo (Figure 1). The sigmas in the above formula are the standard deviation of Vm and Vc. The effective equivalence of Vc and Vo simplified the experimental set-up and approach in HTS.
Figure 1.
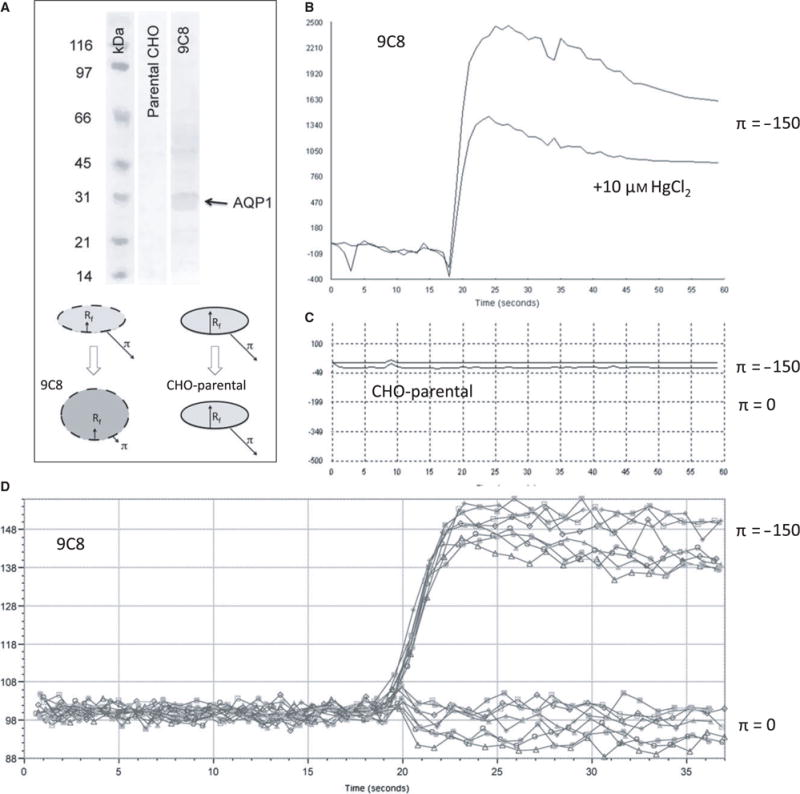
Simultaneous calcein dequenching of confluent AQP1-expressing CHO cells using a robotic plate reader: (A) Western blot of CHO-K1 cells and CHO-9C8 AQP1-expressing cells (top), using an anti-AQP1 antibody (a.a. 243–261) (Millipore, Temecula, CA, USA). The cartoon (bottom) indicates the swelling of AQP1 cells by osmotic shock, while cells without AQP1 channels do not swell notwithstanding the presence of the osmotic shock. (B) Characteristic fluorescence response showing a rapid rise in fluorescence as the result of dequenching of entrapped calcein. HgCl2 reduces the extent in signal with a small effect in the rise time. (C) CHO cells without AQP1 do not respond to an osmotic pressure. (D) Representative data from a 96-well experiment, showing responses of AQP1-expressing cells in the absence (bottom curves) and presence (top curves) of an osmotic gradient.
Xenopus oocyte assay to measure water permeability of human aqp1
The coding sequence of wild-type human aqp1 (WT-aqp1) was amplified by polymerase chain reaction using primers 5′ (atggccagcgagttcaagaag) and 3′ (ctatttgggcttcatctccac) (52,53). pcDNA 3.1 myc-His vector (Invitrogen) carrying a T7 promoter for Xenopus oocyte expression was used. In vitro cRNA transcription was performed using T7 RNA polymerase (mMESSAGE mMACHINE kit; Ambion®, ThermoFisher, WA, MA, USA). Purified cRNA was dissolved in distilled water and stored at −80 °C until injection into the oocytes. Oocytes in stage V and VI were injected with 25 ng of human aqp1 cRNA. Stock solutions of drug compounds were dissolved in 100% anhydrous dimethyl sulfoxide (DMSO; Sigma Aldrich, St Louis, MI, USA) and stored in −80 °C under darkness until use. Water permeability of Xenopus oocyte membrane was estimated as described in Varadaraj et al. (52,53). This permeability (Pf) was calculated from the initial change in volume using the equation: where V (cm3) is the oocyte volume calculated from the cross-sectional area, Sm (cm2) is the oocyte surface area calculated from the cross-sectional area, Vw is the molar volume of water (18 cm3/mol), and Δc is the change in bath osmolality (120 mOsm).
Assay to check for cytotoxicity
AQP1-expressing CHO cells were grown overnight on 96-well plates (15–20 000 cells/well). Cells were washed with PBS twice and then incubated with compounds in 100 μL of PBS at room temperature for 30 min. Cytotoxicity effect of compounds on the AQP1-CHO cells was determined using CytoTox-One kit from Promega. CytoTox-One reagent (100 μL) was added to each well and incubated at 22 °C for 10 min. Stop solution (50 μL) was added to each well and mixed by shaking the plate for 10 seconds. Fluorescence was measured using a Fluorocount Microplate Fluorometer (Packard Instrument Company, Meriden, CT, USA.) with an excitation wavelength of 540 nm and an emission wavelength of 590 nm. Maximum LDH release was calculated as the percent cytotoxicity for a given compound by comparing the LDH release to the maximum LDH release by known toxic compound.
Purification of native AQP1
Purification of native AQP1 was carried out using, at a time, one unit of outdated human red blood cells (RBC; NZ blood bank). The procedure adopted followed that described in van Hoek et al. (54) with some modifications. Following solubilization of AQP1-enriched membranes produced by stripping of the ghost membranes with 3% N-lauryl-sarcosine (NLS), the solubilized material (in 400 mM βOG) was loaded onto a Q-Sepharose ion exchange column (GE Healthcare Life Sciences, Milwaukee, WI, USA) washed with up to 150 mM NaCl and eluted at 250 mM NaCl in Tris buffer (Tris-HCl pH 8.0, ~50 mM NaCl, 0.1 mM EDTA, 40 mM βOG). Fractions containing AQP1 were pooled and treated with recombinant PNGaseF produced in-house, as described in Loo et al. (55), for generating deglycosylated AQP1. The amount of PNGaseF used varied from one-tenth to half of the amount of AQP1 present (estimated by absorbance at 280 nm), depending on enzyme activity. AQP1 was incubated with PNGaseF for 48 to 72 h at 18 °C. PNGaseF was removed by a second Q Sepharose chromatography run, as described above but using a smaller resin volume to enable concentration of purified AQP1. AQP1 was concentrated further using a CENTRICON with 50 kD molecular weight cutoff and loaded onto a Superdex S200 10/300 GL (GE Healthcare Life Sciences) size-exclusion column as a final purification step.
Preparation of AQP1 Proteoliposomes
AQP1 proteoliposomes were prepared using the synthetic lipid DOPC at a lipid to protein ratio of 10:1 (w:w). Solvent chloroform/ethanol (4:1) of DOPC stock was evaporated under N2, and residual traces of the solvent were removed using a SpeedVac at RT for 15–30 min. The lipid film was hydrated by suspending it in EDTA–phosphate buffer (Buffer C) containing 152 mM (4%) β-octyl-glucoside (βOG) by vortexing followed by a brief N2 purge and stirring on a wheel for 2–3 h, until clear. Typically, a cocktail for preparing proteoliposomes contained 27 μL of Buffer C (with 40 mM μOG), 5.5 μL of stock 1 M βOG, 50 μL of stock DOPC in buffer (20 mg/mL), and 23 μL of AQP1 (4.35 mg/mL) that was incubated on a wheel overnight at RT. Detergent was removed at RT by applying biobeads at 20 mg to the cocktail and incubating for 2 h, repeating as necessary or by dialysis using Spectra/Por dialysis membrane, at 28 °C for up to 10 days. SDS–PAGE of the reconstituted proteoliposome suspension SDS–PAGE was used to confirm the incorporation of AQP1 into proteoliposomes.
Stopped-flow assay
Osmotic water permeability was measured at 22–24 °C by monitoring 90° scattered light intensity at 520 nm wavelength. Measurements were made using a PiStar 180 (Applied Photophysics, UK), with a dead time of 1–2 milliseconds. Thirty minutes prior to the assay, stripped red blood cell ghosts or proteoliposomes containing purified AQP1 and stored in ice were treated with mercuric chloride (50–100 μM; positive control for inhibition) or with the various compounds usually at a concentration of 150 μM. Stock solutions of compounds were in 100% ethanol (for stripped erythrocyte membrane experiments) and in 100% DMSO (for proteoliposome experiments). An inwardly directed osmotic gradient (hyperosmotic shock) was created by mixing the vesicles maintained in Buffer A (50 mM sodium phosphate buffer pH, 100 mM NaCl, 1 mM EDTA, 0.025% sodium azide) with an equal volume of 200 mM mannitol. On the other hand, vesicles preincubated with 200 mM mannitol were mixed with Buffer A to create an outwardly directed osmotic gradient (hypo-osmotic shock). The change in right-angle scattering light intensity was measured for 1 or 2 seconds, as appropriate, and each measurement was repeated at least three times.
Results
Development of cell-based AQP1 assay
Stable human aqp1-transfected cells were developed using the CHO-K1 cell line. The overexpression of AQP1 from individual clones was analyzed by Western blot. Characterization of AQP1 expression in the various clones is shown in Figure S1. We found a prominent band corresponding to a molecular mass of ~28 kD (Figure 1A) in a clone-labeled AQP1-9C8. AQP1 function was measured in a confluent cell layer using the established calcein-quenching assay (56–59). We used 6 μM calcein-AM, and subsequent diffusion into the cells led to entrapped calcein in a quenched state. A plate reader performed the measurement of fluorescence as described in Methods and Materials. AQP1-9C8 gave a robust response to a hypo-osmotic challenge, leading to swelling (Figure 1A-bottom, cartoon), which was highly sensitive to mercuric chloride (Figure 1B), indicating that the expressed AQP1 was functional. To establish the dynamic range of the assay, we tested the swelling response in the AQP1-deficient parental CHO-K1 cell line (Figure 1C). Here, the hypo-osmotic (π =−150 mOsm) response did not show dequenching of entrapped calcein measured over the 60-second time– course (see Discussion). This difference in response between AQP1-9C8 and CHO-parental cells is substantial and is significant in a high-throughput setting (52), because it not only increases the functional dynamic range, but also the equipment dynamic range – Vo and Vc are effectively identical in our hands (see Methods and Materials and ref. 52). The absence of any dequenching of calcein-AM in the parental cell line following hypotonic shock (Figure 1C) can therefore be mimicked by an iso-osmotic experiment with the AQP1-9C8 cell line. Using 96-well and 384-well set-ups, continuous recording for individual wells before and after dispensing of a hypotonic (H2O) or isotonic (PBS) solution was carried out to screen the 9C8 confluent cultures. Example data are shown in Figure 1D. Figure 2 summarizes the data obtained for increasing concentrations of HgCl2 to up to 100 μM. In agreement with Figure 1B, increasing HgCl2 concentration decreased the extent of fluorescence significantly – in fact to the level of zero fluorescence observed with CHO cells not expressing AQP1 (cf. Figure 1C). The titration with HgCl2 was carried out in triplicate on 3 different days to assay for consistency in the generated data. The estimated mean IC50 value was calculated to be 7.53 μM (±0.60).
Figure 2.
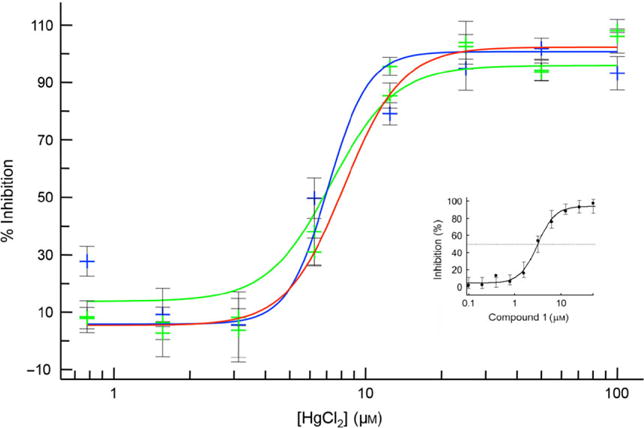
Dose-dependent inhibition of AQP1-expressing CHO cells by HgCl2: The Vi, Vc, and Vo-values from fluorescence traces (Figure 1) were transformed to percentage inhibition as described in Methods and Materials and fitted to a 4-parameter function against the HgCl2 concentration. Shown are three curves representing fits against data points obtained from three separate experiments. (Inset): Dose-dependent inhibition by compound 1 (see text).
Performance tests of HTS
Initially, the 96-well plate format for the Flex Station II 384™ was utilized to characterize the behavior of CHO and AQP1-expressing cells. The screening capacity was increased to a 384-well format using the FLIPR Tetra apparatus. The variability in the fluorescence response was minimal as observed by comparing results of assays on different days and also from plate to plate (Figure 3) with Z-values >0.5. The scaling up using the 384-well format (Figure 4), wherein smaller amounts of fluids were dispended in the form of cell suspensions and osmotic solutions, yielded Z-values >0.5. The Z-values between 0.5 and 1.0 are considered excellent in assays for high-throughput screening (52). These observations indicate that the 96- and 384-well plate formats are suitable for confluent cells that are subject to osmotic swelling.
Figure 3.
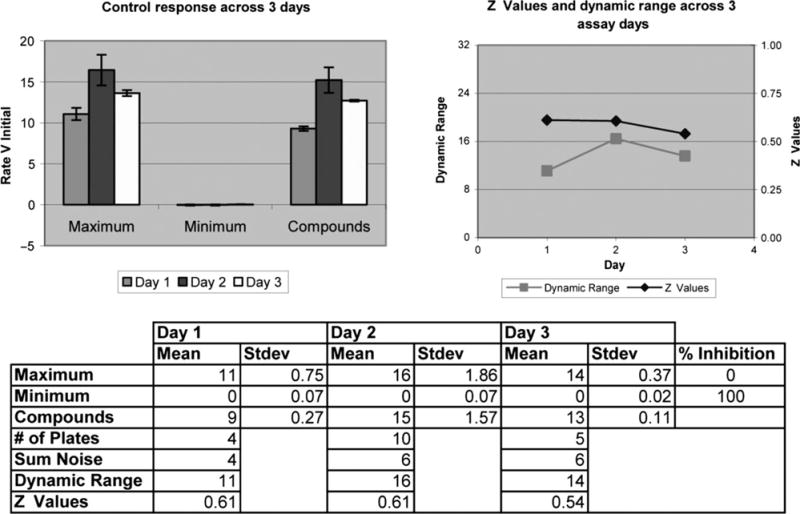
Examination of the performance of AQP1 assay on 3 different days: In order to establish the adequacy of the assay in HTS to determine the Z values. CHO-AQP1-9C8 confluent cells, in the presence or absence of a compound, were exposed to a hypotonic shock (maximum response) or isotonic shock (minimum response).
Figure 4.
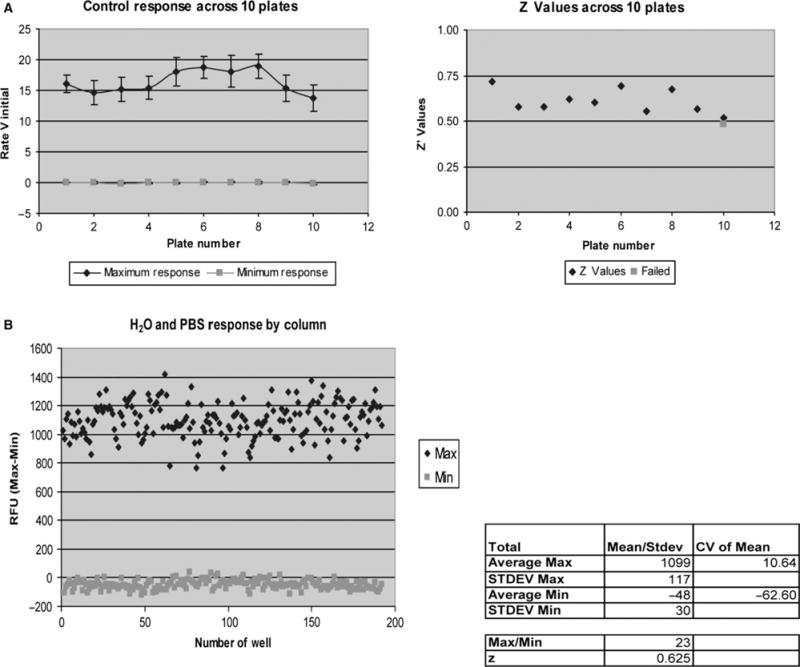
Performance of AQP1-functional assay in HTS: Reproducibility of the AQP1 assay was determined across 10 384-well format plates (A) and from well-to-well variations (B). Dynamic range was consistent across various plates as well as across various wells with Z values above 0.5.
Primary screening of compounds
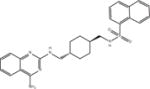
Approximately 6000 drug-like molecules from AlCON’s collection of compounds were selected for screening. We used structurally diverse small molecules that vary in terms of functional groups and charge. Compounds were tested individually by incubating with the cells for 10 min at a 50 μM final concentration. After the primary screening, 307 compounds were identified that inhibited water channel permeability of AQP1 by at least 30% and these compounds were retested for confirmation. From those, we identified 29 compounds showing >50% inhibition of water permeation when applied at a 50 μM concentration. Concentration–response inhibition studies were performed on all of these 29 compounds. Six of these compounds belonging to aromatic sulfonamide (ASQ) and dihydrobenzofuran (DHBF) structure classes (Table 1) showed IC50 values in the range of 3–30 μM. A representative dose– response curve for Compound 1 is shown in Figure 2-inset. (Individual IC50 curves determined on 3 different days for Compound 1 are shown in Figure S2). To exclude compound-induced cytotoxicity, a membrane integrity assay, based on the release of LDH, was carried out. CHO cells were incubated with 50 μM of each of these six compounds, and there was no observable cytotoxicity. The purity of these compounds was >95% as confirmed by LCMS (see Figure S3). Compounds from these two structural classes were considered lead candidates for further testing in Xenopus oocytes, AQP1-enriched erythrocyte ghosts and AQP1 proteoliposomes.
Table 1.
AQP1 inhibitors (IC50 and structures)
| Compound | Structure | Class | IC50 μM |
|---|---|---|---|
| Compound 1 |
|
ASQ | 2.7 ± 0.6 (n = 10) |
| Compound 2 |
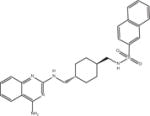
|
ASQ | 3.9 ± 0.4 (n = 6) |
| Compound 3 |
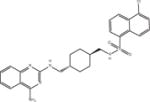
|
ASQ | 5.8 ± 0.5 (n = 6) |
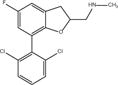
| Compound 4 |
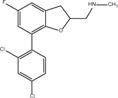
|
DHBF | 9.8 ± 0.7 (n = 10) |
| Compound 5 |

|
DHBF | 15.2 ± 1.1 (n = 3) |
| Compound 6 |
|
DHBF | 29.4 ± 0.8 (n = 3) |
Characterization of lead compounds in the oocyte assay
To eliminate molecules that affect calcein fluorescence independent of an AQP-mediated process, evaluation of compounds was carried out using the oocyte-swelling assay. Pf-values of AQP1-expressing oocytes and control oocytes (n = 15) were 258 ± 58 and 13 ± 2 μm/second, respectively (Figure 5). Raw permeability data for the cohort of 15 oocytes tested are provided in Table S1. The dynamic range, ΔPf = ~200 μm/second, is particularly noteworthy. We observed that ‘lead’ compounds 1 and 4 significantly inhibited swelling kinetics in AQP1-expressing oocytes (Figure 5). We used higher concentrations of the compounds compared to the concentrations used in HTS to investigate the inhibitory effect on AQP1 function. Such an approach is not unusual to overcome the high level of yolk in the frog oocyte that may act as a sink for many molecules (including antibodies), effectively reducing the ambient concentration.
Figure 5.
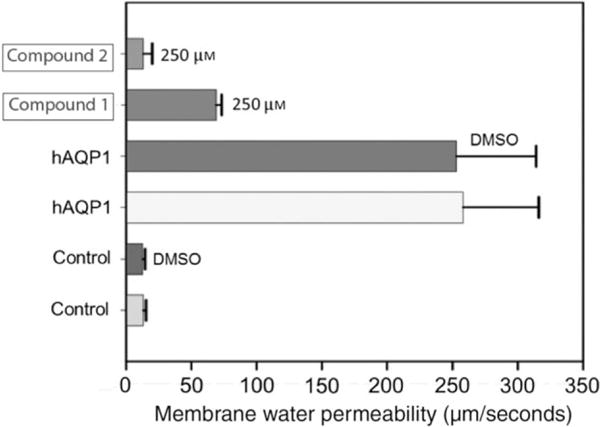
Characterization of AQP1 inhibitors using Xenopus oocyte-swelling assay. Membrane water permeability of Xenopus laevis oocytes injected with distilled water (control) or 25 ng/oocyte human AQP1 cRNA (experimental) is shown. Oocytes were incubated in culture medium, DMSO (solvent used for dissolving the compound) or AQP1 inhibitor dissolved in DMSO as represented in the figure. Membrane water permeability was determined as described in the Methods and Materials section. Each bar represents mean ± SD from 15 oocytes.
Characterization of lead compounds in stopped-flow assays
To rule out the possibility that inhibition of swelling kinetics in CHO cells and Xenopus oocytes might be related to non-aquaporin endogenous membrane proteins, we carried out hypotonic shock experiments in N-lauroyl sarcosine stripped erythrocytes vesicle membranes. These vesicles comprised of uncharged lipids represent the native environment of AQP1 and are highly enriched in AQP1 (~95%) (54). Figure 6 shows that a hypotonic shock was highly sensitive to HgCl2, as has been noted in other studies. Overall, consistent with cell-based results discussed above, compounds in the class I (ASQ Compounds 1–3), and class II (DHBF compounds 4–6) families uniformly show largest reduction in water transport qualitatively similar to that for HgCl2. Among the tested compounds, compounds 2 and 3 from the ASQ class and compounds 4 and 5 of the DHBF class (Table 1) elicited the strongest inhibitory action. AQP1 proteoliposomes reconstituted from purified deglycosylated AQP1 and synthetic lipids subjected to hypertonic shrinking (Figure 6, inset) confirmed that the aromatic sulfonamides and dihydrobenzofurans act similarly on AQP1. We note that although tetraethylammonium (TEA) was shown to be an effective inhibitor both by Brooks and colleagues (40) and Detmers and colleagues (60), TEA appears ineffective in our hand (Figure 6), in line with previous reports (46,61).
Figure 6.
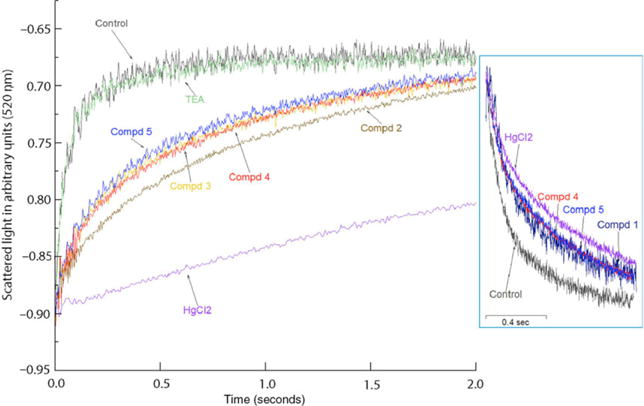
Characterization of AQP1 inhibitors using vesicular assay. The plots represent swelling of NLS-treated AQP1-enriched erythrocyte ghosts under hypo-osmotic shock. Control is ghost only, without any compound. Inset shows a shrinkage assay for purified AQP1 reconstituted proteoliposomes exposed to hyper-osmotic shock. Control is AQP1 proteoliposome only, without any compound. In both sets of experiments, the compounds were at final concentration of 75 μM while HgCl2 was at a concentration of 50 μM.
Discussion
Identification of modulators of aquaporin water channel activity is a relatively challenging proposition (61). An important aspect to facilitate the discovery of suitable modulators is the establishment of high-throughput screening (HTS) assays that are robust, reproducible and appropriately sensitive to allow unequivocal identification of agents (51) that selectively modify AQP function. We describe here a modification of a calcein-quenching method reported earlier (56) in a HTS by monitoring real-time cellular fluorescence kinetics in a 96- and 384-well format using a conventional fluorescence plate reader equipped with integrated liquid handling. It allows screening of thousands of compounds in a short period of time and can be applied to other AQP family members. Recently, a similar method was used for screening inhibitors of AQP4 (49). We screened 6000 compounds and identified several novel AQP1 small-molecule inhibitors.
A salient feature of our CHO swelling assay is the apparent absence of a modulation of the fluorescence signal when the parental cell line was subjected to hypotonic shock. This is generally not encountered in water transport physiology when non-confluent cells are utilized (49). Indeed, if a volumetric response were by definition the only feature of osmosis, we would conclude that these CHO cells are not suitable to study water transport. The absence of a volumetric response has parallels in plant physiology where the osmotic pressure changes the turgor because plant cells have a rigid wall. Hence, an osmotic challenge (action), by definition, leads to a coupled force and volume reaction (62,63). In the absence of a measurable volumetric effect in our case, we hypothesize that the confluent state restricts swelling; the cells support each other and build up a turgor as a response to the osmotic pressure. This is a defining feature of our assay because the introduction of water channels changes the dynamics of the coupled force-volume reaction to the osmotic challenge (action). No longer is the turgor capacity sufficient to withstand a volumetric change; in fact, it facilitates HTS by an all-or-non-volume change, which is the read-out of the assay. We further hypothesize that the expression of membrane-integrated AQP1 should make the membrane more elastic, but the cell still resists expansion as is apparent from the overshoots seen in fluorescence (Figure 1B). The high level of expressed AQP1, which serves to increase rapidly the fluorescence signal, is another factor that facilitates HTS. Further, and in spite of the fact that the rate of fluorescence change is partly obscured by the dead time of dispensing and mixing time with a hypotonic solution, the process allows one to measure change in the shortest possible time and within the dynamic range.
In HTS, it is necessary to determine the statistical factor Z that includes the background of the fluorescent signal, to judge whether the response is significant in a high-throughput setting. We used isotonic responses of AQP1-containing CHO cells because it ensured consistency in the number of cells used and the confluent state in each well. Also, the extent of fluorescence appeared to be a function of the number of expressed AQP1 channels based on the effects of the HgCl2 dosage. However, given the reasons outlined (resisting force, mixing time), dose–response curves from HTS may not agree wholly with dose– response curves from other established assays, for example as reflected in the estimated IC50 values. Notwithstanding, our HTS method with Z-values above 0.5 is robust and reproducible (52) to identify potential lead compounds – the ultimate goal in HTS.
The molecular dimensions of the inhibitors identified here are substantially larger than Hg2+, and therefore, the binding footprints are not likely to be confined to the constriction region of AQP1, for example near the selectivity filter at the extracellular face. Binding to a loop region in the AQP1 vestibule may affect water transport in one direction (swelling), but not the other (shrinking). We could not unequivocally address this important consideration because preparations of AQP1-enriched vesicles from stripped erythrocyte ghost membranes have likely inside-out and right-side-out configurations while AQP1 in proteoliposomes has an equal population of ‘up’ and ‘down’ molecules.
In conclusion, we have identified several compounds that are inhibitory to AQP1 based on three independent assays carried out in, AQP1-expressing CHO cells, in Xenopus oocytes injected with AQP1 cDNA, in stripped erythrocyte vesicles enriched in AQP1 and in AQP1 reconstituted proteoliposomes using synthetic lipids. To improve potency, specificity, and pharmacological properties of selected lead compounds, it will be necessary to define their structure–activity relationship (SAR) by testing similar existing compounds and/or by generating optimized structurally related analogs. These inhibitors may provide a novel therapeutic strategy in restoration of normal water balance in several human diseases such as glaucoma, brain edema, and congestive heart failure.
Supplementary Material
Figure S1. Selection of AQP1 expressing clones.
Figure S2. IC50 curves for Compound 1.
Figure S3. LC-MS data.
Table S1. Water permeability (Pf) data for a set of 15 X. oocytes when challenged with inhibitory compounds 1 and 4.
Acknowledgments
The work in the Mitra laboratory was supported by a grant from Alcon Labs and in part by a R21 grant from NIH-NIDDK (DK60827-02), and the work in the Varadaraj laboratory was supported by a grant from Alcon Labs and in part by R01 grants from NIH-NEI (EY020506 and EY026155). We particularly thank Paul Harris for running LC-MS and interpreting the data for the compounds in Figure 6. We would like to acknowledge Parvaneh Katoli (Alcon Laboratories, Ft. Worth, TX, USA) for her help in testing the compounds in membrane integrity assays and Midori Clarke, Brian Bordeau and Michele Luche (AMRI Bothell Research Center, Bothell, WA, USA) for their help in making the AQP1-expressing CHO cells.
Footnotes
Conflict of Interest
The authors declare that there is no conflict of interests.
Supporting Information
Additional Supporting Information may be found in the online version of this article:
References
- 1.Inase N, Fushimi K, Ishibashi K, Uchida S, Ichioka M, Sasaki S, Marumo F. Isolation of human aquaporin 3 gene. J Biol Chem. 1995;270:17913–17916. doi: 10.1074/jbc.270.30.17913. [DOI] [PubMed] [Google Scholar]
- 2.King LS, Nielsen S, Agre P. Aquaporin-1 water channel protein in lung: ontogeny, steroid-induced expression, and distribution in rat. J Clin Invest. 1996;97:2183–2191. doi: 10.1172/JCI118659. [DOI] [PMC free article] [PubMed] [Google Scholar]
- 3.Lee MD, King LS, Nielsen S, Agre P. Genomic organization and developmental expression of aquaporin-5 in lung. Chest. 1997;111:111S–113S. doi: 10.1378/chest.111.6_supplement.111s. [DOI] [PubMed] [Google Scholar]
- 4.Brown D, Katsura T, Gustafson CE. Cellular mechanisms of aquaporin trafficking. Am J Physiol. 1998;275:F328–F331. doi: 10.1152/ajprenal.1998.275.3.F328. [DOI] [PubMed] [Google Scholar]
- 5.Beitz E, Schultz JE. The mammalian aquaporin water channel family: a promising new drug target. Curr Med Chem. 1999;6:457–467. [PubMed] [Google Scholar]
- 6.Nielsen S, Kwon TH, Christensen BM, Promeneur D, Frokiaer J, Marples D. Physiology and pathophysiology of renal aquaporins. J Am Soc Nephrol. 1999;10:647–663. doi: 10.1681/ASN.V103647. [DOI] [PubMed] [Google Scholar]
- 7.Frigeri A, Nicchia GP, Balena R, Nico B, Svelto M. Aquaporins in skeletal muscle: reassessment of the functional role of aquaporin-4. FASEB J. 2004;18:905–907. doi: 10.1096/fj.03-0987fje. [DOI] [PubMed] [Google Scholar]
- 8.Manley GT, Binder DK, Papadopoulos MC, Verkman AS. New insights into water transport and edema in the central nervous system from phenotype analysis of aquaporin-4 null mice. Neuroscience. 2004;129:983–991. doi: 10.1016/j.neuroscience.2004.06.088. [DOI] [PubMed] [Google Scholar]
- 9.King LS, Kozono D, Agre P. From structure to disease: the evolving tale of aquaporin biology. Nat Rev Mol Cell Biol. 2004;5:687–698. doi: 10.1038/nrm1469. [DOI] [PubMed] [Google Scholar]
- 10.Verkman AS. Role of aquaporin water channels in eye function. Exp Eye Res. 2003;76:137–143. doi: 10.1016/s0014-4835(02)00303-2. [DOI] [PubMed] [Google Scholar]
- 11.Schrier RW, Cadnapaphornchai MA. Renal aquaporin water channels: from molecules to human disease. Prog Biophys Mol Biol. 2003;81:117–131. doi: 10.1016/s0079-6107(02)00049-4. [DOI] [PubMed] [Google Scholar]
- 12.Beitz E, Zenner HP, Schultz JE. Aquaporin-mediated fluid regulation in the inner ear. Cell Mol Neurobiol. 2003;23:315–329. doi: 10.1023/A:1023636620721. [DOI] [PMC free article] [PubMed] [Google Scholar]
- 13.Nielsen S, Frokiaer J, Marples D, Kwon TH, Agre P, Knepper MA. Aquaporins in the kidney: from molecules to medicine. Physiol Rev. 2002;82:205–244. doi: 10.1152/physrev.00024.2001. [DOI] [PubMed] [Google Scholar]
- 14.Kozono D, Yasui M, King LS, Agre P. Aquaporin water channels: atomic structure molecular dynamics meet clinical medicine. J Clin Invest. 2002;109:1395–1399. doi: 10.1172/JCI15851. [DOI] [PMC free article] [PubMed] [Google Scholar]
- 15.Hamann S, la Cour M. Water homeostasis in the ischaemic retina: is aquaporin-4 involved? Acta Ophthalmol Scand. 2005;83:523–525. doi: 10.1111/j.1600-0420.2005.00549.x. [DOI] [PubMed] [Google Scholar]
- 16.Borok Z, Verkman AS. Lung edema clearance: 20 years of progress invited review: role of aquaporin water channels in fluid transport in lung and airways. J Appl Physiol. 2002;93:2199–2206. doi: 10.1152/japplphysiol.01171.2001. [DOI] [PubMed] [Google Scholar]
- 17.Agre P, King LS, Yasui M, Guggino WB, Ottersen OP, Fujiyoshi Y, Engel A, Nielsen S. Aquaporin water channels–from atomic structure to clinical medicine. J Physiol. 2002;542:3–16. doi: 10.1113/jphysiol.2002.020818. [DOI] [PMC free article] [PubMed] [Google Scholar]
- 18.Patil RV, Han Z, Yiming M, Yang J, Iserovich P, Wax MB, Fischbarg J. Fluid transport by human nonpigmented ciliary epithelial layers in culture: a homeostatic role for aquaporin-1. Am J Physiol Cell Physiol. 2001;281:C1139–C1145. doi: 10.1152/ajpcell.2001.281.4.C1139. [DOI] [PubMed] [Google Scholar]
- 19.Verkman AS, Yang B, Song Y, Manley GT, Ma T. Role of water channels in fluid transport studied by phenotype analysis of aquaporin knockout mice. Exp Physiol. 2000;85:233S–241S. doi: 10.1111/j.1469-445x.2000.tb00028.x. Spec No. [DOI] [PubMed] [Google Scholar]
- 20.Baumgarten R, van de Pol MH, Deen PM, van Os CH, Wetzels JF. Dissociation between urine osmolality and urinary excretion of aquaporin-2 in healthy volunteers. Nephrol Dial Transplant. 2000;15:1155–1161. doi: 10.1093/ndt/15.8.1155. [DOI] [PubMed] [Google Scholar]
- 21.Ishikawa Y, Ishida H. Aquaporin water channel in salivary glands. Jpn J Pharmacol. 2000;83:95–101. doi: 10.1254/jjp.83.95. [DOI] [PubMed] [Google Scholar]
- 22.Ma T, Verkman AS. Aquaporin water channels in gastrointestinal physiology. J Physiol. 1999;517(Pt 2):317–326. doi: 10.1111/j.1469-7793.1999.0317t.x. [DOI] [PMC free article] [PubMed] [Google Scholar]
- 23.van Os CH, Deen PM. Role of aquaporins in renal water handling: physiology and pathophysiology. Nephrol Dial Transplant. 1998;13:1645–1651. doi: 10.1093/ndt/13.7.1645. [DOI] [PubMed] [Google Scholar]
- 24.Nielsen S, Terris J, Andersen D, Ecelbarger C, Frokiaer J, Jonassen T, Marples D, Knepper MA, Petersen JS. Congestive heart failure in rats is associated with increased expression and targeting of aquaporin-2 water channel in collecting duct. Proc Natl Acad Sci USA. 1997;94:5450–5455. doi: 10.1073/pnas.94.10.5450. [DOI] [PMC free article] [PubMed] [Google Scholar]
- 25.Cheng A, van Hoek A, Yeager M, Verkman AS, Mitra AK. Structural organization in a human water channel. Nature. 1997;387:627–630. doi: 10.1038/42517. [DOI] [PubMed] [Google Scholar]
- 26.Preston GM, Agre P. Isolation of the cDNA for erythrocyte integral membrane protein of 28 kilodaltons: member of an ancient channel family. Proc Natl Acad Sci USA. 1991;88:11110–11114. doi: 10.1073/pnas.88.24.11110. [DOI] [PMC free article] [PubMed] [Google Scholar]
- 27.Nielsen S, Smith BL, Christensen EI, Knepper MA, Agre P. CHIP28 water channels are localized in constitutively water-permeable segments of the nephron. J Cell Biol. 1993;120:371–383. doi: 10.1083/jcb.120.2.371. [DOI] [PMC free article] [PubMed] [Google Scholar]
- 28.Mulders SM, Preston GM, Deen PM, Guggino WB, van Os CH, Agre P. Water channel properties of major intrinsic protein of lens. J Biol Chem. 1995;270:9010–9016. doi: 10.1074/jbc.270.15.9010. [DOI] [PubMed] [Google Scholar]
- 29.Amiry-Moghaddam M, Xue R, Haug FM, Neely JD, Bhardwaj A, Agre P, Adams ME, Froehner SC, Mori S, Ottersen OP. Alpha-syntrophin deletion removes the perivascular but not endothelial pool of aquaporin-4 at the blood-brain barrier and delays the development of brain edema in an experimental model of acute hyponatremia. FASEB J. 2004;18:542–544. doi: 10.1096/fj.03-0869fje. [DOI] [PubMed] [Google Scholar]
- 30.Yasui M. Molecular mechanisms and drug development in aquaporin water channel diseases: structure and function of aquaporins. J Pharmacol Sci. 2004;96:260–263. doi: 10.1254/jphs.fmj04004x4. [DOI] [PubMed] [Google Scholar]
- 31.Verkman AS. Does aquaporin-1 pass gas? An opposing view. J Physiol. 2002;542:31. doi: 10.1113/jphysiol.2002.024398. [DOI] [PMC free article] [PubMed] [Google Scholar]
- 32.Gonen T, Cheng Y, Sliz P, Hiroaki Y, Fujiyoshi Y, Harrison SC, Walz T. Lipid–protein interactions in double-layered two-dimensional AQP0 crystals. Nature. 2005;438:633–638. doi: 10.1038/nature04321. [DOI] [PMC free article] [PubMed] [Google Scholar]
- 33.Ho JD, Yeh R, Sandstrom A, Chorny I, Harries WE, Robbins RA, Miercke LJ, Stroud RM. Crystal structure of human aquaporin 4 at 1.8 Å and its mechanism of conductance. Proc Natl Acad Sci USA. 2009;106:7437–7442. doi: 10.1073/pnas.0902725106. [DOI] [PMC free article] [PubMed] [Google Scholar]
- 34.Murata K, Mitsuoka K, Hirai T, Walz T, Agre P, Heymann JB, Engel A, Fujiyoshi Y. Structural determinants of water permeation through aquaporin-1. Nature. 2000;407:599–605. doi: 10.1038/35036519. [DOI] [PubMed] [Google Scholar]
- 35.Ren G, Reddy VS, Cheng A, Melnyk P, Mitra AK. Visualization of a water-selective pore by electron crystallography in vitreous ice. Proc Natl Acad Sci USA. 2001;98:1398–1403. doi: 10.1073/pnas.041489198. [DOI] [PMC free article] [PubMed] [Google Scholar]
- 36.Sui H, Han BG, Lee JK, Walian P, Jap BK. Structural basis of water-specific transport through the AQP1 water channel. Nature. 2001;414:872–878. doi: 10.1038/414872a. [DOI] [PubMed] [Google Scholar]
- 37.Macey RI. Transport of water and ureea in red blood cells. Am J Physiol. 1984;246:C195–C203. doi: 10.1152/ajpcell.1984.246.3.C195. [DOI] [PubMed] [Google Scholar]
- 38.Niemietz CM, Tyerman SD. New potent inhibitors of aquaporins: silver and golds compounds inhibit aquaporins of plant and human origin. FEBS Lett. 2002;531:443–447. doi: 10.1016/s0014-5793(02)03581-0. [DOI] [PubMed] [Google Scholar]
- 39.Zelenina M, Tritto S, Bondar AA, Zelenin S, Aperia A. Copper inhibits the water and glycerol permeability of aquaporin-3. J Biol Chem. 2004;279:51939–51943. doi: 10.1074/jbc.M407645200. [DOI] [PubMed] [Google Scholar]
- 40.Brooks HL, Regan JW, Yool AJ. Inhibition of aquaporin-1 water permeability by tetraethylammonium: involvement of the loop E pore region. Mol Pharmacol. 2000;57:1021–1026. [PubMed] [Google Scholar]
- 41.Gao J, Wang X, Chang Y, Zhang J, Song Q, Yu H, Li X. Acetazolamide inhibits water permeability by interaction with aquaporin-1. Anal Biochem. 2006;350:165–170. doi: 10.1016/j.ab.2006.01.003. [DOI] [PubMed] [Google Scholar]
- 42.Tanimura Y, Hiraoki Y, Fujiyoshi Y. Acetazolamide reversibly inhibits water conduction by aquaporin-4. J Struct Biol. 2009;166:16–21. doi: 10.1016/j.jsb.2008.11.010. [DOI] [PubMed] [Google Scholar]
- 43.Huber VJ, Tsujita M, Nakada T. Identification of aquaporin 4 inhibitors using in vitro and in sillico methods. Bioorg Med Chem. 2008a;17:411–417. doi: 10.1016/j.bmc.2007.12.040. [DOI] [PubMed] [Google Scholar]
- 44.Huber VJ, Tsujita M, Kwee IL, Nakada T. Inhibition of aquaporin 4 by antiepileptic drugs. Bioorg Med Chem. 2008b;17:418–424. doi: 10.1016/j.bmc.2007.12.038. [DOI] [PubMed] [Google Scholar]
- 45.Yool AJ, Brown EA, Flynn GA. Roles for novel pharmacological blockers of aquaporins in the treatment of brain oedema and cancer. Clin Exp Phramacol Physiol. 2010;37:403–409. doi: 10.1111/j.1440-1681.2009.05244.x. [DOI] [PubMed] [Google Scholar]
- 46.Sogaard R, Zeuthen T. Test of blockers of AQP1 water permeability by a high-resolution method: no effects of tetraethylammonium ions or acetazolamide. Pflugers Arch. 2008;456:285–292. doi: 10.1007/s00424-007-0392-2. [DOI] [PubMed] [Google Scholar]
- 47.Muller EM, Hub JS, Grubmuller H, de Groot BL. Is TEA an inhibitor for aquaporin-1. Pflugers Arch. 2008;456:663–669. doi: 10.1007/s00424-007-0422-0. [DOI] [PMC free article] [PubMed] [Google Scholar]
- 48.Yang B, Zhang H, Verkman AS. Lack of aquaporin-4 water transport inhibition by antiepilpetics and arylsulfonamides. Bioorg Med Chem. 2008;16:7489–7493. doi: 10.1016/j.bmc.2008.06.005. [DOI] [PMC free article] [PubMed] [Google Scholar]
- 49.Mola MG, Nicchia GP, Svelto M, Spray DC, Frigeri A. Automated cell-based assay for screening of aquaporin inhibitors. Anal Chem. 2009;81:8219–8229. doi: 10.1021/ac901526k. [DOI] [PMC free article] [PubMed] [Google Scholar]
- 50.Seeliger D, Zapater C, Krenc D, Haddoub R, Flitsch S, Beitz E, Cerda J, de Groot BL. Discovery of novel human aquaporin-1 blockers. ACS Chem Biol. 2013;8:249–256. doi: 10.1021/cb300153z. [DOI] [PubMed] [Google Scholar]
- 51.Zhang JH, Chung TD, Oldenburg KR. A simple statistical parameter for use in evaluation and validation of high throughput screening assays. J Biomol Screen. 1999;4:67–73. doi: 10.1177/108705719900400206. [DOI] [PubMed] [Google Scholar]
- 52.Varadaraj K, Kumari SS, Patil R, Wax MB, Mathias RT. Functional characterization of a human aquaporin 0 mutation that leads to a congenital dominant lens cataract. Exp Eye Res. 2008;87:9–21. doi: 10.1016/j.exer.2008.04.001. [DOI] [PMC free article] [PubMed] [Google Scholar]
- 53.Varadaraj K, Kumari SS, Mathias RT. Transgenic expression of AQP1 in the fiber cells of AQP0 knockout mouse: effects on lens transparency. Exp Eye Res. 2010;91:393–404. doi: 10.1016/j.exer.2010.06.013. [DOI] [PMC free article] [PubMed] [Google Scholar]
- 54.van Hoek AN, Wiener MC, Verbavatz JM, Brown D, Lipniunas PH, Townsend RR, Verkman AS. Purification and structure–function analysis of native, PNGase F-treated, and endo-beta-galactosidase-treated CHIP28 water channels. Biochemistry. 1995;34:2212–2219. doi: 10.1021/bi00007a015. [DOI] [PubMed] [Google Scholar]
- 55.Loo T, Patchett ML, Norris GE, Lott JS. Using secretion to solve a solubility problem: high-yield expression in Escherichia coli and purification of the bacterial glycoamidase PNGase F. Protein Expr Purif. 2002;24:20–28. doi: 10.1006/prep.2001.1555. [DOI] [PubMed] [Google Scholar]
- 56.Solenov E, Watanabe H, Manley GT, Verkman AS. Sevenfold-reduced osmotic water permeability in primary astrocyte cultures from AQP-4-deficient mice, measured by a fluorescence quenching method. Am J Physiol Cell Physiol. 2004;286:C426–C432. doi: 10.1152/ajpcell.00298.2003. [DOI] [PubMed] [Google Scholar]
- 57.Farinas J, Simanek V, Verkman AS. Cell volume measured by total internal reflection microfluorimetry: application to water and solute transport in cells transfected with water channel homologs. Biophys J. 1995;68:1613–1620. doi: 10.1016/S0006-3495(95)80335-8. [DOI] [PMC free article] [PubMed] [Google Scholar]
- 58.Levin MH, Verkman AS. Aquaporin-dependent water permeation at the mouse ocular surface: in vivo microfluorimetric measurements in cornea and conjunctiva. Invest Ophthalmol Vis Sci. 2004;45:4423–4432. doi: 10.1167/iovs.04-0816. [DOI] [PubMed] [Google Scholar]
- 59.Li L, Zhang H, Ma T, Verkman AS. Very high aquaporin-1 facilitated water permeability in mouse gallbladder. Am J Physiol Gastrointest Liver Physiol. 2009;296:G816–G822. doi: 10.1152/ajpgi.90680.2008. [DOI] [PMC free article] [PubMed] [Google Scholar]
- 60.Detmers FJ, de Groot BL, Müller EM, Hinton A, Konings IB, Sze M, Flitsch SL, Grubmüller H, Deen PM. Quaternary ammonium compounds as water channel blockers. Specificity, potency, and site of action. J Biol Chem. 2006;281:14207–14214. doi: 10.1074/jbc.M513072200. [DOI] [PubMed] [Google Scholar]
- 61.Verkman AS, Anderson MO, Papadopoulos MC. Aquaporins: important but elusive drug targets. Nat Rev Drug Discovery. 2014;13:259–277. doi: 10.1038/nrd4226. [DOI] [PMC free article] [PubMed] [Google Scholar]
- 62.Alan F, editor. Water Movement Through Lipid Bilayers, Pores, and Plasma Membranes: Theory and Reality. New York: Wiley Interscience; p. 228. [DOI] [PubMed] [Google Scholar]
- 63.Davis IS, Shachar-Hill B, Curry MR, Kim KS, Pedley TJ, Hill AE. Osmosis in semi-permeable pores: an examination of the basic flow equations based on an experimental and molecular dynamics study. Proc R Soc A. 2007;463:881–896. [Google Scholar]
Associated Data
This section collects any data citations, data availability statements, or supplementary materials included in this article.
Supplementary Materials
Figure S1. Selection of AQP1 expressing clones.
Figure S2. IC50 curves for Compound 1.
Figure S3. LC-MS data.
Table S1. Water permeability (Pf) data for a set of 15 X. oocytes when challenged with inhibitory compounds 1 and 4.