

Abstract
Objective
This study aimed to 1) characterize temporal response properties of the auditory nerve in implanted children with auditory neuropathy spectrum disorder (ANSD); and 2) compare results recorded in implanted children with ANSD with those measured in implanted children with sensorineural hearing loss (SNHL).
Design
Participants included 28 children with ANSD and 29 children with SNHL. All subjects used Cochlear Nucleus devices in their test ears. Both ears were tested in six children with ANSD and three children with SNHL. For all other subjects, only one ear was tested. The electrically-evoked compound action potential (ECAP) was measured in response to each of the 33 pulses in a pulse train (excluding the second pulse) for one apical, one middle-array, and one basal electrode. The pulse train was presented in a monopolar-coupled stimulation mode at four pulse rates: 500, 900, 1800 and 2400 pulses per second (pps). Response metrics included the averaged amplitude, latencies of response components and response width, the alternating depth and the amount of neural adaptation. These dependent variables were quantified based on the last six ECAPs or the six ECAPs occurring within a time window centered around 11–12 ms. A Generalized Linear Mixed Model (GLMM) was used to compare these dependent variables between the two subject groups. The slope of the linear fit of the normalized ECAP amplitudes (re. amplitude of the first ECAP response) over the duration of the pulse train was used to quantify the amount of ECAP increment over time for a subgroup of nine subjects.
Results
Pulse train evoked ECAPs were measured in all but eight subjects (five with ANSD and three with SNHL). ECAPs measured in children with ANSD had smaller amplitude, longer averaged P2 latency and greater response width than children with SNHL. However, differences in these two groups were only observed for some electrodes. No differences in averaged N1 latency or in the alternating depth were observed between children with ANSD and children with SNHL. Neural adaptation measured in these two subject groups was comparable for relatively short durations of stimulation (i.e. 11–12 ms). Children with ANSD showed greater neural adaptation than children with SNHL for a longer duration of stimulation. Amplitudes of ECAP responses rapidly declined within the first few milliseconds of stimulation, followed by a gradual decline up to 64 ms after stimulus onset in the majority of subjects. This decline exhibited an alternating pattern at some pulse rates. Further increases in pulse rate diminished this alternating pattern. In contrast, ECAPs recorded from at least one stimulating electrode in six ears with ANSD and three ears with SNHL showed a clear increase in amplitude over the time course of stimulation. The slope of linear regression functions measured in these subjects was significantly greater than zero.
Conclusions
Some but not all aspects of temporal response properties of the auditory nerve measured in this study differ between implanted children with ANSD and implanted children with SNHL. These differences are observed for some but not all electrodes. A new neural response pattern is identified. Further studies investigating its underlying mechanism and clinical relevance are warranted.
Keywords: electrical stimulation, auditory neuropathy spectrum disorders, electrically-evoked compound action potential, cochlear implant
INTRODUCTION
Auditory neuropathy spectrum disorder (ANSD) is a form of hearing impairment that is characterized by evidence of normal cochlear function in conjunction with an abnormal auditory neural system. The etiology of the disorder is varied and auditory abilities among patients with ANSD are diverse and, in many cases, poorly understood. The possible underlying pathology is referred to as a pre-neural abnormality if only the inner hair cells and/or the formation/release of neural transmitters are affected (Rance and Baker, 2009). Neural abnormality refers to conditions where the auditory nerve and its brainstem connections are affected (Rance and Baker, 2009; Rance et al., 2012a, 2014; Starr, 1996). Demyelination and axonal neuropathy are the two most commonly encountered neural abnormalities in patients with ANSD (Rance et al., 2005; Starr and Rance, 2015). In addition, the ANSD phenotype in some patients is due to pathological conditions that affect cellular energy production (i.e. mitochondrial disease or respiratory chain deficiencies) (Cacace and Pinheiro, 2011; Rance et al., 2008, 2010, 2012b; Shidara and Hollenbeck, 2010; Schmucker and Puccio, 2010). In these patients, both pre-neural and neural components are affected. Due to the lack of appropriate noninvasive testing procedures, the site of lesion cannot be determined for the majority of these patients.
Patients with ANSD typically demonstrate significant auditory processing deficits in tasks that require precise encoding of timing cues, and the severity of these deficits strongly correlate with their speech perception capabilities (Starr et al., 1991; Berlin et al., 1993; Starr et al., 1996; Hood, 1999; Zeng et al., 1999; Kraus et al., 2000; Rance et al., 2004; Zeng et al., 2005). In contrast, auditory temporal processing capabilities measured in patients with sensorineural hearing loss (SNHL) are comparable with those measured in normal-hearing listeners once audibility is fully compensated for (e.g. Bacon & Gleitman, 1992; Grose et al., 2004; Glasberg et al., 1987; Moore et al, 1989). It is generally believed that the auditory temporal processing deficits observed in patients with ANSD are likely due to jitter (temporal smearing) in the neural representation of encoded sound caused by dyssynchronous neural discharge and/or abnormal neural conduction of the auditory nerve (Starr et al., 1996, 2003; Zeng et al., 2005).
Cochlear implantation has been used to manage hearing deficits for patients with ANSD who do not benefit from hearing aids. Compared with acoustic stimulation, electrical stimulation can result in recruitment of a larger group of neurons, faster growths of discharge rate, greater maximum firing rate, better phase locking, and more precise and repeatable neural synchronization at the level of the auditory nerve (e.g. Kiang and Moxon, 1972; Hartmann et al., 1984; Zhang et al., 2007; Zhou et al., 1995). Auditory temporal processing deficits in patients with ANSD should be largely ameliorated in cases where electrical stimulation can substantially improve neural synchrony and neural conduction at the level of the auditory nerve. However, some children with ANSD still have auditory temporal processing deficits even after cochlear implantation (He et al., 2013), which suggests that neural dyssynchrony and/or abnormal neural conduction still exist in these patients.
Although it is not feasible to directly evaluate the extent to which electrical stimulation improves neural synchrony and neural conduction at the level of the auditory nerve in human listeners, useful information reflecting these neural response properties can be obtained by measuring the electrically evoked compound action potential (ECAP). The ECAP represents the synchronous firing of a population of electrically stimulated auditory nerve fibers. By using different stimulation paradigms, results of ECAP measures can provide information about many aspects of temporal response properties of the auditory nerve, including refractory recovery, adaptation, neural conduction, etc. For example, the refractory recovery of the auditory nerve can be evaluated using the single-pulse forward masking (SPFM) paradigm for ECAP measurement (e.g. Brown et al., 1990; Stypulkowski and van den Honert, 1984). This technique relies on an initial (masking) pulse bringing the auditory nerve into a refractory state such that a subsequent probe pulse does not generate a neural response; this technique allows for differentiation of stimulus artifact from neural response. Using the SPFM paradigm, three studies assessed time constants of the refractory recovery of the auditory nerve in patients with ANSD and compared the results to those measured in patients with SNHL (Fulmer et al., 2011; Kim et al., 2011; Runge et al., 2013). Results of these studies revealed no difference in the speed of single-pulse refractory recovery between these two patient populations.
In typical programming strategies, current CIs deliver trains of amplitude-modulated biphasic pulses to the auditory nerve. The stimulation rate typically used in clinical practice ranges from 250 up to 5980 pulses per second (pps) per channel. The ability of the auditory nerve to faithfully encode and transmit pulse-train stimulation to higher order structures in the auditory pathway may be important for CI outcomes. Therefore, a stimulation paradigm using trains of biphasic pulses represents a more realistic stimulation condition than the single pulse stimulation for CI users.
The temporal response properties of the auditory nerve have been evaluated at different stimulation rates per channel by measuring ECAP amplitude in response to individual pulses in a constant-amplitude pulse train for subjects with SNHL (Finley et al., 1997; Hay-McCutcheon et al., 2005; Hughes et al., 2012, 2014; McKay et al., 2013; Rubinstein et al., 1999; Wilson et al., 1997). Results of these studies revealed that ECAP amplitudes were relatively stable across individual pulses at slow rates (< 200 pulses per second [pps], Wilson et al., 1997), which suggests that the excitability of auditory nerve fibers fully recovers in these conditions between any two pulsatile stimulations (Matsuoka et al., 2000a; Wilson et al., 1997). At higher stimulation rates, ECAP amplitudes rapidly decreased in the first few milliseconds after stimulus onset followed by a more gradual decline up to 30 ms. This decrease in ECAP amplitude as a function of pulse number also showed an alternating response pattern which is believed to be a result of the refractory properties of auditory neurons (Abbas et al., 2001; Finley et al., 1997; Matsuoka et al., 2000b; Wilson et al., 1997). Theoretically, a large group of neurons with maximum excitability are activated by the first pulse. While these neurons are in their refractory phase, they will be unresponsive to the second pulse if the time period between these pulses is less than 3 or 4 ms (i.e. recovery time after the response to a single pulse). At the time of the third pulse, many of these neurons that were in their refractory phase following stimulation by the first pulse will now be sufficiently recovered to be excited by the third pulse. As a result, ECAP amplitude to the third pulse will be larger than that to the second pulse. This recovery-refractory process occurs during the entire process of pulse-train stimulation, which results in a pattern of ECAP amplitude alternation between smaller and larger amplitudes across pulse presentations (Wilson et al., 1997). This alternating pattern may become less robust or even diminish when more neurons are recruited with successive pulses in the pulse train and/or neural dyssynchrony exists since the effects of neuronal refractoriness on ECAP amplitudes will be reduced. The pulse rate at which the maximum alternating depth occurs is defined as the maximum alternating rate, which is expected to “resonate” with the relative refractory period of the stimulated auditory nerve fibers (Hughes et al., 2012; Matsuoka et al. 2000a). Further increases in stimulation rate diminished this alternating pattern due to the combined effects of reduced refractory recovery, increased neural adaptation, and increased temporal jitter (Hay-McCutcheon et al., 2005; Hughes et al., 2012, 2014; Miller et al., 2008; Mino and Rubinstein, 2006). The rate at which the alternating pattern is no longer evident is referred to as the stochastic rate (Hughes et al., 2012). The degree of neural adaptation is quantified by comparing amplitudes of ECAPs elicited by pulses occurring later in the pulse train to ECAP amplitudes elicited by early pulses (Hay-McCutcheon et al., 2005; Hughes et al., 2012, 2014). For the stimulation paradigm used in this study, the term of ‘adaptation’ refers to a reduction in ECAP amplitude for pulses occurring later in the pulse train regardless of underlying mechanisms.
It has been shown that some patients with ANSD require relatively slow stimulation rates per channel in order to benefit from their CIs (Peterson et al., 2003; Pelosi et al., 2012). These results suggest that temporal response properties of the auditory nerve in these patients may be different from those reported for patients with SNHL. Theoretically, neural dyssynchrony and abnormal neural conduction can affect many aspects of temporal response properties of the auditory nerve, which can be reflected in ECAP measures. For example, robust ECAP response depends on highly synchronized neural activation. Less synchronized neural response could cause reduced ECAP amplitude, prolonged ECAP latency and increased neural adaptation. In addition, neural dyssynchrony across auditory nerve fibers also reduces the amount of amplitude alternation (Matsuoka et al., 2000b). Furthermore, demyelination of auditory nerve fibers could result in spread of excitation across demyelinated auditory nerve fibers and alter cell membrane properties (McDonald and Sears, 1970; Rasminsky and Sears, 1972; Pender and Sears, 1984). These changes might cause spatial and temporal summation of neural responses, as well as prolonged or blocked neural conduction (Rasminsky and Sears, 1972; Starr et al., 1998). The spatial and temporal summation of the neural response may also reduce the effects of neuronal refractoriness on the alternating pattern of ECAP amplitudes. If so, decreased alternating depth is likely to be seen in patients with ANSD. Similarly, since prolonged or blocked neural conduction can further increase peak latency and response width of ECAP responses, as well as increase the amount of neural adaptation, these patterns are also likely to be present in these patients. To date, no study has systematically investigated the temporal responsiveness of the auditory nerve using pulse-train ECAP measures in children with ANSD. This project specifically addressed this need.
This study aimed to 1) characterize temporal response properties of the auditory nerve to pulse-train stimulation in implanted children with ANSD; and 2) compare results obtained in children with ANSD with those measured in implanted children with SNHL. We hypothesized that temporal response properties of the auditory nerve would be different between these two subject groups. It was expected that ECAPs recorded in children with ANSD would have smaller overall amplitude, longer latency, broader morphology, smaller alternation depth, and more neural adaptation than those measured in children with SNHL.
METHODS
Subjects
All subjects were recruited from the Carolina Children’s Communicative Disorders Program (CCCDP) within the Department of Otolaryngology/Head and Neck Surgery at the University of North Carolina at Chapel Hill (UNC-CH). The institutional review board (IRB) at UNC-CH approved this study. Written informed consents (using UNC-CH IRB-approved forms) were obtained before testing. All subjects were compensated for their participation.
Two groups of pre-lingually-deafened cochlear implant users who were matched on age at implantation and age at testing were recruited for this study: subjects with ANSD and subjects with SNHL. The diagnostic protocol currently used at UNC for children with suspected hearing loss includes concurrent audiologic and medical assessment. This protocol has been reported in detail in previous published studies (Adunka et al., 2006, 2007; Buchman et al., 2006; Teagle et al., 2010). Subjects were diagnosed with ANSD if they showed gross inconsistency between cochlear and neural functions. Specifically, subjects with ANSD were diagnosed based on the presence of a cochlear microphonic (+/−otoacoustic emissions) (indicative of normal hair cell function) with absent or abnormal auditory brainstem responses (indicative of aberrant auditory neural function). In addition to the phenotype of ANSD, two subjects (A4 and A20) were also diagnosed with cochlear nerve deficiency (CND) since the cochlear nerve or its osseous conduit was not visible on high-resolution computed tomography (CT) or magnetic resonance imaging (MRI) in the presence of profound hearing loss (Buchman et al., 2006). Subjects with SNHL were diagnosed based on the presence of hearing loss with no air-bone gap and the consistency between cochlear and neural functions.
Measurable ECAPs were recorded in 23 children with ANSD (A1-A23) and 26 children with SNHL (S1-S26). In addition to the subjects included in this study, five children with ANSD and three children with SNHL were initially enrolled but were subsequently excluded since artifact-free ECAPs could not be recorded from any stimulating electrodes using the modified forward masking paradigm. Methodological details of the modified forward masking paradigm are reported in the ECAP Measures section. There were 16 children with ANSD and 18 children with SNHL who were bilaterally implanted. ECAPs were recorded from both ears in six children with ANSD (A3, A10, S16, A18, A19 and A20) and three children with SNHL (S2, S14 and S25). For other bilaterally implanted subjects, the test ear was chosen randomly. As a result, measurable ECAPs were recorded in 29 ears of 23 children with ANSD and 29 ears of 26 children with SNHL.
Age at testing ranged between 2.8 and 17.8 yrs (mean: 8.1 yrs, SD: 3.2 yrs) for the ANSD group and between 2.8 and 19.0 yrs (mean: 8.2 yrs, SD: 3.8 yrs) for the SNHL group. Subject A15 was diagnosed with global neuropathy due to symptoms of neuropathy in other systems. All subjects had been implanted with a Cochlear Corporation device (Englewood, CO) with full insertion of the 22-electrode array in the test ear except for the two subjects with CND, and the duration of use was at least 3 months prior to testing. Subject A4 has 17 electrodes and subject A20 has 14 electrodes inserted in the cochlea. Duration of implant use at the time of testing ranged from 0.3 to 7.0 yrs (mean: 3.3 yrs, SD: 2.0 yrs) for the ANSD group and from 0.8 to 8.8 yrs (mean: 3.6 yrs, SD: 2.2 yrs) for the SNHL group. Results of a one-way Analysis of Variance (ANOVA) revealed no significant difference in age at implantation, age at testing, or duration of CI use between subjects with ANSD and subjects with SNHL (p>0.05). Detailed demographic information for these subjects is listed in Table 1.
Table 1.
Demographic information of all subjects who participated in this study.
| Gender | Ear tested | Age at implantation (yrs) | Age at testing (yrs) | Risk factors/Etiology | Internal device and electrode array | Electrode tested | Electrodes with increasing neural response patterns | |
|---|---|---|---|---|---|---|---|---|
| A1 | M | R | 8.24 | 8.61 | Prematurity, hyperbilirubinemia | Nucleus 24RE (CA) | 3, 12, 19 | |
| A2 | M | R | 2.25 | 7.12 | Unknown | Nucleus 24RE (CA) | 3, 12, 19 | |
| A3L | M | L | 7.17 | 9.13 | Unknown | Nucleus CI512 | 3, 12, 19 | |
| A3R | M | R | 5.05 | 10.05 | Unknown | Nucleus 24RE (CA) | 3, 12, 19 | |
| A4* | M | L | 4.66 | 8.42 | Unknown | Nucleus 24RE (CS) | 13, 18, 22 | 18 |
| A5 | F | L | 15.37 | 17.81 | Unknown | Nucleus 24RE (CS) | 3, 12, 19 | |
| A6 | F | L | 3.14 | 8.38 | Prematurity | Nucleus 24RE (CA) | 3, 12, 19 | |
| A7 | F | L | 6.25 | 8.30 | Prematurity, hyperbilirubinemia | Nucleus CI512 | 4, 12, 19 | |
| A8 | F | R | 1.90 | 4.28 | Prematurity | Nucleus CI512 | 3, 12, 19 | |
| A9L | F | L | 3.79 | 4.48 | Prematurity | CI422 | 4, 12, 19 | 4 |
| A9R | F | R | 2.55 | 2.83 | Prematurity, hyperbilirubinemia | CI422 | 3, 12, 19 | |
| A10 | F | R | 3.29 | 10.29 | Unknown | Nucleus 24RE (CA) | 3, 12, 19 | |
| A11 | M | R | 2.31 | 4.06 | Prematurity hyperbilirubinemia | Nucleus CI512 | 3, 12, 19 | |
| A12 | F | L | 4.69 | 5.06 | Prematurity | Nucleus 24RE (CA) | 3, 12, 19 | |
| A13 | M | L | 6.50 | 7.43 | Prematurity, hyperbilirubinemia | Nucleus 24RE (CA) | 3, 12, 19 | |
| A14 | M | L | 1.88 | 6.38 | Prematurity | Nucleus 24RE (CA) | 3, 12, 19 | |
| A15L | M | L | 3.08 | 7.79 | Prematurity | Nucleus 24RE (CA) | 3, 12, 19 | 3 |
| A15R | M | R | 5.31 | 8.50 | Prematurity | Nucleus CI512 | 3, 12, 19 | |
| A16 | F | L | 1.32 | 4.33 | Unknown | Nucleus CI512 | 5, 12, 19 | |
| A17L | M | L | 8.87 | 10.12 | Prematurity | Nucleus 24RE (CA) | 3, 12, 19 | |
| A17R | M | R | 3.97 | 9.18 | Prematurity, hyperbilirubinemia | Nucleus 24RE (CA) | 3, 12, 19 | |
| A18L | F | L | 7.56 | 8.93 | Unknown | Nucleus 24RE (CA) | 3, 12, 19 | |
| A18R | F | R | 5.87 | 8.97 | Unknown | Nucleus CI512 | 3, 12, 19 | |
| A19L | F | L | 2.54 | 6.82 | Prematurity | CI422 | 3, 12, 19 | 19 |
| A19R | F | R | 2.60 | 7.66 | Prematurity | Nucleus, 24RE (CS) | 5, 12, 19 | |
| A20* | F | L | 2.29 | 8.36 | Prematurity, hyperbilirubinemia | Nucleus 24RE (CS) | 11, 12, 13 | 12 |
| A21 | M | R | 6.11 | 11.59 | Prematurity | Nucleus 24RE (CA) | 3, 12, 19 | |
| A22 | M | R | 1.5 | 4.1 | Unknown | Nucleus 24RE (CA) | 3, 12, 19 | |
| A23 | M | L | 1.9 | 8.9 | Prematurity hyperbilirubinemia | Nucleus 24RE (CA) | 3, 12, 19 | 3, 19 |
| S1 | M | R | 2.53 | 10.47 | EVA | Nucleus 24RE (CA) | 3, 12, 19 | |
| S2L | M | L | 5.16 | 10.39 | Genetic | Nucleus CI512 | 3, 12, 19 | 12 |
| S2R | M | R | 4.87 | 12.46 | Genetic | Nucleus 24RE (CA) | 3, 12, 19 | |
| S3 | M | R | 1.11 | 6.60 | Unknown | Nucleus 24RE (CA) | 3, 12, 19 | |
| S4 | M | R | 3.69 | 8.28 | Unknown | Nucleus CI512 | 4, 12, 19 | |
| S5 | M | R | 2.90 | 5.54 | Unknown | Nucleus 24RE (CA) | 3, 12, 19 | |
| S6 | F | R | 4.94 | 13.73 | Unknown | Nucleus CI512 | 3, 12, 19 | 12 |
| S7 | F | R | 10.13 | 13.12 | Unknown | Nucleus 24RE (CA) | 3, 12, 19 | |
| S8 | F | L | 9.35 | 12.29 | Genetic | Nucleus 24RE (CA) | 3, 12, 19 | |
| S9 | M | L | 11.25 | 13.73 | Unknown | Nucleus 24RE (CA) | 4, 13, 22 | |
| S10 | F | L | 1.17 | 7.82 | Genetic | Nucleus 24RE (CA) | 3, 12, 19 | |
| S11 | M | R | 5.64 | 7.64 | Unknown | Nucleus 24RE (CS) | 3,12, 19 | |
| S12 | M | R | 1.03 | 6.62 | Genetic | Nucleus 24RE (CA) | 3, 12, 19 | |
| S13 | M | R | 10.77 | 11.91 | Anatomy Malformation | Nucleus 24RE (CA) | 3, 12, 19 | |
| S14L | F | L | 2.09 | 4.08 | Unknown | Nucleus 24RE (CA) | 3, 12, 19 | |
| S14R | F | R | 1.11 | 3.9 | Unknown | Nucleus 24RE (CA) | 4, 12, 19 | |
| S15 | F | L | 2.23 | 5.34 | EVA | Nucleus CI512 | 5, 12, 19 | |
| S16 | F | R | 8.78 | 9.62 | Unknown | Nucleus 24RE (CA) | 3, 12, 19 | |
| S17 | F | R | 1.33 | 6.51 | Unknown | Nucleus 24RE (CA) | 3, 12, 19 | |
| S18 | F | R | 5.04 | 8.64 | Anatomy Malformation | Nucleus CI512 | 3, 12, 19 | |
| S19 | M | R | 17.81 | 19.06 | EVA | Nucleus 24RE (CA) | 4, 12, 19 | |
| S20 | M | R | 3.31 | 8.93 | EVA | Nucleus 24RE (CA) | 3, 13, 19 | |
| S21 | M | R | 1.95 | 5.42 | Meningitis | Nucleus CI512 | 3, 12, 19 | 12, 19 |
| S22 | M | L | 3.24 | 8.36 | EVA | Nucleus 24RE (CA) | 8, 12, 19 | |
| S23 | F | L | 3.07 | 4.01 | Unknown | Nucleus 24RE (CA) | 3, 12, 19 | |
| S24 | M | R | 4.84 | 5.94 | unknown | Nucleus 24RE (CA) | 3, 12, 19 | |
| S25L | M | L | 1.67 | 2.83 | CMV infection | Nucleus 24RE (CA) | 3, 12, 19 | |
| S25R | M | R | 1.11 | 2.80 | CMV infection | Nucleus 24RE (CA) | 3, 12, 19 | |
| S26 | F | R | 3.64 | 5.44 | Unknown | Nucleus CI512 | 3, 12, 19 |
M = male, F = female, L = left, R = right,
= patients with auditory nerve deficiency (CND), EVA = Enlarged vestibular aqueduct. CMV=Cytomegalovirus
ECAP Measures
Equipment and Stimuli
ECAPs were measured using the Advanced Neural Response Telemetry (NRT) function that is implemented in the Custom Sound EP (v. 3.2) commercial software (Cochlear Ltd, Macquarie, NSW, Australia) via a Freedom or N5 sound processor interfaced with a programming pod. The stimulus was a train of biphasic, cathodic-leading, charge-balanced pulses presented in a monopolar-coupled mode. Regardless of variations in programming parameters in their everyday MAPs among subjects, the pulse width and the inter-phase gap used in this study were always 25 μs/phase and 7 μs, respectively. The effective sampling rate used for ECAP measures was 20 kHz.
Behavioral Measures
Prior to ECAP measures, the maximum comfortable level (C-level) was established for each stimulating electrode and each subject using a 2400-pps pulse train of 33 pulses presented at a rate of 15 pulse trains per second. The stimulus was presented to individual electrodes using the “Stimulation Only” mode in NRT. Stimulation was first presented at a relatively low level and gradually increased in steps of 5 Current Level (CL) units. Subjects who could reliably rate the loudness of auditory stimulation used a visual rating scale (scale of 1–10, where 1 is just audible and 10 is too loud) to indicate when the sound was loud but comfortable (rating of 8). This procedure was performed three times for each electrode and each subject. The average of the three trials was computed and these values were used for ECAP recordings. Subjects who could verbally describe the sound but were unable to rate the loudness were asked to report whether they heard a “good” or “bad” sound for each stimulus as the stimulation level gradually increased in 5-CL steps. In addition, an experienced researcher and the parent/caregiver observed the subjects for any sign of discomfort and/or facial stimulation during stimulation. The stimulation was stopped when the sound was reported to be “bad” for the first time. The stimulation level was then decreased in 2-CL steps until the sound was reported to be “good” again. This procedure was also repeated three times for each electrode and each subject. The average of the three trials was computed and these values were used for ECAP recordings. For two subjects (A10 and S25) who were too young to make reliable behavioral responses, two experienced researchers and the parent/caregiver closely observed the subjects for any sign of discomfort and facial stimulation while the stimulation level gradually increased during stimulation. The pulse train was presented at 10 CLs lower than the stimulation level where subjects showed signs of discomfort or facial stimulation for ECAP measures in these two subjects.
Classic and Modified Forward Masking Paradigm for ECAP Recordings
Figure 1 shows a schematic illustration of a combination of two paradigms used in this study for ECAP recordings (Brown et al., 1990; Hay-McCutcheon et al., 2005; Hughes et al., 2012, 2014; Miller et al., 2000). The left side of Figure 1 illustrates a portion of the classic two-pulse forward masking paradigm. In this paradigm, two successive pulses are presented with a relatively short inter-pulse interval (Brown et al., 1990). When presented sequentially, the response to the higher-level first pulse (the masker) is assumed to leave the nerve in a refractory state such that it is unable to generate a response to the second pulse (the probe). The masker-probe interval (MPI) shown in this paradigm is 400 μs. By recording responses to the probe alone (A1), the masker+probe (B1), and the masker alone (C1), both the stimulus artifact to the probe alone (B1−C1) and the neural response to the probe alone (A1−(B1−C1)) can be derived [N.B. necessary control conditions for power-up artifact are not shown]. In this study, the ECAP to the first pulse in the pulse train was measured using this two-pulse forward masking paradigm with a MPI of 400 μs. The masker pulse was presented at 10 CLs higher than that of the probe pulse in this paradigm.
Figure 1.

Simplified schematic of the ECAP derivation method showing both stimulus pulses (straight lines) and neural responses (curved lines). Response to Pulse1=A1−(B1−C1); Response to Pulse n=(Bn−Cn)−(B1−C1), where n=3–33.
To derive ECAPs to each of the other pulses in a pulse train, a modification of the forward-masking technique was used, as described by Hay-McCutcheon et al. (2005) and Hughes et al. (2012, 2014), and shown schematically on the right side of Figure 1. In this paradigm, the MPI was adjusted to correspond to the period of the pulse rate minus the duration of one biphasic pulse. For example, if the pulse rate was 900 pps (period = 1111 μs) and the pulse duration was 57 μs, the MPI was 1054 μs. With this increased MPI duration, coupled with the constant level pulses, some neural response was expected to be evoked by each successive pulse (i.e., refractoriness is incomplete). In an iterative process, the number of pulses comprising the masker was increased by one, with the final pulse in the pulse train always designated as the probe. For each iteration, the response to the final probe pulse was derived as (Bn-Cn)-(B1−C1), where n = 3–33, as shown on the right side of Figure 1. The ECAP evoked by the second pulse of the pulse train was not measured due to a set-up oversight. Therefore, a total of 32 ECAP responses were measured for the 33-pulse train presented to each stimulating electrode at each pulse rate. This technique was implemented using the four most common stimulation rates in clinical practice: 500, 900, 1800, and 2400 pps per channel. Due to differences in pulse rate, pulse-train durations ranged from 13.43 ms to 64.12 ms as pulse rate decreased from 2400 pps to 500 pps. The pulse train was presented at the level determined to be the C level using behavioral measures at 2400 pps. The probe repetition rate was 15 Hz. The recording electrode, sampling delay, and amplification gain were adjusted for individual patients in order to obtain an ECAP with an optimized morphology. The recording electrode was typically located two electrodes away in the apical direction from the stimulating electrode. The sampling delay was typically between 98 to 142 μs, and the amplifier gain was either 40 or 50 dB. The number of sweeps for the averaged ECAP response was typically 50–100. ECAP measures were conducted for one apical, one middle-array and one basal electrode for all subjects. Therefore, ECAPs were measured in 12 stimulation conditions (three electrode locations x four pulse rates). The sequence of stimulation conditions was randomized in order to minimize effects of long-term adaptation on results of this study. Stimulating electrodes used for individual subjects are listed in Table 1.
Data Analysis
Analysis of pulse trains
An ECAP recorded from within the cochlea is characterized by a negative peak (N1) followed by a positive peak (P2) (Abbas et al., 1999). ECAPs were analyzed using a custom program written in Matlab (Mathworks Inc.). This program performed the pulse-train subtraction technique as described above (Figure 1), automatically picked N1 and P2 peaks of derived ECAPs, measured the latency of these two peaks, and calculated the peak-to-peak amplitudes and response width. The width of the ECAP was measured as the difference in μs between latencies measured for N1 and P2 peaks. The amplitude of the ECAP was measured as the difference in μV between N1 and P2. ECAP amplitudes were normalized to the amplitude of the ECAP in response to the first pulse in the pulse train. The amount of neural adaptation at each stimulation rate was quantified using the adaptation index that was defined as the averaged normalized amplitudes of ECAPs evoked by the last six pulses in the pulse train. The smaller adaptation index indicates a greater amount of neural adaptation. The degree of alternation was quantified by calculating averaged differences in normalized amplitude between odd and even numbered pulses of the last six pulses in the pulse train. This variable was defined as the alternating depth in this study.
Due to differences in duration of stimulation, these dependent variables were also quantified for a group of six ECAPs that occurred within approximately the same time window at different pulse rates. Specifically, time windows for these six pulses were 6.12–12.12 ms at 500 pps, 9.01–14.57ms at 900 pps, 10.71–13.49 at 1800 pps, and 11.35–13.43 at 2400 pps. All four time windows centered around 11–12 ms. Dependent variables measured in this manner were referred to fixed time measures.
For each subject, normalized ECAP amplitudes were plotted as a function of time for each pulse rate and electrode position. Figure 2 shows an example of data analysis used for ECAPs recorded at the pulse rate of 900 pps for the middle-array electrode in one ANSD subject (A8). Panel (a) shows ECAP traces elicited by individual pulses within the pulse train. For clarity, the displayed trace is limited to sequences of five ECAPs extracted from three different time points within the full response to the 33-pulse train; each ECAP is truncated to a 1-ms window, and baselines of these responses were adjusted in order to line up ECAPs evoked by all pulses shown in this Figure. Panel (b) shows normalized ECAP amplitude plotted as a function of time (in ms). These ECAP responses consist of a negative peak at about 0.3 ms after stimulus onset followed by a positive peak with a latency of 0.6 ms, which is consistent with the morphology of ECAP responses reported in the literature (e.g. Abbas et al., 1999). Results recorded in this subject show ECAP response patterns that were consistent with those described in previous studies (e.g. Hay-McCutcheon et al., 2005; Hughes et al., 2012). For this subject, the amplitude of the first ECAP was the largest. ECAP amplitudes rapidly decreased within the first 2.5 ms of stimulation and subsequently decreased more gradually up to 35.7 ms. This gradual decline also exhibited an alternating pattern. This type of ECAP response pattern is referred to as the decreasing neural response pattern in this study. The averaged N1 and P2 latency, amplitude and response width of the last six ECAPs are indicated in panel (a). The adaptation index and alternating depth measured based on the last six ECAPs are indicated in panel (b).
Figure 2.

Exemplary results recorded at electrode 12 at 900 pps in one subject with ANSD (A8). Exemplary ECAP traces and normalized ECAP amplitudes plotted as a function of time are shown in panel (a) and panel (b), respectively. Also shown are averaged peak latency, amplitude and response width of the last six ECAP responses, as well as the adaptation index and the alternating depth.
In addition to the more typical decreasing neural response pattern, a new ECAP response pattern was observed in this study. Figure 3 shows examples of normalized ECAP amplitude functions measured in the left ear of one subject with ANSD (A19) and one subject with SNHL (S2). These results were measured at 900 pps for the middle-array electrode in both subjects. Similar to results shown in Figure 2, panel (a) and panel (b) of Figure 3 show ECAP traces evoked by individual pulses within the pulse train and normalized ECAP amplitude plotted as a function of time (in ms), respectively. Results measured in S2 are shown in the upper panels and results recorded in A19 are shown in the lower panels.
Figure 3.

Exemplary ECAP responses [panel (a)] and normalized ECAP amplitude plotted as a function of time [panel (b)] for one subject with SNHL (S2, the upper panels) and one subject with ANSD (A19, the lower panels). For both subjects, these results were recorded at the middle-array electrode and a pulse rate of 900 pps in the left ear. Slopes of linear regression function fitting to these results are indicated in each panel.
Traces recorded in the left ear of S2 [upper panel of panel (a)] show the typical morphology of the ECAP response. Specifically, these responses consist of a robust N1 with a latency of around 0.3 ms and a well-defined P2 peak at around 0.7 ms. Inspection of Figure 3 suggests that ECAPs evoked by pulses occurring later in the pulse train show slightly larger amplitudes than those evoked by earlier pulses after the initial decrease. For this subject, the normalized ECAP amplitude function [upper panel of panel (b)] demonstrates an initial decline within the first 5 ms of the recording window and subsequently shows a gradual increment for the rest of the stimulation time. This amplitude increment was best characterized by a linear regression function. The slope of the linear regression function measured in this subject is indicated in upper panel of panel (b) and is significantly larger than zero (p<0.05), which suggests that ECAP amplitudes increase over the time course of stimulation after the initial declination. This neural response pattern is referred to as the increasing neural response pattern in this study.
In comparison, ECAPs measured in the left ear of A19 [lower panel of panel (a)] show varied morphology. Although traces evoked by the first 23 pulses of the pulse train show signs of ECAP responses, morphologies of these neural responses become less well defined as the probe pulse occurs later in the pulse train. In addition, traces evoked by the last ten pulses follow cumulative exponential distributions, which suggest that these traces are contaminated by stimulus artifact. For this subject, the normalized ECAP amplitude does not show any decrement in amplitude except for the response evoked by the 16th pulse of the pulse train. In general, these normalized ECAP amplitudes show a relatively quick increment with a steep slope of 42.4/second during the stimulation process. These results led to concerns that the increment in the normalized ECAP amplitude in this subject may be due to the stimulus artifact contamination instead of true increment in neural responses.
Measuring changes in stimulus artifact across stimulus conditions
Results recorded in A19L, as shown in Figure 3, indicate that stimulus artifact contamination can be a potential issue for the modified forward masking paradigm. Therefore, it is critical to determine whether these derived ECAP responses measured for individual subjects were affected by stimulus artifacts.
The stimulus artifact in the ECAP measure decays exponentially and it is typically several orders of magnitude larger than the associated ECAP response. In the modified forward masking paradigm, the ECAP evoked by the nth pulse of the pulse train is derived by the subtraction, i.e., (Bn−Cn)−(B1−C1), as illustrated in Figure 1. The calculation of B1-C1 derives the stimulus artifact evoked by the first pulse of the pulse train. The basic assumption of this method is that stimulus artifact evoked by the probe pulse will always be the same regardless of the location of the probe pulse within the pulse train. However, this assumption may not be valid in all testing conditions. In order to determine whether derived ECAPs were affected by a systematic change in stimulus artifact over the course of stimulation for individual subjects, differences between Bn−Cn−(B3−C3) were calculated for each stimulation rate and electrode for each subject, where n=6, 12, 18, 24 and 30. In theory, the calculation of B3−C3 consists of the stimulus artifact and the ECAP evoked by the 3rd pulse of the pulse train. The calculation of the Bn-Cn contains the stimulus artifact and the ECAP evoked by the nth pulse of the pulse train. If the stimulus artifact stays the same during the entire stimulation process, the subtraction of Bn−Cn−(B3−C3) will result in the difference in ECAP responses evoked by the nth and the 3rd pulse. As a result, the resulting trace will have a biphasic morphology. It should consist of a N1 followed by a P2 or show a reversed polarity depending on whether the ECAP evoked by the nth pulse is larger or smaller than that evoked by the 3rd pulse. In conditions where the stimulus artifact changes systematically over time, these calculations will result in traces containing differences in artifact and/or ECAP responses evoked by the nth and the 3rd pulse of the pulse train. Theoretically, the stimulus artifact can either systematically decrease or increase during the stimulation process. In cases where the stimulus artifact is significantly larger than the ECAP and shows systematic decreases, results of Bn−Cn−(B3−C3) will follow cumulative exponential distributions. In contrast, results of Bn−Cn−(B3−C3) will follow decaying exponential distributions if the stimulus artifact systematically increases over time. The subtracted results will follow exponential distributions and show signs of the ECAP in addition to the residual artifact when magnitudes of these two components are comparable. It should be noted that this method is not probe-pulse specific. We chose to use traces evoked the 3rd pulse and the nth pulse (n=6, 12, 18, 24 and 30) in the subtraction for the purpose of illustration. Traces evoked by other probe pulses can also be used in this subtraction as long as there is a sufficient difference in time between these probe pulses.
Evaluation of stimulus artifact in individual cases
Figure 4 shows exemplary Bn-Cn traces and resulting traces after the subtraction for the same examples as those shown in Figures 2 and 3. The upper, middle and lower panels show results measured in A8, S2 and A19, respectively. For S2 and A19, these results were measured in their left ears. Subject and electrode number and the pulse rate used in these testing conditions are labeled for each graph. Panel (a) and panel (b) of Figure 4 show differences in traces recorded in buffers Bn and Cn and results of Bn−Cn−(B3−C3), respectively, where n = 6, 12, 18, 24, and 30.
Figure 4.
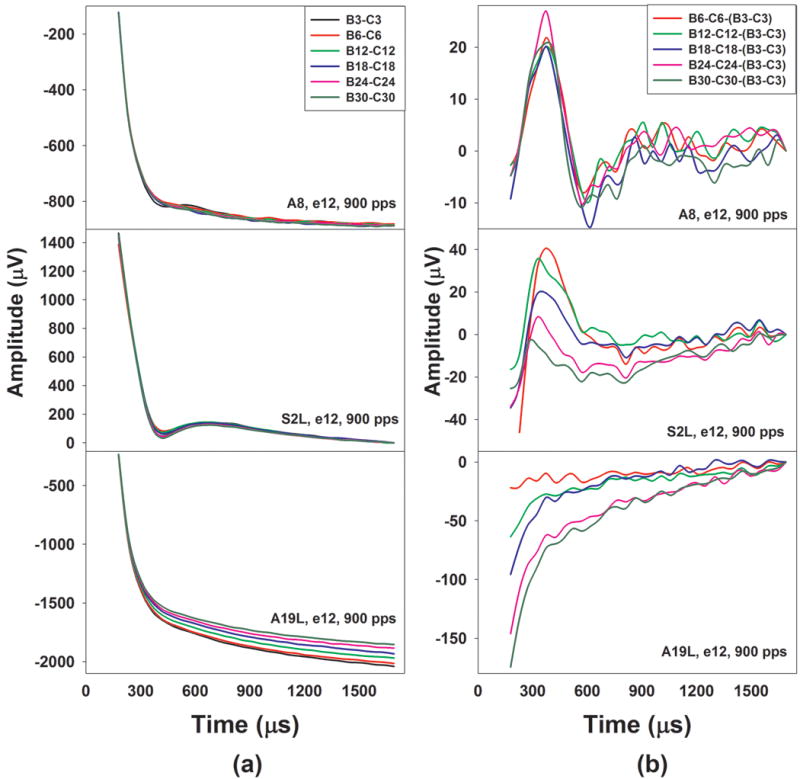
Results of Bn-Cn and Bn-Cn- (B3−C3) recorded at the middle-array electrode and a pulse rate of 900 pps in the left ear of A8, S2 and A19, where n= 3, 6, 12, 18, 24 and 30. Traces evoked by probe pulse occurring at different locations of the pulse train are indicated using different colors.
In general, differences in traces recorded in Bn and Cn buffers in all three subjects, as shown in panel (a), follow decaying exponential distributions. It is apparent that these Bn-Cn traces are dominated by stimulus artifacts. Traces recorded in S2L contain neural responses within the time window between 300 and 750 μs. Traces measured in A8 also show signs of the ECAP although these neural responses are less robust than those measured in A8. No neural response can be identified in traces measured in A19L. In addition, stimulus artifacts recorded in A19L appear to decrease over time in terms of pulse occurrence (i.e. pulse number).
Results of Bn−Cn−(B3−C3) measured in these three subjects, as shown in panel (b), show different morphologies and patterns. For A8 and S2L, these traces demonstrate a biphasic response pattern, which suggested that they are primarily dominated by neural responses. For both subjects, the ECAP evoked by the 3rd pulse is larger than those evoked by other pulses used in the subtraction. Therefore, the subtracted results consist of a positive peak occurring between 300 and 400 μs followed by a trough with a latency of 750 μs or shorter, which is a reversal of morphological polarity of the ECAP. For A8, these resulting traces do not show a systematic change in in peak-to-trough amplitude over time. In contrast, traces measured in S2L show decreased peak-to-trough amplitude with increased stimulation time, which suggests the difference between the ECAPs evoked by the nth pulse and the 3rd pulse decreased as the n increased. These results indicate that the neural response measured in S2L increased over time. Based on these results, it was determined that the effects of stimulus artifact on these results are negligible for A8 and S2L and the increasing response pattern observed in S2L is truly caused by increased ECAP amplitude over stimulation time.
For A19L, results of Bn−Cn−(B3−C3), as shown in the lower panel of panel (b) in Figure 4, follow cumulative exponential distributions, which are due to the fact that the stimulus artifact decreases over time. These traces show no evidence of any identifiable neural response. These results suggest that the stimulus artifact systematically decreased over the stimulation process in these ECAP measures. Therefore, the underlying assumption for the calculation used to derive ECAP responses in the modified forward masking paradigm is invalid in this case. It results in contamination of stimulus artifacts in derived ECAP responses. Overall, results measured for seven electrodes in four ears with ANSD and five electrodes in three ears with SNHL showed the same pattern as those observed in A19L. Such data were subsequently excluded from the data analysis. The underlying mechanism for the systematic decrease in the stimulus artifact over time is still unclear and is currently under investigation.
Results of Bn−Cn− (B3−C3) measured for five electrodes in five ears with ANSD and four electrodes in three ears with SNHL show evidence of stimulus artifact contamination in addition to signs of ECAP responses. It is impossible to separate the effects of these two factors in the normalized ECAP amplitude function due to limited testing paradigms used in this study. Therefore, these results were also excluded from data analysis.
Based on results of Bn−Cn−(B3−C3), it was determined that the true increasing neural response pattern was observed for 11 stimulation electrodes in nine subjects (six subjects with ANSD and three subjects with SNHL). For these subjects, the increasing neural response pattern was best characterized by a linear regression function. Slopes of the linear regression function were used to quantify the rate of increment in these increasing neural response patterns.
Results of previous studies have shown that the stochastic state of the auditory nerve occurs at a stimulating rate higher than 2400 pps in many subjects (e.g. Hughes et al., 2012). As a result, the stochastic rate was not evaluated as a dependent variable in this study. In general, neural response patterns measured in the two ears of the same subject did not show any obvious correlation. Therefore, they were treated as independent observations.
Comparisons among subject groups
Dependent variables evaluated in this study include ECAP amplitudes, N1 and P2 latencies, ECAP response widths, the alternating depth and the adaptation index quantified for the last six ECAP responses in the pulse train or the sequence of six consecutive ECAPs that occurred within a fixed time window. Potential effects of age at implantation and age at testing on these dependent variables were evaluated using Spearman Rank correlation tests for each electrode and each pulse rate for each subject group. Generalized Linear Mixed Models (GLMMs) with subject group, electrode location and pulse rate as the fixed effects were used to compare these dependent variables measured across groups. Compared with the Generalized Linear Model for repeated measures, the GLMM can robustly handle missing data and does not depend on the assumption that the missing data are completely random. In addition, the GLMM allows comparisons between datasets with different distributions (McCulloch & Neuhaus, 2005). Therefore, it is the most appropriate statistical analysis test for this study.
RESULTS
ECAPs measured using the classic two-pulse forward masking paradigm were recorded for all stimulating electrodes in all subjects tested in this study. Results of Spearman Correlation tests revealed no association of age at implantation or age at testing with any dependent variables tested in this study for either subject group (p>0.05).
Subjects with ANSD and Subjects with SNHL
Means, standard deviations, and results of GLMM for all dependent variables quantified using both analysis methods are listed in supplemental Appendix Tables A1–A6. These results show that measurements for the last six ECAPs were consistent with measurements for the six ECAPs that occurred at a fixed time interval for three dependent variables: the ECAP amplitude, the P2 latency and the response width. For these three variables, only results measured for the last six ECAP responses are presented. Differences in results measured using these two methods were observed for the adaptation index, the N1 latency, and the alternating depth. For these three dependent variables, results for the last six ECAP responses are reported first, followed by results for the six ECAPs at the fixed time.
Figure 5 shows the mean and standard deviation of all dependent variables measured for the last six ECAPs in children with ANSD (black bars) and children with SNHL (grey bars) at each pulse rate for each electrode location. Results quantified based on the six ECAPs that occurred at a fixed time interval are shown in supplemental Appendix Figure A1. These data showed substantial variation in these dependent variables across subjects, electrode locations and pulse rates, which is consistent with those measured for the six consecutive ECAPs that occurred at the fixed time.
Figure 5.
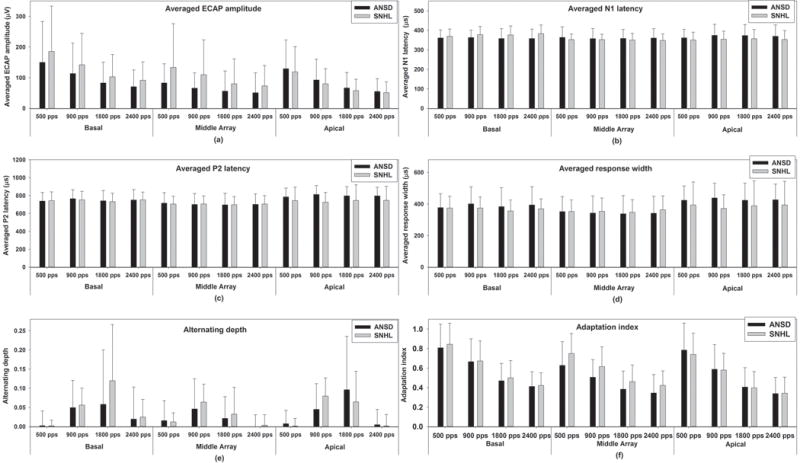
Group averages and standard errors of all dependent variables measured for the last six ECAPs for each electrode location at each pulse rate in children with ANSD and children with SNHL. Black bars indicate results measured in children with ANSD and gray bars indicate results recorded in children with SNHL. Each panel shows results measured for each dependent variable.
Averaged ECAP amplitude
The means and the standard deviations measured for each electrode at each pulse rate are shown in panel (a) of Figure 5. Results of the GLMM showed that averaged ECAP amplitudes measured in children with ANSD were significantly smaller than that measured in children with SNHL (F1, 361 = 6.31, p<0.05). There was a significant interaction between effects of electrode location and subject group (F2,322.05 = 4.79, p <0.05). Results of pairwise comparisons with Bonferroni correction showed differences in the averaged amplitude in these two groups were only recorded for the middle-array electrode (p<0.05). Averaged ECAP amplitudes were also affected by both the electrode location (F2,322.04 = 9.96, p<0.05) and pulse rate (F3,277.29= 16.40, p<0.05). Results of pairwise comparisons with Bonferroni correction showed that the averaged amplitude measured for the basal electrodes was significantly larger than those measured for the middle-array and the apical electrodes (p<0.05). There were no significant differences in averaged ECAP amplitudes measured for the middle-array and the apical electrodes (p=0.96). In addition, averaged ECAP amplitudes significantly decreased as the pulse rate increased from 500 pps up to 1800 pps (p<0.05). Further increases in pulse rate showed no additional effect on the averaged ECAP amplitudes (p=0.94). No other significant effect was found.
Averaged N1 latency
The means and the standard deviations of the averaged N1 latency measured in these two groups based on the last six ECAPs for different electrodes and pulse rates are shown in the panel (b) of Figure 5. The result of the GLMM showed that the averaged N1 latency was comparable between children with ANSD and children with SNHL (F1, 552.66 = 0.59, p=0.44). The averaged N1 latency was not affected by the pulse rate (F3, 257.63 = 0.20, p=0.90) but was affected by the electrode location (F2,359.46 = 4.44, p<0.05). Results of pairwise comparisons with Bonferroni correction showed that the averaged N1 latency measured for the basal electrode was significantly longer than that measured for the middle-array electrode (p<0.05). There was no significant difference in the averaged N1 latency measured between any other electrodes (p>0.05). The interaction between effects of subject group and electrode location on the averaged N1 latency was significant (F2,359.46 = 7.58, p <0.05). Results of pairwise comparisons with Bonferroni correction showed that differences in the averaged N1 latency between these two groups were measured for the basal and the apical electrodes (p<0.05). Inspection of the panel (b) of Figure 5 suggests that the direction of this difference reverses for these two electrodes. There was no significant difference in the averaged N1 latency between these two groups for the middle-array electrode (p=0.13). No other significant effect was found.
For the N1 latency quantified for the six ECAPs at the fixed time interval, the pulse rate effect was significant (F3, 257.63 = 13.34, p<0.05). Results of pairwise comparisons with Bonferroni correction revealed that the averaged N1 latency measured at 500 pps was significantly shorter than those measured at other pulse rates (p<0.05). There was no significant difference in the N1 latency measured at any other pulse rate (p>0.05). All other aspects of the fixed time point results were consistent with those measured based on the last six ECAPs.
Averaged P2 latency
Group means and standard deviations of the averaged P2 latency of the last six ECAPs measured in children with ANSD and children with SNHL are shown in the panel (c) of Figure 5. Children with ANSD had longer averaged P2 latencies than children with SNHL (F1, 542.76 = 5.56, p<0.05). However, there was a significant interaction between subject group and electrode location (F2, 348.59 = 3.23, p<0.05). Results of pairwise comparisons with Bonferroni correction showed that differences in the averaged P2 latency were only measured for the apical electrode (p<0.05). The averaged P2 latency was affected by electrode location (F2,348.59 = 16.02, p<0.05) but not by pulse rate (F3, 257.35 = 0.14, p=0.93). Results of a pairwise comparison with Bonferroni correction showed that the averaged P2 latency recorded for the middle-array electrode was significantly shorter than those measured for the apical and the basal electrodes (p<0.05). There was no difference in the averaged P2 latency measured for the apical and the basal electrodes (p=0.11). No other significant effect was found.
Averaged response width
Panel (d) of Figure 5 shows group means and standard deviations of the averaged response width of the last six ECAPs measured in children with ANSD and children with SNHL. Results of the GLMM showed that averaged response width was significantly affected by subject group (F1, 526.61 = 4.52, p<0.05) and electrode location (F2,335.08 = 14.13, p<0.05) but was not affected by pulse rate (F3, 249.19 = 0.15, p=0.93). Children with ANSD had greater averaged response widths than children with SNHL. However, the difference in the averaged response width between these two groups was only measured for the apical electrode (p<0.05). Results of a pairwise comparison with Bonferroni correction revealed a significant difference in the averaged response width measured for different electrodes (p<0.05). The smallest response width was recorded for the middle-array electrode followed by results measured for the basal electrode. ECAPs recorded for the apical electrode had the largest response width. There was a significant interaction between effects of electrode location and subject group on the averaged response width (F2,335.08 = 3.47, p <0.05). No other interaction reached statistical significance.
Alternating depth
Group averages and standard deviations of the alternating depth of the last six ECAPs measured in these two subject groups are shown in the panel (e) of Figure 5. For both groups, the rate at which the maximum alternating depth occurred (i.e. the maximum alternating rate) more frequently was 900 and 1800 pps for all three electrodes. These data also indicate that the relationship between alternating depths measured in these two subject groups is different for different electrodes and pulse rates. Overall, results of GLMMs showed no difference in the alternating depth between children with ANSD and children with SNHL (F1,231.84= 2.13, p=0.15). Both electrode location (F2,217.53 = 9.58, p<0.05) and pulse rate (F3,257.73= 71.68, p<0.05) had significant effects on the alternating depth. Results of a pairwise comparison with Bonferroni correction showed that the alternating depth measured for the middle-array electrode was significantly smaller than those measured for the basal and the apical electrodes (p<0.05). There was no significant difference in the alternating depth measured for the basal and the apical electrodes (p=0.98). The alternating depths measured at 500 and 2400 pps were significantly smaller than those measured at 900 and 1800 pps (p<0.05). There was no significant difference in results measured at any other pulse rate (p>0.05). The interaction between effects of electrode location and pulse rate was significant (F6,224.93 = 3.14, p<0.05). Results of pairwise comparisons with Bonferroni correction showed that the alternating depths measured at 500 and 2400 pps were significantly smaller than those measured at 900 and 1800 pps for the basal and apical electrodes (p<0.05). There was no difference in the alternating depth measured at 900 and 1800 pps for these two electrodes (p>0.05). For the middle-array electrode, the alternating depth measured at 500 pps was significantly smaller than those measured at the other three pulse rates (p<0.05). There was no difference in the alternating depth measured at 900 and 1800 pps for this electrode (p=0.16). No other significant effect was found.
In comparison with results described above, the alternating depth measured for the ECAPs at the fixed time was not affected by electrode site (F2,213.53 = 0.85, p=0.43). In addition, results of pairwise comparisons with Bonferroni correction suggested that the alternating depth decreased as the pulse rate increased (p<0.05) for the six pulses that occurred at the fixed time. All other aspects of results were consistent with those measured based on the last six ECAPs.
Adaptation Index
Panel (f) of Figure 5 shows means and standard deviations of adaptation index measured based on the last six ECAPs in these two subject groups for the three electrodes and at four pulse rates. Results of GLMMs showed that children with ANSD had smaller adaptation indexes than children with SNHL (F1,523.54 = 4.23, p<0.05). The interaction between effects of electrode location and subject group on the amount of neural adaptation was statistically significant (F2,352.74= 3.69, p <0.05). Results of a pairwise comparison with Bonferroni correction showed that the difference in the amount of neural adaptation between subject groups was only significant for the middle-array electrode (p<0.05). These results suggest that auditory nerves in children with ANSD have more neural adaptation than those measured in children with SNHL for the middle-array electrode. In addition, the amount of neural adaptation was affected by both electrode location (F2,352.74 = 11.85, p<0.05) and pulse rate (F3, 296.91 = 109.36, p<0.05). Results of a pairwise comparison with Bonferroni correction showed that the amount of neural adaptation measured for the basal electrode was significantly smaller than those measured for the middle-array and the apical electrodes (p<0.05). There was no significant difference in the amount of adaptation measured for the middle-array and the apical electrodes (p=0.54). ECAP responses showed a monotonic increment in the amount of neural adaptation as the pulse rate increased from 500 to 2400 pps (p<0.05). No other significant result was found.
Compared with results measured for the last six ECAPs, the adaptation index quantified based on the six ECAPs occurring at the fixed time window was comparable between children with ANSD and children with SNHL (F1, 523.54 = 2.36, p=0.13). All other aspects of results of the adaptation index were consistent with those measured based on the last six ECAPs.
It should be pointed out that the last six ECAPs occurred approximately 52 ms, 21 ms, and 4.43 ms later than those six ECAPs at the fixed time at 500, 900 and 1800 pps, respectively. Therefore, quantifying the adaptation index based on the last six ECAPs essentially meant measuring neural adaptation after a longer duration of stimulation. Decreases in the adaptation index with increases in stimulation time (i.e. increase in the amount of neural adaptation) were compared for children with ANSD and children with SNHL using a Univariate Analysis of Variance with subject group as the between factor and electrode location and pulse rate as the within group factors. Results showed that children with ANSD showed a larger increase in the amount of neural adaptation than in children with SNHL for the same amount of increase in stimulation time (F=12.91, p<0.05). The increment in neural adaptation is affected by pulse rate (F=8.10, p<0.05) but not affected by electrode location (F=0.50, p=0.64). Results of repeated contrast showed that the increment increased as the pulse rate decreased from 1800 pps to 500 pps (p<0.05). No other significant difference was found.
Increasing Neural Response Patterns
One important, yet unexpected finding is that ECAPs recorded for one or more electrodes in six ears with ANSD and three ears with SNHL showed increasing neural response patterns. The electrode at which the increasing neural response pattern was recorded in each subject is listed in Table 1. Figure 6 shows slopes of linear regression functions measured in subjects who showed increasing neural response patterns categorized by electrode location and pulse rate. Inspection of Figure 6 suggests that the slope values demonstrate substantial inter- and intra-subject variations across electrodes. In general, the slope of the rising amplitude tended to increase as the pulse rate increased, suggesting some type of integrative process.
Figure 6.

Scatter plot for slopes of linear regression functions measured in a subgroup of nine subjects with increasing neural response patterns. Data measured in subjects with ANSD (open symbols) and subjects with SNHL (filled symbols) were combined together. Slopes measured for different subjects are indicated using different symbols.
For the majority of subjects who showed the increasing neural response pattern, the presence/absence of this pattern was independent of pulse rate. Amplitude increment in ECAPs was observed at all pulse rates tested in these subjects. However, ECAPs recorded in the left ears of A9 (A9L) and S2 (S2L) showed an increasing neural response pattern at some but not all pulse rates. Specifically, the amplitude increment only occurred at 1800 and 2400 pps in A9L, and at 900, 1800 and 2400 pps in S2L.
DISCUSSION
General Results
This study aimed to compare temporal response properties of the auditory nerve in children with ANSD and children with SNHL. We hypothesized that temporal response properties of the auditory nerve would be different between these two subject groups. ECAPs recorded in children with ANSD were expected to show smaller amplitude, longer latency, broader morphology, reduced alternation depth, and more neural adaptation than those measured in children with SNHL. All dependent variables were quantified based on either the last six ECAPs in the pulse train or a sequence of six ECAPs that occurred within a time window centered around 11–12 ms.
Regardless of differences in methods of how these dependent variables were quantified, substantial inter- and intra-subject variations across stimulating electrodes and pulse rates for all dependent variables were observed in this study, which is consistent with results of other studies (Hay-McCutcheon et al., 2005; Hughes et al., 2012; Wilson et al., 1997). These variations might indicate differences in the functional status of the neural populations that responded to the electrical stimulation. Similar to previously published results in human CI users (Hughes et al., 2012; McKay et al., 2013; Rubinstein et al., 1999; Wilson et al., 1997), normalized ECAP amplitude decreased as the pulse rate increased in the majority of the subjects tested in this study. This decrease typically demonstrated an alternating pattern due to differences in ECAP amplitude evoked by odd and even numbered pulses of the pulse train. Complex alternating patterns, including triplet and quadruplet patterns (i.e. increase and decrease in amplitude repeated every three or four responses) were also observed in this study, which is consistent with results reported in Hughes et al. (2012) and Wilson et al. (1997).
Children with ANSD and Children with SNHL
Group Differences
In general, our results showed that ECAPs measured in children with ANSD had smaller ECAP amplitude, longer P2 latency and greater response width than children with SNHL at some but not all electrode locations. Pathological insults to different cochlea locations and auditory neurons are not uniform in patients with ANSD and patients with SNHL (e.g. Amatuzzi et al., 2011; He et al., 2012; Makary et al., 2011), which might account for, at least partially, the variations in group effects on these dependent variables at different electrodes. No difference in averaged N1 latency was observed between children with ANSD and children with SNHL. Underlying mechanisms for the discrepancy between results of N1 and P2 latency measured in these two subject groups are not well understood. Accumulated delay over time in propagation of the neural potentials due to neural dyssynchrony in children with ANSD might have, at least partially, attributed to this discrepancy. Our results showed no difference in the alternating depth was observed between these two subject groups. It should be pointed out that the alternating depth was measured as the averaged difference in normalized ECAP amplitude between ECAPs evoked by the odd and even numbered pulses based on a subgroup of six ECAPs. Complex neural response patterns were observed in approximately 40% of ECAP responses recorded in children with ANSD and in around 23% of results measured in children with SNHL. Therefore, the method that was used to quantify the alternating depth might not be optimal to capture the difference that might exist in these two groups. The P2 latency has been shown to increase as pulse rate increases in acutely deafened rats (Haenggeli et al., 1998) and guinea pigs (Ramekers et al., 2015). However, our results showed that the P2 latency was not affected by pulse rate. This discrepancy could be due to species differences, but Ramekers et al. (2015) also showed that effects of pulse rate on the P2 latency decreased as the duration of the deafness increased. In this study, all subjects are pre-lingually deaf. In contrast, all animals used in these two cited studies were acutely deafened. The potential difference in the functional status of the auditory system of subjects tested in these studies might also account for the observed discrepancy in effects of pulse rate on the P2 latency.
For the results described above, the analysis of dependent variables quantified based on the last six ECAPs and the six ECAPs at the fixed time generally yielded same results and conclusions. However, using fixed versus varied time windows (i.e. the last six ECAPs) for evaluation did yield different results for the adaptation index. Using ECAPs at the fixed time window, children with ANSD showed comparable neural adaptation indexes with children with SNHL. In comparison, when the last six ECAPs were used for evaluation (i.e. after a longer duration of stimulation), children with ANSD had more neural adaptation (i.e. smaller adaptation indexes) than children with SNHL. These results highlight the importance of using long-duration of pulse trains to compare neural adaptation between patients with ANSD and patients with SNHL. The increased neural adaptation with duration of stimulation in children with ANSD might be due to multiple underlying mechanisms, including increased neural dyssynchrony with longer duration of stimulation and/or longer adaptation recovery time. Further studies are needed to delineate these underlying mechanisms.
Temporal cues, especially rapid spectral and amplitude changes or acoustic onsets, are prominently represented in the response of the auditory nerve (Delgutte and Kiang, 1984). Fast neural adaptation and rapid recovery from neural adaptation may have the important role of producing peaks in the discharge rate of the auditory nerve that serve to enhance rapid spectro-temporal changes or acoustic onsets in the speech (Delgutte, 1997). Abnormal neural adaptation patterns, excessive neural adaptation, and/or slow adaptation recovery at the auditory nerve could potentially lead to poor representation of temporal envelopes and might contribute to poor speech perception performance in CI users (Nelson and Donaldson, 2002). Slow pulse rates have been shown to be beneficial for CI outcomes in some children with ANSD (Peterson et al., 2003; Pelosi et al., 2012). Increased neural adaptation with prolonged pulse train stimulation, as observed in children with ANSD in this study, might be part of underlying mechanisms for the improved performance at slow pulse rate in this patient population. However, further studies are definitely needed to test this speculation.
Potential Confounding Factors
For both subject groups, averaged normalized ECAP amplitude decreases as pulse rate increases from 500 to 1800 pps. Results measured for the basal electrode were larger than those recorded for the middle-array and the apical electrodes. It is well known that ECAP measures are sensitive to differences in stimulation levels. It is possible that these observed differences were due to differences in stimulation levels used in these two groups and across electrode locations. In order to rule out this possibility, the GLMM was used to compare stimulation levels between subject groups and across electrode locations. Results of the GLMM showed no significant difference in stimulation level used in these two subject groups (F1,512.11 = 0.15, p=0.70). There was a significant difference in stimulation level used at different electrode locations (F2, 428.03 =105.19, p<0.05). A pairwise comparison with Bonferroni correction showed that stimulation level used for the apical electrode was significantly lower than those used for the basal and the middle-array electrodes (p<0.05). There was no significant difference in stimulation levels used between the basal and the middle-array electrodes (p=0.11). Therefore, these results suggested that it is unlikely that these observed differences in ECAP amplitude are due to variations in stimulation level used in this study.
In this study, amplitudes of ECAPs evoked by pulses 3–33 were normalized to the amplitude of the ECAP evoked by first pulse of the pulse train. The averaged normalized amplitude of the last six ECAPs in the pulse train or a sequence of six ECAPs that occurred within a time window centered around 11–12 ms was used for group comparisons. Consequently, the amplitude of the first ECAP is another factor that might affect results of ECAP amplitude comparisons between two groups. However, results of the GLMM revealed no significant difference in the first ECAP amplitude between children with ANSD and children with SNHL (F1, 546.46 = 2.51, p=0.11). Therefore, it is unlikely the group difference in the averaged ECAP amplitude is caused by the normalization procedure used in this study.
Increased Neural Response Patterns
A new, yet unexpected finding of this study is that ECAPs measured in a subgroup of six ears with ANSD and three ears with SNHL demonstrated increased amplitudes over the entire course of stimulation after the initial declination. The electrode location(s) showing this pattern of increasing amplitudes varied across subjects. In addition, the amount and slope of amplitude increment of ECAPs also varied across subject, electrode location and pulse rate. At this time point, underlying mechanisms for this increasing neural response pattern remain unknown. It is not likely caused by the pathological insult of ANSD to the auditory system since it is also observed in subjects with SNHL.
We speculate two potential mechanisms for this newly reported neural response pattern. Both mechanisms can be attributed to the same underlying pathology: demyelination of auditory nerves. Demyelination of neural fibers has been proposed as one possible underlying pathophysiology in subjects with ANSD (e.g. Starr et al., 1996 e.g. Starr et al., 2001). In addition, animal studies have shown that demyelination of the peripheral dendrites, the cell soma and the central axon of auditory nerve neurons are observed in deafened animals with SNHL (Leake and Hradek, 1988).
One possible mechanism might be due to spread of excitation across demyelinated auditory nerve fibers in hearing-impaired listeners. It is well known that demyelination reduces electrical insulation around nerve fibers, which may cause axons to be hyperexcitable and/or lead to abnormal cross talk among adjacent demyelinated nerve fibers (Baker and Bostock, 1992; Reutskiy et al., 2003). As a result, it is possible that more neurons are recruited with successive pulses in the pulse train. Variations in the patterns of increasing neural response observed across subjects and electrode locations could be caused by different degrees of demyelination and differences in site of lesion.
Another possible mechanism responsible for increasing neural response patterns might be altered cell membrane properties caused by demyelination. It has been shown that the neural-firing probability increases over time due to temporal integration of electrical current at the neural membrane of the auditory nerve (Abbas et al., 2009; Cartee et al., 2000, 2006; Cohen, 2009; Dynes, 1995; Finley et al., 1997; Heffer et al., 2010; Miller et al., 2001; Stypulkowski and van den Honert, 1984). This phenomenon has been variously referred to as conditioning (Abbas et al., 2009), summation (Cartee et al., 2000, 2006), facilitation (Cohen 2009; Heffer et al., 2010), or integration (Finley et al., 1997; Stypulkowski and van den Honert, 1984). Wilson et al. (1997) observed the conditioning effect in ECAPs in response to a pulse train with constant amplitude in human subjects. They also found that this effect became more robust as the pulse rate increased, which is consistent with results demonstrated in this study. Estimates of the time window of temporal integration vary from about 300–400 μs (Cartee et al., 2000, Stypulkowski and van den Honert, 1984) to 500–1000 μs (Dynes, 1995; Finley et al., 1997). Demyelinated auditory nerves can potentially have longer temporal integration windows (Cartee et al., 2006; Stypulkowski and van den Honert, 1984), which may contribute to the ECAP amplitude increment observed in this study.
It should be noted that it is beyond the scope of this study to delineate pathological mechanisms for individual subjects. Further studies investigating underlying mechanisms and clinical relevance of the increasing neural response pattern observed in this study are warranted.
Stimulus Artifact for the Modified Forward Masking Paradigm
Successful removal of stimulus artifacts from ECAPs measured using the modified forward masking paradigm depends on a constant stimulus-artifact-template evoked by the probe pulse. Unfortunately, in many cases, this template varies depending on the relative location of the probe pulse in the pulse train. Therefore, it is critical to evaluate the potential contamination of residual artifacts in any studies using the modified forward masking paradigm for ECAP measures. The subtracting method used in this study [i.e. Bn−Cn−(B3−C3)] can be used as an initial way to identify potential artifact contaminations for derived ECAP responses. However, it cannot provide any information regarding the source of the artifact or be used to remove any residual artifacts. We are currently investigating possible mechanisms for changes in stimulus artifact over time and potential solutions for this issue. Results of these investigations will be published in a future study.
Study Limitations
There are several limitations of this study. First, the pulse train consisted of a fixed number of pulses (i.e. 33 pulses) regardless of pulse rate. As a result, the time of stimulation decreased from approximately 64.12 ms to 13.43 ms as the pulse rate increased from 500 pps to 2400 pps. Amplitude increment of ECAPs tended to be linear within the limited time window tested in this study. However, it is unknown whether this trend would persist for a long duration of stimulation. Future studies using relatively long durations of stimulation [e.g. 5 minutes as used in Clay and Brown (2007)] are warranted. Second, ECAPs were only measured at one stimulation level associated with a comfortable loudness level measured at 2400 pps. It has been suggested that stimulation level can affect the ECAP response pattern (Matsuoka et al., 2000a; Wilson et al., 1997) and the amount of the conditioning effect increases as the level of the masker pulse approaches resting threshold (Dynes, 1995). As a result, it is unknown whether these increasing neural response patterns also exist at low stimulation levels. Finally, ECAPs were measured using a cathodic-leading stimulus. It has been shown that stimulus polarity can affect ECAP response pattern in animals (Matsuoka et al., 2000a). It is unknown whether the increasing neural response pattern also exists for an anodal-leading stimulus. Therefore, the conclusions of this study should not be generalized beyond the stimulating parameters tested in this study.
CONCLUSIONS
Substantial inter- and intra-subject variations were observed in ECAP responses to pulse trains recorded across electrode locations and pulse rates in both ANSD and SNHL subject groups. Differences in some but not all aspects of temporal response properties of the auditory nerve to electrical stimulation were observed between children with ANSD and children with SNHL for some stimulating electrodes using the pulse-train stimuli. Increments in ECAP amplitudes over the course of stimulation were observed in a subset of subjects from both groups. Underlying mechanisms, or the clinical relevance, of the increasing neural response pattern remain unknown.
Supplementary Material
Figure A1. Group averages and standard errors of all dependent variables measured at electrode location and pulse rate in children with ANSD and children with SNHL for the six ECAPs occurring at the fixed time interval. Black bars indicate results measured in children with ANSD and gray bars indicate results recorded in children with SNHL. Each panel shows results measured for each dependent variable and the name of the dependent variable is labeled in each panel.
Acknowledgments
This work was supported by a grant from NIH/NIDCD (1R03DC013153). Portions of this paper were presented at the 20th World Congress of the International Federation of Oto-Rhino-Laryngological Societies, Seoul, Korea and the 8th International Symposium on Objective Measures in Auditory, Toronto, Canada. The authors thank the associated editor and two anonymous reviewers for their detailed and constructive comments for an earlier version of this manuscript. The authors thank Dr. John H. Grose for many insightful discussions and comments. The authors highly appreciate Dr. Charles Finley’s comments on the potential artifact contamination on the results of this study and many highly valuable discussions related to this particular issue. The authors would also like to thank Matthijs Killian and Joerg Pesch (Cochlear Corp.) for verifying stimulating and recording parameters used in this study and many very informative recommendations and discussions, Travis Warren for his assistances with subject recruitment and data analysis, and all subjects and their parents for participating in this study.
Footnotes
Conflicts of Interest: None
References
- Abbas PJ, Brown CJ, Shallop JK, et al. Summary of results using the nucleus CI24M implant to record the electrically evoked compound action potential. Ear Hear. 1999;20:45–59. doi: 10.1097/00003446-199902000-00005. [DOI] [PubMed] [Google Scholar]
- Abbas PJ, Etler CP, O’Brien SN, et al. Use of low level stimuli to assess channel interaction. Conference on Implantable Auditory Prostheses; Lake Tahoe, CA. 2009. [Google Scholar]
- Abbas PJ, Miller CA, Rubinstein JT, et al. The neurophysiological effects of simulated auditory prosthesis stimulation. 2001. (Eighth quarterly progress report, NIH contract N01-DC-9-2107). [Google Scholar]
- Adunka OF, Jewells V, Buchman CA. Value of computed tomography in the evaluation of children with cochlear nerve deficiency. Oto Neurotol. 2007;28:597–604. doi: 10.1097/01.mao.0000281804.36574.72. [DOI] [PubMed] [Google Scholar]
- Adunka OF, Roush PA, Teagle HF, et al. Internal auditory canal morphology in children with cochlear nerve deficiency. Otol Neurotol. 2006;27:793–801. doi: 10.1097/01.mao.0000227895.34915.94. [DOI] [PubMed] [Google Scholar]
- Amatuzzi M, Liberman MC, Northrop C. Selective inner hair cell loss in prematurity: a temporal bone study of infants from a neonatal intensive care unit. J Assoc Res Otolaryngol. 2011;12:595–604. doi: 10.1007/s10162-011-0273-4. [DOI] [PMC free article] [PubMed] [Google Scholar]
- Baker M, Bostock H. Ectopic activity in demyelinated spinal root axons of the rat. J Physiol Lond. 1992;451:539–552. doi: 10.1113/jphysiol.1992.sp019178. [DOI] [PMC free article] [PubMed] [Google Scholar]
- Bacon SP, Gleitman RM. Modulation detection in subjects with relatively flat hearing losses. J Speech Hear Res. 35:642–653. doi: 10.1044/jshr.3503.642. [DOI] [PubMed] [Google Scholar]
- Berlin CI, Hood LJ, Cecola RP, et al. Does Type I afferent neuron dysfunction reveal itself through lack of efferent suppression? Hear Res. 1993;65:40–50. doi: 10.1016/0378-5955(93)90199-b. [DOI] [PubMed] [Google Scholar]
- Brown CJ, Abbas PJ, Gantz B. Electrically evoked whole nerve action potentials: data from human cochlear implant users. J Acoust Soc Am. 1990;88:1385–1391. doi: 10.1121/1.399716. [DOI] [PubMed] [Google Scholar]
- Buchman CA, Roush PA, Teagle HFB, et al. Auditory neuropathy characteristics in children with cochlear nerve deficiency. Ear Hear. 2006;27:399–408. doi: 10.1097/01.aud.0000224100.30525.ab. [DOI] [PubMed] [Google Scholar]
- Cacace AT, Pinheiro JM. The mitochondrial connection in auditory neuropathy. Audiol Neurootol. 2011;16:398–413. doi: 10.1159/000323276. [DOI] [PubMed] [Google Scholar]
- Cartee LA. Spiral ganglion cell site of excitation II: numerical model analysis. Hear Res. 2006;215:22–30. doi: 10.1016/j.heares.2006.02.011. [DOI] [PubMed] [Google Scholar]
- Cartee LA, van den Honert C, Finley CC, et al. Evaluation of a model of the cochlear neural membrane. I. Physiological measurement of membrane characteristics in response to inrameatal electrical stimulation. Hear Res. 2000;146:143–152. doi: 10.1016/s0378-5955(00)00109-x. [DOI] [PubMed] [Google Scholar]
- Clay KM, Brown CJ. Adaptation of the electrically evoked compound action potential (ECAP) recorded from nucleus CI24 cochlear implant users. Ear Hear. 2007;28:850–861. doi: 10.1097/AUD.0b013e318157671f. [DOI] [PubMed] [Google Scholar]
- Cohen LT. Practical model description of peripheral neural excitation in cochlear implant recipients: 5. Refractory recovery and facilitation. Hear Res. 2009;248:1–14. doi: 10.1016/j.heares.2008.11.007. [DOI] [PubMed] [Google Scholar]
- Dynes SBC. Doctoral Thesis. Massachusetts Institute of Technology; 1995. Discharge characteristics of auditory nerve fibers for pulsatile electrical stimuli. [Google Scholar]
- Delgutte B. Auditory neural processing of speech. In: Hardcast WJ, Laver J, editors. The Handbook of Phonetic Sciences. Blackwell Publishers; 1997. pp. p507–p538. [Google Scholar]
- Delgutte B, Kiang NYS. Speech coding in the auditory nerve: IV. Sounds with consonant-like dynamic characteristics. J Acoust Soc Am. 75:897–907. doi: 10.1121/1.390599. [DOI] [PubMed] [Google Scholar]; Dynes SBC. Doctoral Thesis. Massachusetts Institute of Technology; 1995. Discharge characteristics of auditory nerve fibers for pulsatile electrical stimuli. [Google Scholar]
- Finley C, Wilson B, van den Honert C, et al. Speech processors for auditory prostheses. 1997. (Sixth Quarterly Progress Report, NIH, Project N01-DC-5-2103). [Google Scholar]
- Fulmer SL, Runge C, Jensen JW, et al. Rate of neural recovery in implanted children with auditory neuropathy spectrum disorder. Otolaryngol Head Neck Surg. 2011;144:274–279. doi: 10.1177/0194599810391603. [DOI] [PubMed] [Google Scholar]
- Glasberg BR, Moore BCJ, Bacon SP. Gap detection and masking in hearing-impaired and normal-hearing subjects. J Acoust Soc Am. 1987;81:1546–1556. doi: 10.1121/1.394507. [DOI] [PubMed] [Google Scholar]
- Grose JH, Hall JW, Buss E. Duration discrimination in listeners with cochlear hearing loss: effects of stimulus type and frequency. J Speech Lang Hear Res. 2004;47:5–12. doi: 10.1044/1092-4388(2004/001). [DOI] [PubMed] [Google Scholar]
- Haenggeli A, Zhang JS, Vischer MW, et al. Electrically evoked compound action potential of the cochlear nerve in response to pulsatile electrical stimulation of the cochlea in the rat: effects of stimulation at high rates. Audiology. 1998;37:353–371. doi: 10.3109/00206099809072989. [DOI] [PubMed] [Google Scholar]
- Hay-McCutcheon M, Brown CJ, Abbas PJ. An analysis of the impact of auditory-nerve adaptation on behavioral measures of temporal integration in cochlear implant recipients. J Acoust Soc Am. 2005;118:2444–2457. doi: 10.1121/1.2035593. [DOI] [PubMed] [Google Scholar]
- Hartmann R, Topp G, Klinke R. Discharge patterns of cat primary auditory fibers with electrical stimulation of the cochlea. Hear Res. 1984;13:47–62. doi: 10.1016/0378-5955(84)90094-7. [DOI] [PubMed] [Google Scholar]
- He S, Grose JH, Teagle HF, et al. Gap detection measured with electrically evoked auditory event-related potentials and speech perception abilities in children with auditory neuropathy spectrum disorder. Ear Hear. 2013;34:733–744. doi: 10.1097/AUD.0b013e3182944bb5. [DOI] [PMC free article] [PubMed] [Google Scholar]
- He S, Grose J, Hang AX, et al. Cochlear implant-evoked cortical activation in children with cochlear nerve deficiency. Otol Neurotol. 2012;33:1188–1196. doi: 10.1097/MAO.0b013e31826426d2. [DOI] [PMC free article] [PubMed] [Google Scholar]
- Heffer LF, Sly DJ, Fallon JB, et al. Examining the auditory nerve fiber response to high rate cochlear implant stimulation: chronic sensorineural hearing loss and facilitation. J Neurophy. 2010;104:3124–3135. doi: 10.1152/jn.00500.2010. [DOI] [PMC free article] [PubMed] [Google Scholar]
- Hood LJ. A review of objective methods of evaluating neural pathways. Laryngoscope. 1999;101:1745–1748. doi: 10.1097/00005537-199911000-00004. [DOI] [PubMed] [Google Scholar]
- Hughes ML, Castioni EE, Goehring JL, et al. Temporal response properties of the auditory nerve: data from human cochlear-implant recipients. Hear Res. 2012;285:46–57. doi: 10.1016/j.heares.2012.01.010. [DOI] [PMC free article] [PubMed] [Google Scholar]
- Hughes ML, Baudhuin JL, Goehring JL. The relation between auditory-nerve temporal responses and perceptual rate integration in cochlear implants. Hear Res. 2014;316:44–56. doi: 10.1016/j.heares.2014.07.007. [DOI] [PMC free article] [PubMed] [Google Scholar]
- Kim JR, Kim LS, Jeong SW, et al. Recovery function of electrically evoked compound action potential in implanted children with auditory neuropathy: preliminary results. Acta Oto-Laryngologica. 2011;131:796–801. doi: 10.3109/00016489.2011.560187. [DOI] [PubMed] [Google Scholar]
- Kiang NY, Moxon EC. Physiological considerations in artificial stimulation of the inner ear. Ann Otol Rhinol Laryngol. 1972;81:714–730. doi: 10.1177/000348947208100513. [DOI] [PubMed] [Google Scholar]
- Kraus N, Bradlow AR, Cheatham J, et al. Consequences of neural asynchrony: a case of auditory neuropathy. J Assoc Res in Otolaryngol. 2000;1:33–45. doi: 10.1007/s101620010004. [DOI] [PMC free article] [PubMed] [Google Scholar]
- Leake PA, Hradek GT. Cochlear pathology of long term neomycin induced deafness in cates. Hear Res. 1988;33:11–34. doi: 10.1016/0378-5955(88)90018-4. [DOI] [PubMed] [Google Scholar]
- Makary CA, Shin J, Kujawa SG, et al. Age-related primary cochlear neuronal degeneration in human temporal bones. J Assoc Res Otolaryngol. 2011;12:711–717. doi: 10.1007/s10162-011-0283-2. [DOI] [PMC free article] [PubMed] [Google Scholar]
- Matsuoka AJ, Abbas PJ, Rubinstein JT, et al. The neuronal response to electrical constant-amplitude pulse train stimulation: evoked compound action potential recordings. Hear Res. 2000a;149:115–128. doi: 10.1016/s0378-5955(00)00172-6. [DOI] [PubMed] [Google Scholar]
- Matsuoka AJ, Abbas PJ, Rubinstein JT, et al. The neuronal response to electrical constant-amplitude pulse train stimulation: additive Gaussian noise. Hear Res. 2000b;149:129–137. doi: 10.1016/s0378-5955(00)00173-8. [DOI] [PubMed] [Google Scholar]
- McCulloch CE, Neuhaus JM. Generalized linear mixed models. Encyclopedia of Biostatistics. 2005;4 [Google Scholar]
- McKay CM, Chandan K, Akhoun I, et al. Can ECAP measures be used for totally objective programming for cochlear implants? J Assoc Res Otolaryngol. 2013;14:879–890. doi: 10.1007/s10162-013-0417-9. [DOI] [PMC free article] [PubMed] [Google Scholar]
- McDonald WI, Sears TA. The effects of experimental demyelination on conduction in the central nervous system. Brain. 1970;93:583–598. doi: 10.1093/brain/93.3.583. [DOI] [PubMed] [Google Scholar]
- Miller CA, Abbas PJ, Brown CJ. An improved method of reducing stimulus artifact in the electrically evoked whole-nerve potential. Ear Hear. 2000;21:280–290. doi: 10.1097/00003446-200008000-00003. [DOI] [PubMed] [Google Scholar]
- Miller CA, Hu N, Zhang F, et al. Changes across time in the temporal responses of auditory nerve fibers stimulated by electric pulse trains. J Assoc Res Otolaryngol. 2008;9:122–137. doi: 10.1007/s10162-007-0108-5. [DOI] [PMC free article] [PubMed] [Google Scholar]
- Mino H, Rubinstein JT. Effects of neural refractoriness on spatio-temporal variability in spike initiations with electrical stimulation. IEEE Trans. Neural Syst Rehabil Eng. 2006;14:273–280. doi: 10.1109/TNSRE.2006.881590. [DOI] [PubMed] [Google Scholar]
- Moore BCJ, Glasberg BR, Donaldsom E, et al. Detection of temporal gaps in sinusoids by normally hearing and hearing-impaired subjects. J Acoust Soc Am. 1989;85:1266–1275. doi: 10.1121/1.397457. [DOI] [PubMed] [Google Scholar]
- Nelson DA, Donaldson GS. Psychophysical recovery from pulse-train forward masking in electrical hearing. J Acoust Soc Am. 2002;112:2932–2947. doi: 10.1121/1.1514935. [DOI] [PubMed] [Google Scholar]
- Peterson A, Shallop J, Driscoll C, et al. Outcomes of cochlear implantation in children with auditory neuropathy. J Am Acad Audiol. 2003;14:188–201. [PubMed] [Google Scholar]
- Pelosi S, Rivas A, Haynes DS, et al. Stimulation rate reduction and auditory development in poorly performing cochlear implant users with auditory neuropathy. Otol Neurotol. 2012;33:1502–1506. doi: 10.1097/MAO.0b013e31826bec1e. [DOI] [PubMed] [Google Scholar]
- Pender MP, Sears TA. The pathophysiology of acute experimental allergic encephalomyelitis in the rabbit. Brain. 1984;101:699–726. doi: 10.1093/brain/107.3.699. [DOI] [PubMed] [Google Scholar]
- Ramekers D, Versnel H, Strahl SB, et al. Recovery characteristics of the electrically stimulated auditory nerve in deafened guinea pigs: relation to neuronal status. Hear Res. 2015;321:12–24. doi: 10.1016/j.heares.2015.01.001. [DOI] [PubMed] [Google Scholar]
- Rance G. Auditory neuropathy/dys-synchrony and its perceptual consequences. Trends Amplif. 2005;9:1–43. doi: 10.1177/108471380500900102. [DOI] [PMC free article] [PubMed] [Google Scholar]
- Rance G, Barker EJ. Speech and language outcomes in children with auditory neuropathy/dys-synchrony managed with either cochlear implants or hearing aids. Int J Audiol. 2009;48:313–320. doi: 10.1080/14992020802665959. [DOI] [PubMed] [Google Scholar]
- Rance G, Corben L, Du Bourg E, et al. Successful treatment of auditory perceptual disorder in individuals with Friedreich ataxia. Neuroscience. 2010;171:552–555. doi: 10.1016/j.neuroscience.2010.09.013. [DOI] [PubMed] [Google Scholar]
- Rance G, Corben L, Delatycki M. Auditory processing deficits in children with Friedreich ataxia. J Child Neurol. 2012b;27:1197–1203. doi: 10.1177/0883073812448963. [DOI] [PMC free article] [PubMed] [Google Scholar]
- Rance G, Chisari D, O’Hare F, et al. Auditory neuropathy in individuals with Type I diabetes. J Neurol. 2014;261:1531–1536. doi: 10.1007/s00415-014-7371-2. [DOI] [PubMed] [Google Scholar]
- Rance G, Fava R, Baldock H, et al. Speech perception ability in individuals with Friedreich ataxia. Brain. 2008;131:2002–2012. doi: 10.1093/brain/awn104. [DOI] [PubMed] [Google Scholar]
- Rance G, McKay C, Grayden D. Perceptual characterization of children with auditory neuropathy. Ear Hear. 2004;21:34–46. doi: 10.1097/01.AUD.0000111259.59690.B8. [DOI] [PubMed] [Google Scholar]
- Rance G, Ryan MM, Bayliss K, et al. Auditory function in children with Charcot-Marie-Tooth disease. Brain. 2012a;84:130–139. doi: 10.1093/brain/aws085. [DOI] [PubMed] [Google Scholar]
- Rasminsky M, Sears TA. Internodal conduction in undissected demyelinated nerve fibers. J Physiol. 1972;221:323–350. doi: 10.1113/jphysiol.1972.sp010035. [DOI] [PMC free article] [PubMed] [Google Scholar]
- Reutskiy S, Rossoni E, Tirozzi B. Conduction in bundles of demyelinated nerve fibers: computer simulation. Biol Cybern. 2003:422–430. doi: 10.1007/s00422-003-0430-x. [DOI] [PubMed] [Google Scholar]
- Rubinstein JT, Wilson BS, Finley CC, et al. Pseudospontaneous activity: stochastic independence of auditory nerve fibers with electrical stimulation. Hear Res. 1999;127:108–118. doi: 10.1016/s0378-5955(98)00185-3. [DOI] [PubMed] [Google Scholar]
- Runge CL, Erbe CB, McNally MT, et al. A novel otoferlin splice-site mutation in siblings with auditory neuropathy spectrum disorder. Audiol Neurootol. 2013;18:374–382. doi: 10.1159/000354978. [DOI] [PMC free article] [PubMed] [Google Scholar]
- Schmucker S, Puccio H. Understanding the molecular mechanisms of Friedreich’s ataxia to develop therapeutic approaches. Hum Mo Genet. 2010;19:103–110. doi: 10.1093/hmg/ddq165. [DOI] [PubMed] [Google Scholar]
- Shidara Y, Hollenback PJ. Defects in mitochondrial axonal transport and membrane potential without increased reactive oxygen species production in a Drosophila model of Friedreich ataxia. J Neurosci. 2010;30:11369–11378. doi: 10.1523/JNEUROSCI.0529-10.2010. [DOI] [PMC free article] [PubMed] [Google Scholar]
- Starr A, Michalewski HJ, Zeng FG, et al. Pathology and physiology of auditory neuropathy with a novel mutation in the MPZ gene (Tyr145->Ser) Brain. 2003;126:1604–1619. doi: 10.1093/brain/awg156. [DOI] [PubMed] [Google Scholar]
- Starr A, McPherson D, Patterson J, et al. Absence of both auditory evoked potentials and auditory percepts dependent on timing cues. Brain. 1991;111:1157–1180. doi: 10.1093/brain/114.3.1157. [DOI] [PubMed] [Google Scholar]
- Starr A, Picton TW, Sininger Y, et al. Auditory neuropathy. Brain. 1996;119:741–753. doi: 10.1093/brain/119.3.741. [DOI] [PubMed] [Google Scholar]
- Starr A, Rance G. Auditory neuropathy. Handb Clin Neurol. 2015;129:495–508. doi: 10.1016/B978-0-444-62630-1.00028-7. [DOI] [PubMed] [Google Scholar]
- Starr A, Sininger Y, Winter M, et al. Transient deafness due to temperature-sensitive auditory neuropathy. Ear Hear. 1998;19:169–179. doi: 10.1097/00003446-199806000-00001. [DOI] [PubMed] [Google Scholar]
- Stypulkowksi PH, van den Honert C. Physiological properties of the electrically stimulated auditory nerve. I. Compound action potential recordings. Hear Res. 1984;14:205–223. doi: 10.1016/0378-5955(84)90051-0. [DOI] [PubMed] [Google Scholar]
- Wilson BS, Finley CC, Lawson DT, et al. Temporal representations with cochlear implants. Am J Otol. 1997;18:S30–S34. [PubMed] [Google Scholar]
- Zeng FG, Kong YY, Michalewski HJ, et al. Perceptual consequences of disrupted auditory nerve activity. J Neurophysiol. 2005;93:3050–3063. doi: 10.1152/jn.00985.2004. [DOI] [PubMed] [Google Scholar]
- Zeng FG, Oba S, Garde S, et al. Temporal and speech processing deficits in auditory neuropathy. Neuroreport. 1999;10:3429–3435. doi: 10.1097/00001756-199911080-00031. [DOI] [PubMed] [Google Scholar]
- Zhang F, Miller CA, Robinson BK, et al. Changes across time in spike rate and spike amplitude of auditory nerve fibers stimulated by electric pulse trains. J Assoc Res Otolaryngol. 2007;8:356–372. doi: 10.1007/s10162-007-0086-7. [DOI] [PMC free article] [PubMed] [Google Scholar]
- Zhou R, Abbas PJ, Assouline JG. Electrically evoked auditory brainstem response to peripherally myelin-deficient mice. Hear Res. 1995;88:98–106. doi: 10.1016/0378-5955(95)00105-d. [DOI] [PubMed] [Google Scholar]
Associated Data
This section collects any data citations, data availability statements, or supplementary materials included in this article.
Supplementary Materials
Figure A1. Group averages and standard errors of all dependent variables measured at electrode location and pulse rate in children with ANSD and children with SNHL for the six ECAPs occurring at the fixed time interval. Black bars indicate results measured in children with ANSD and gray bars indicate results recorded in children with SNHL. Each panel shows results measured for each dependent variable and the name of the dependent variable is labeled in each panel.