

Abstract
Chronic Fatigue Syndrome (CFS) is a debilitating disease characterized by physical and mental exhaustion. The underlying pathogenesis is unknown, but impairments in certain mitochondrial functions have been found in some CFS patients. To thoroughly reveal mitochondrial deficiencies in CFS patients, here we examine the key aspects of mitochondrial function in blood cells from a paired CFS patient-control series. Surprisingly, we discover that in patients the ATP levels are higher and mitochondrial cristae are more condensed compared to their paired controls, while the mitochondrial crista length, mitochondrial size, shape, density, membrane potential, and enzymatic activities of the complexes in the electron transport chain remain intact. We further show that the increased ATP largely comes from non-mitochondrial sources. Our results indicate that the fatigue symptom in this cohort of patients is unlikely caused by lack of ATP and severe mitochondrial malfunction. On the contrary, it might be linked to a pathological mechanism by which more ATP is produced by non-mitochondrial sources.
Keywords: Chronic fatigue syndrome, mitochondria, ATP, cristae, complex activity
1. Introduction
CFS, also called Myalgic Encephalomyelitis (ME), and recently Systemic Exercise Intolerance Disease (SEID), is a medical condition characterized by long-lasting fatigue and post-exertional malaise that is not relieved by sleep or rest. The pathogenic causes of CFS are unclear and no biomarker exists. No definitive measure could diagnose CFS until the discovery of the VO2 Max test that reveals reduced performance for CFS patients on the second day of exercise1. Different sets of existing diagnostic criteria have led to a wide range of prevalence estimates2. Recent studies have placed estimates as low as 0.1%3, while others estimate that in certain regions more than 5% of the population is affected4.
The immune system has been the focus of CFS research since it was noted that symptoms often develop after contracting a viral illness, such as the Epstein-Barr virus5. While this is not the case for all patients with CFS, retroviruses have been extensively studied as a potential cause for the disease. However, the activity of a retrovirus in CFS patients is not significantly evident6,7, and immune response patterns of patients do not conclusively reflect a viral infection8.
Mitochondria have also been of interest to CFS research because of evidence showing impaired mitochondrial function in some CFS patients9–13. Using peripheral blood mononuclear cells (PBMCs), several studies have shown that their cohort of patients has reduced concentrations of ATP11,13. However, other studies have failed to detect any changes in ATP production in different cohort of CFS patients14,15.
While these studies support a potential link between mitochondria and CFS, thorough analysis of mitochondrial function in patient-control series is warranted to validate this link. In this study, we examine the following aspects of mitochondrial function in PBMCs from CFS patients and their paired controls: (1) ATP levels; (2) mitochondrial crista membrane structure; (3) the activities of the Complex I–IV in the electron transport chain (ETC); and (4) the mitochondrial membrane potential (ΔΨ). Surprisingly, we detect no severe impairments in mitochondrial function, and an increase in ATP levels in CFS patients. We propose that the fatigue symptom in this cohort of patients is unlikely to be caused by lack of ATP and mitochondrial malfunction.
2. Materials and Methods
2.1. Site Information and IRB
Five clinical sites participated in data collection: Chronic Fatigue Clinic (Miami, FL); Massachusetts General Hospital (Boston, MA); Chronic Fatigue Consultation Clinic (Salt Lake City, UT); Sierra Internal Medicine (Incline Village, NV); and Levine Clinic (New York, NY). Written informed consent was obtained from all participants. All sites received approval from their respective Institutional Review Boards for human subjects research, and all procedures complied with the approved guidelines. Samples were processed and stored at the CFI Biobank at Duke University (Durham, NC). Data were de-identified such that they contained no Protected Health Information (PHI).
2.2. Matching
Patients and controls were frequency matched on the basis of geographic location (<100 mile radius of the study site from which the case was enrolled), sex, age (± 5 years), and race/ethnicity using the following categories: Asian, white, black, Hispanic, and Pacific Islander. In addition, blood from the control subject was drawn within 12 weeks of the matched CFS case.
2.3. Cell Culture for Measuring ATP Levels and Complex Activities
PBMCs were thawed in a water bath at 37 °C and added drop-wise to a tube of 8.5 ml Dulbecco’s Modified Eagle’s Medium (DMEM, Hyclone). Cells were then centrifuged and supernatant was removed, leaving behind a pellet of cells that was resuspended in 5 ml DMEM. Suspended PBMCs were cultured for 60 hrs in a 37 °C incubator with 5% CO2, and then the cell number was counted using the TC 20 Automated Cell Counter (Bio-Rad Laboratories). Preparation for measuring ATP levels and complex activities was as described in16. Briefly, cells were transferred into a 5 ml tube where they were pelleted at 1000 g for 5 min and resuspended in 1 ml suspension buffer (150 mM KCl, 25 mM Tris-HCl, 2 mM EDTA, 0.1% BSA, 10 mM potassium phosphate, 0.1 mM MgCl, pH 7.4). 10 μl digitonin (500 ug/ml) was added into the tube, mixed gently by inversion for 1 min. Cells were then centrifuged at 1000 g for 3 min, and supernatant was removed and replaced with 50 μl suspension buffer.
For oligomycin treatment, 2 ml of PBMCs in culture were treated with oligomycin at a concentration of 2.5 μM for 1 hr. Media was gently shaken to equally distribute oligomycin to all cells.
2.4. Assay to Measure ATP Levels
A standard reaction solution was prepared as follows: 8.9 ml dH2O, 0.5 ml 20× Reaction Buffer (Molecular Probes, A22066 Component E), 0.1 ml 0.1 M DTT, 0.5 ml 10 mM D-luciferin (Molecular Probes, A22066 Component A), and 2.5 μl 5 mg/mL firefly luciferase (Molecular Probes, A22066 Component B). ATP level standards were made by diluting 5 mM ATP (Molecular Probes, A22066 Component D) in dH2O to concentrations of 1 nM to 1 μM. A blank reading was taken by placing 100 μl of standard reaction solution in a luminometer (Glomax Multi Jr. Detection System, Promega) and measuring luminescence in triplicate. 10 μl of cell sample was then added to 100 μl standard reaction solution, and the luminescence assay was repeated in duplicate.
A standard curve was generated using the ATP standard solutions. This standard curve was used to measure the ATP concentrations in cell samples, which was then normalized by the cell count.
2.5. Assay to Measure the Complex I Activity
182 μl Complex I Activity Assay Buffer (Cayman Chemicals, Item No. 700931), 4 μl 100 mM potassium cyanide (Fisher Scientific), and 10 μl Fatty Acid Free BSA Assay Reagent (Cayman Chemicals, Item No. 700933) were added to 50 μl suspended cell samples. 50 μl of this solution was pipetted into wells of a 96-well plate and 20 μl of pure ethanol was added. To start the reaction, 27.8 μl of Complex I Activity Assay Buffer, 1.3 μl of NADH Assay Reagent (Cayman Chemicals, Item No. 700932), and 0.9 μl of Ubiquinone Assay Reagent (Cayman Chemcicals, Item No. 700018) were simultaneously pipetted into each well. With a total well volume of 100 μl, the 96-well plates were read at 340 nm absorbance for 15 min with 30 sec intervals to measure the decrease of absorbance of NADH, which represents the complex I activity. Downward slope of kinetic data was calculated using StatPlus v5 (AnalystSoft, Inc.).
2.6. Assay to Measure the Complex II–III Activity
191.6 μl Complex III Activity Assay Buffer (Cayman Chemicals, Item No. 700951), 4 μl 100 mM potassium cyanide (Fisher Scientific), and 2 μl 1 mM rotenone (Sigma-Aldrich) were added to 50 μl suspended cell samples. 50 μl of this solution was pipetted into wells of a 96-well plate and 20 μl of ethanol was added. To start the reaction, 27 μl of Complex III Activity Assay Buffer, 0.4 μl of Succinate Assay Reagent (Cayman Chemicals, Item No. 700021), and 2.6 μl of Cytochrome c Assay Reagent (Cayman Chemcicals, Item No. 700952) were simultaneously pipetted into each well. With a total well volume of 100 μl, the 96-well plates were read at 550 nm absorbance for 15 min with 30 sec intervals to measure the increase of absorbance of cytochrome c, which represents the complex II–III activity. Upward slope of kinetic data was calculated using StatPlus v5 (AnalystSoft, Inc.).
2.7. Assay to Measure the Complex IV Activity
99.5 μl Complex IV Activity Assay Buffer (Cayman Chemicals, Item No. 700991) was added to 5 μl suspended cell samples. 50 μl of these samples was pipetted into wells of a 96-well plate, and 20 μl of sodium hydroxide was added. To start the reaction, 27.3 μl of Complex IV Activity Assay and 2.7 μl of Reduced Cytochrome c Assay Reagent (Cayman Chemcicals, Item No. 700992) were simultaneously pipetted into each well. With a total well volume of 100 μl, the 96-well plates were read at 550 nm absorbance for 15 min with 30 sec intervals to measure the decrease of absorbance of cytochrome c, which represents the complex IV activity. Downward slope of kinetic data was calculated using StatPlus v5 (AnalystSoft, Inc.).
2.8. Flow Cytometry
Washed cells were transferred to a 25 ml flask where they were incubated for 18 hrs in a 37 °C incubator with 5% CO2. Cells were then treated with 2 μM of 5,5′,6,6′-tetrachloro-1,1′,3,3′-tetraethylbenzimidazolylcarbocyanine iodide (JC-1, Life Technologies). The flask was gently shaken to mix, and incubated for 30 min at 37 °C. Cells were then centrifuged, and supernatant was removed to remove JC-1.
Pellet was resuspended in 100 μl of FACS buffer (phosphate buffered saline with 1:100 bovine serum albumin, Fisher Scientific) mixed with 1:1000 LIVE/DEAD® Fixable Aqua dye (Life Technologies). The Aqua-treated sample was incubated at 4 °C for 15 min.
Cells were then centrifuged one last time and supernatant was removed. Pellet was resuspended in 100 μl of FACS buffer, and kept at 4 °C until data acquisition by flow cytometry.
Samples were analyzed by flow cytometry using an LSR II machine (BD Biosciences). Acquisition rate was set to 6,000 events per second, with a total of 200,000 events collected per sample. Patient and control samples were all assessed for: FSC-A (forward scatter light, area), FSC-W (forward scatter light, width), FSC-H (forward scatter light, height), SSC-A (side scatter light, area), SSC-W (side scatter light, width), SSC-H (side scatter light, height), green j-monomer fluorescence (530 nm detection), Aqua-amine fluorescence (500 nm detection), and red j-aggregate fluorescence (580 nm detection). Aqua-amine fluorescence was excited at 405 nm. Both 530 nm and 580 nm fluorescence were excited at 488 nm.
Data was exported as a .jo file and analyzed using Flowjo v9.7.7 (Flowjo LLC). Samples were gated to exclude data that did not meet parameters for single living cells. On this child population, an algebraic parameter was established to calculate the ratio of PE-A intensity over FITC-A intensity (red fluorescence/green fluorescence) for each cell. The median ratio of each sample was calculated and used for final data analysis.
2.9. TEM
Washed cells were transferred to a 25 ml flask where they were incubated for 72 hrs in a 37 °C incubator with 5% CO2. Cells were once again pelleted and resuspended in 1 ml of fixative solution (2% glutaraldehyde and 4% paraformaldehyde in 0.1 M sodium cacodylate buffer). These cells were kept on ice until processed for imaging. Fixative was removed and 1% OsO4 in ddH2O was added. Samples were then gently shaken and incubated for 1 hr at 4 °C. Incubated samples were washed three times with cold ddH2O for 5 min each. The samples were then stained with 1% uranyl acetate for 2 hrs at 4 °C. Stained samples were then dehydrated, using 50% EtOH for 10 min, then increasing the concentration to 70% for 10 more minutes, then increasing the concentration to 95% for 10 min. Samples were allowed to warm to room temperature before performing two more dehydrations with 100% EtOH for 10 min each. The final dehydration was performed with acetonitrile for 15 min. The dehydration mixture was then substituted for a 1:1 ratio of Embed 812 medium (44% Embed 812, 35% DDSA, 18% NMA, 3% BDMA) and acetonitrile for 1 hr. The ratio was then increased to 2:1 Embed 812 medium to acetonitrile for overnight incubation. Then, the mixture was substituted for 100% Embed 812 medium and incubated for 2 hrs before being placed in molds for overnight settling. Settled product was polymerized in a 65 °C oven for 24 hrs before prepared samples were sectioned for imaging.
Imaging was performed using a Jeol TEM 1400 microscope, and images were acquired at 2000× to 30000×. Images were saved as .dc3 files. Analysis of .dc3 images was performed using ImageJ.
2.10. Statistics
Throughout this paper, the distribution of data points is expressed as mean ± standard error of the mean (S.E.M.) unless otherwise indicated. Student’s t-test was used for statistical analysis.
3. Results
3.1. The ATP Levels Are Higher in PBMCs from CFS Patients
We detected ATP production in PBMCs from 42 patients and their paired controls, and discovered that the ATP levels were significantly higher in patients (Fig. 1A, B). We applied oligomycin to block mitochondrial ATP synthesis, and thus the remaining ATP content represented that from non-mitochondrial reactions such as glycolysis17,18. We found that the ATP levels from non-mitochondrial sources after oligomycin treatment were proportionally increased in CFS patients as the total ATP levels, while the mitochondrial ATP levels remained the same (Fig. 1B). This result suggests that non-mitochondrial ATP production is stimulated in patients.
Fig. 1. The ATP Levels and Mitochondrial Structure.
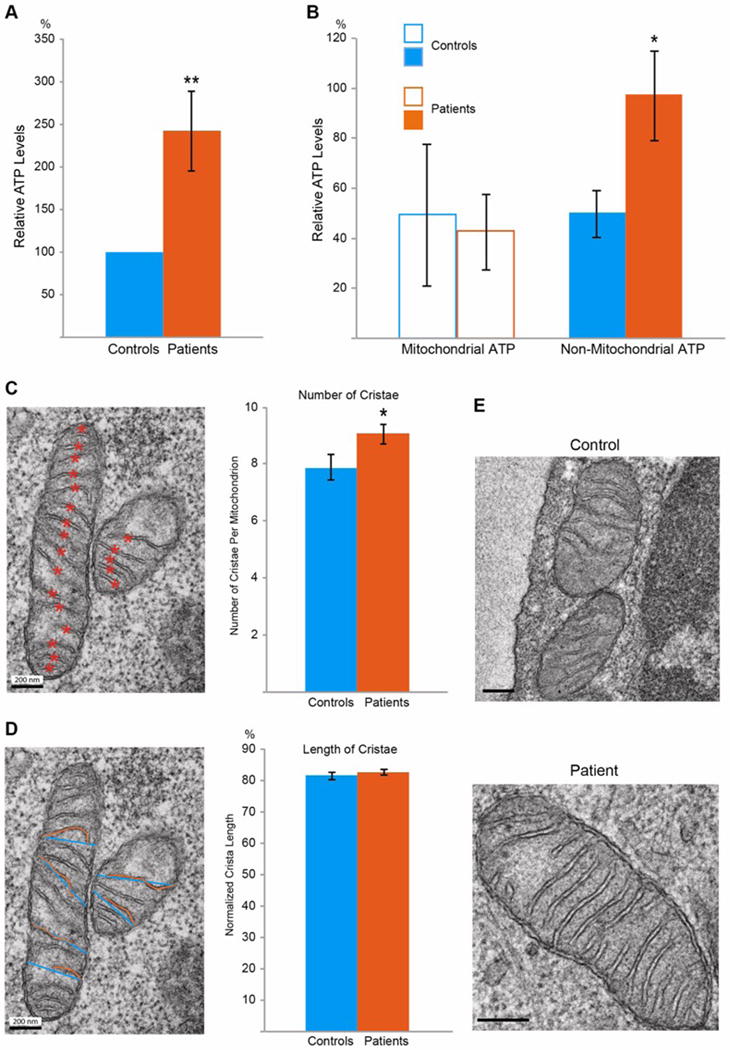
(A) The ATP level of each patient is expressed as a percent of that of the corresponding paired control, and the values are grouped and compared between patients and controls. n=42 pairs. (B) For each subject, the mitochondrial ATP is calculated as the total ATP (the value before oligomycin treatment) minus the non-mitochondrial ATP (the value after treatment), expressed as a percent of the mean of the total ATP of the control group. n=12–16 subjects. (C) The number of cristae in a mitochondrion is calculated by counting the number of total cristae (orange asterisks) and dividing the number by the size of the mitochondrion. n=215–218 mitochondria from 76–97 images from 27–34 subjects. (D) The mitochondrial crista length, or the percent of the width spanned by an individual crista, is calculated by dividing the length of a crista (orange line) by the width of the mitochondrion where the crista is (blue line). n=420–510 cristae from 49–58 images from 23–30 subjects. (E) Representative EM images illustrate patient and control mitochondria. Scale bars: 200 nm. For all the mitochondrial parameters examined here and in all figures, the selected patient groups always show higher ATP levels than the control groups, similar as in (A–B). * P<0.05, ** P<0.01, and error bars represent mean ± S.E.M. here and for all figures unless otherwise stated.
3.2. Mitochondrial Crista Membranes Are More Condensed in CFS Patients
We next examined mitochondrial ultrastructure in PBMCs using transmission electron microscopy (TEM). Cristae are protrusions of the inner mitochondrial membranes into the matrix, typically across the shorter side of the mitochondria. We first counted the number of cristae normalized to the size of the mitochondrion, and found that it was significantly increased in patients (Fig. 1C, E) suggesting that mitochondrial cristae membranes are more condensed. We also calculated the relative length of protrusion by dividing the individual crista length by the width of the mitochondrion where the crista is, and identified no significant change in patients (Fig. 1D, E). Thus, mitochondria condense crista membranes in CFS patients.
3.3. The Mitochondrial Density, Size, and Shape Are Unchanged in CFS Patients
We next tested other mitochondrial factors. We evaluated the mitochondrial density – the percent of a cell’s area that was occupied by mitochondria, the size, and the shape of the mitochondria. To calculate the mitochondrial density, we measured the combined area of the mitochondria in one cell and divided it by the area of the cell. To calculate the mitochondrial size, we measured the size of an individual mitochondrion, and normalized it to the area of the cell. Finally, to calculate the shape of a mitochondrion, we divided the length of a mitochondrion by its width. We found no significant difference in the mitochondrial density, size, or shape between patients and controls (Fig. 2A–C). In addition, we did not observe gross cell morphological defects in monocytes and lymphocytes, the two main cell types of PBMCs, in CFS patients (Fig. 2D).
Fig. 2. The Mitochondrial Density, Shape and Size Are Normal in CFS Patients.
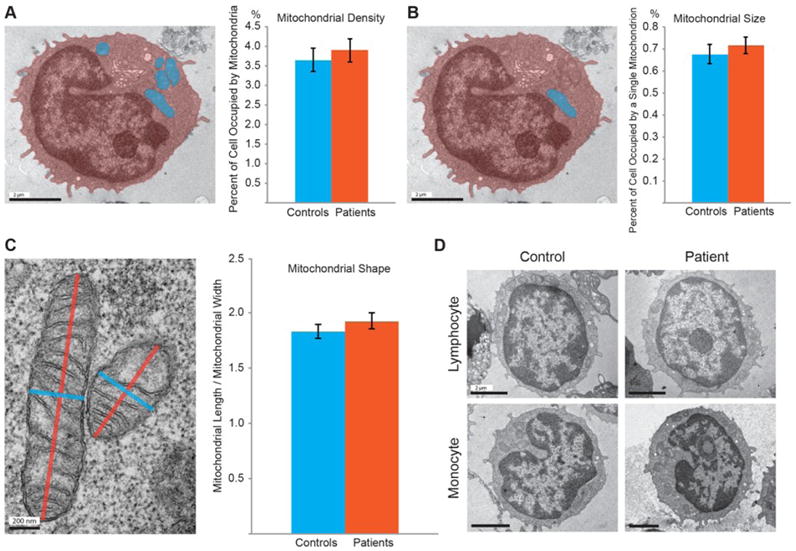
(A) The mitochondrial density is calculated as the percentage of the total mitochondrial area (blue) out of the total cell area (orange). (B) The mitochondrial size is quantified as the percentage of the area of an individual mitochondrion (blue) out of the total cell area (orange). (A–B) n=61–73 cells from 61–73 images from 28–36 subjects, P>0.05. (C) The mitochondrial shape is calculated by dividing the longer side of the mitochondrion (orange) by the shorter side (blue). n=242–308 mitochondria from 61–73 images from 28–36 subjects, P>0.05. (D) PBMC samples primarily contain lymphocytes, which have large round nuclei, and monocytes, which have small kidney-shaped nuclei. Scale bars: (A, B, D):2 μm; (C): 200 nm.
3.4. The Δψ and Complex Activities Are Normal in CFS Patients
We further measured the ΔΨ by calculating the intensity of the ΔΨ-dependent dye JC-119–21. JC-1 conjugates into healthy mitochondria with the polarized ΔΨ and emits red fluorescence (590 nm), or remains monomeric in the cytosol and emits green fluorescence (530 nm), when excited at 488 nm. Thus the ratio of the red over green intensity reflects the relative level of the ΔΨ. We applied JC-1 to PBMCs, and measured the JC-1 red and green intensities for each cell by flow cytometry. We found no significant difference in the red/green intensity ratio between patients and their paired controls (Fig. 3A).
Fig. 3. No Differences in the Complex Activities or Δψ between Patients and Controls.
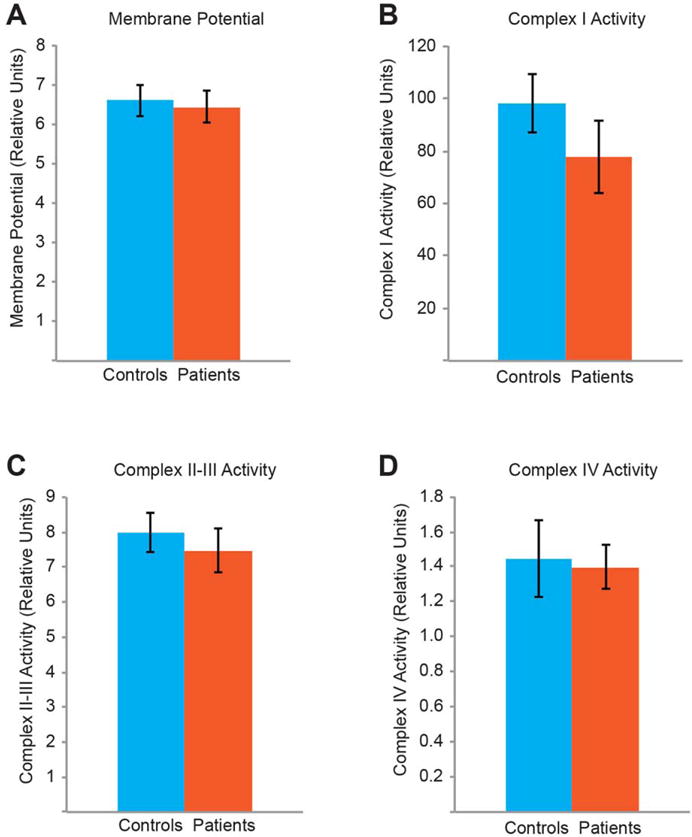
Quantifications of the Δψ (A), and of the ETC complex activities for complex I (B), complexes II–III (C), and complex IV (D). For (A), the median values are shown. n=13–48 subjects, P>0.05.
Finally, we assessed the enzymatic activities of the ETC complexes in PBMCs. We measured the Complex I activity by calculating the rate of NADH oxidation, the Complex II–III activity by the rate of cytochrome c reduction, and the Complex IV activity by the rate of cytochrome c oxidation22–24. We did not observe significant differences in any of the complex activities between patients and their matched controls (Fig. 3B–D). Taken together, the activities of the ETC complexes and ΔΨ are normal in CFS patients.
4. Discussion
CFS afflicts millions of people, but its underlying cause remains elusive. In this study, by examining mitochondrial phenotypes in depth in a patient-control series, we have revealed that there is no major mitochondrial defect in CFS patients. Despite finding that mitochondrial cristae are more condensed, the mitochondrial morphology, the ETC, and the ΔΨ remain intact in CFS patients compared to their paired controls. Intriguingly, we have shown that ATP production is stimulated in CFS patients, and the elevated ATP content mainly comes from non-mitochondrial sources. Our results present an unorthodox view on CFS pathology: the fatigue is not caused by lack of ATP, and instead might be caused by a pathological process linked to non-mitochondrial ATP production such as glycolysis25.
Mitochondrial crista architecture is exquisitely and dynamically maintained to support the changing mitochondrial aerobic respiratory rate26–30. The membrane area and number of cristae are expanded upon energy need elevation to promote respiratory activities31,32. The fact that the crista number is increased in CFS patients suggests that their energy demands might be unusually high, which triggers condensation of mitochondrial crista membranes.
The contrasting results of the ATP levels in different cohort of patients11,13–15 (this study) indicate that CFS is a complex disease and the current diagnoses may include people with varying molecular dysfunctions. A better categorization of patients with differing cellular defects will allow researchers to better understand the underlying causes and improve treatment efficacy. Future studies are warranted to unravel why and how non-mitochondrial ATP production is activated in some patients, which will yield insights into novel strategies to address the pathological causes.
Acknowledgments
We appreciate the Hutchins Family Foundation Chronic Fatigue Initiative for funding this research. We thank the Chronic Fatigue Initiative Clinical Investigator Group for sample collection: N.G. Klimas (College of Osteopathic Medicine, Institute for NeuroImmune Medicine, Nova Southeastern University, Ft Lauderdale, FL, USA), L. Bateman (Fatigue Consultation Clinic, Salt Lake City, UT, USA), D. Felsenstein (Harvard Medical School, Massachusetts General Hospital, Boston, MA, USA), S. Levine (Levine Clinic, New York, NY, USA), D. Peterson (Sierra Internal Medicine at Incline Village, Incline Village, NV, USA), and A.L. Komaroff (Brigham and Women’s Hospital, Harvard Medical School, Boston, MA, USA). We are grateful for assistance from John Perrino at the Stanford EM Core facilities and Jocelyn Wei for help with flow cytometry data collection. This study was funded in part by NIH grant 1S10RR02678001 (Jeol TEM 1400 microscope).
Footnotes
Conflict of Interest: no conflicts declared.
References
- 1.Snell CR, Stevens SR, Davenport TE, Van Ness JM. Discriminative validity of metabolic and workload measurements for identifying people with chronic fatigue syndrome. Physical therapy. 2013;93:1484–1492. doi: 10.2522/ptj.20110368. [DOI] [PubMed] [Google Scholar]
- 2.Brurberg KG, Fonhus MS, Larun L, Flottorp S, Malterud K. Case definitions for chronic fatigue syndrome/myalgic encephalomyelitis (CFS/ME): a systematic review. BMJ open. 2014;4:e003973. doi: 10.1136/bmjopen-2013-003973. [DOI] [PMC free article] [PubMed] [Google Scholar]
- 3.Nacul LC, et al. Prevalence of myalgic encephalomyelitis/chronic fatigue syndrome (ME/CFS) in three regions of England: a repeated cross-sectional study in primary care. BMC medicine. 2011;9:91. doi: 10.1186/1741-7015-9-91. [DOI] [PMC free article] [PubMed] [Google Scholar]
- 4.Lindal E, Stefansson JG, Bergmann S. The prevalence of chronic fatigue syndrome in Iceland – a national comparison by gender drawing on four different criteria. Nordic journal of psychiatry. 2002;56:273–277. doi: 10.1080/08039480260242769. [DOI] [PubMed] [Google Scholar]
- 5.Linde A, et al. Serum levels of lymphokines and soluble cellular receptors in primary Epstein-Barr virus infection and in patients with chronic fatigue syndrome. The Journal of infectious diseases. 1992;165:994–1000. doi: 10.1093/infdis/165.6.994. [DOI] [PubMed] [Google Scholar]
- 6.Simmons G, et al. Failure to confirm XMRV/MLVs in the blood of patients with chronic fatigue syndrome: a multi-laboratory study. Science. 2011;334:814–817. doi: 10.1126/science.1213841. [DOI] [PMC free article] [PubMed] [Google Scholar]
- 7.Alter HJ, et al. A multicenter blinded analysis indicates no association between chronic fatigue syndrome/myalgic encephalomyelitis and either xenotropic murine leukemia virus-related virus or polytropic murine leukemia virus. mBio. 2012;3 doi: 10.1128/mBio.00266-12. [DOI] [PMC free article] [PubMed] [Google Scholar]
- 8.Natelson BH, Haghighi MH, Ponzio NM. Evidence for the presence of immune dysfunction in chronic fatigue syndrome. Clinical and diagnostic laboratory immunology. 2002;9:747–752. doi: 10.1128/CDLI.9.4.747-752.2002. [DOI] [PMC free article] [PubMed] [Google Scholar]
- 9.Maes M, et al. Lower plasma Coenzyme Q10 in depression: a marker for treatment resistance and chronic fatigue in depression and a risk factor to cardiovascular disorder in that illness. Neuro endocrinology letters. 2009;30:462–469. [PubMed] [Google Scholar]
- 10.Booth NE, Myhill S, McLaren-Howard J. Mitochondrial dysfunction and the pathophysiology of Myalgic Encephalomyelitis/Chronic Fatigue Syndrome (ME/CFS) International journal of clinical and experimental medicine. 2012;5:208–220. [PMC free article] [PubMed] [Google Scholar]
- 11.Myhill S, Booth NE, McLaren-Howard J. Targeting mitochondrial dysfunction in the treatment of Myalgic Encephalomyelitis/Chronic Fatigue Syndrome (ME/CFS) – a clinical audit. International journal of clinical and experimental medicine. 2013;6:1–15. [PMC free article] [PubMed] [Google Scholar]
- 12.Galan F, de Lavera I, Cotan D, Sanchez-Alcazar JA. Mitochondrial Myopathy in Follow-up of a Patient With Chronic Fatigue Syndrome. Journal of investigative medicine high impact case reports. 2015;3:2324709615607908. doi: 10.1177/2324709615607908. [DOI] [PMC free article] [PubMed] [Google Scholar]
- 13.Castro-Marrero J, et al. Could mitochondrial dysfunction be a differentiating marker between chronic fatigue syndrome and fibromyalgia? Antioxidants & redox signaling. 2013;19:1855–1860. doi: 10.1089/ars.2013.5346. [DOI] [PubMed] [Google Scholar]
- 14.Vermeulen RC, Kurk RM, Visser FC, Sluiter W, Scholte HR. Patients with chronic fatigue syndrome performed worse than controls in a controlled repeated exercise study despite a normal oxidative phosphorylation capacity. Journal of translational medicine. 2010;8:93. doi: 10.1186/1479-5876-8-93. [DOI] [PMC free article] [PubMed] [Google Scholar]
- 15.Smits B, et al. Mitochondrial enzymes discriminate between mitochondrial disorders and chronic fatigue syndrome. Mitochondrion. 2011;11:735–738. doi: 10.1016/j.mito.2011.05.005. [DOI] [PubMed] [Google Scholar]
- 16.Vives-Bauza C, Yang L, Manfredi G. Assay of mitochondrial ATP synthesis in animal cells and tissues. Methods in cell biology. 2007;80:155–171. doi: 10.1016/S0091-679X(06)80007-5. [DOI] [PubMed] [Google Scholar]
- 17.Gan L, Liu Z, Cao W, Zhang Z, Sun C. FABP4 reversed the regulation of leptin on mitochondrial fatty acid oxidation in mice adipocytes. Scientific reports. 2015;5:13588. doi: 10.1038/srep13588. [DOI] [PMC free article] [PubMed] [Google Scholar]
- 18.Manfredi G, Yang L, Gajewski CD, Mattiazzi M. Measurements of ATP in mammalian cells. Methods. 2002;26:317–326. doi: 10.1016/S1046-2023(02)00037-3. [DOI] [PubMed] [Google Scholar]
- 19.Chen LB. Mitochondrial membrane potential in living cells. Annual review of cell biology. 1988;4:155–181. doi: 10.1146/annurev.cb.04.110188.001103. [DOI] [PubMed] [Google Scholar]
- 20.Dorrie J, Gerauer H, Wachter Y, Zunino SJ. Resveratrol induces extensive apoptosis by depolarizing mitochondrial membranes and activating caspase-9 in acute lymphoblastic leukemia cells. Cancer research. 2001;61:4731–4739. [PubMed] [Google Scholar]
- 21.Tsai PI, et al. PINK1-mediated phosphorylation of Miro inhibits synaptic growth and protects dopaminergic neurons in Drosophila. Scientific reports. 2014;4:6962. doi: 10.1038/srep06962. [DOI] [PMC free article] [PubMed] [Google Scholar]
- 22.Marcillat O, Zhang Y, Davies KJ. Oxidative and non-oxidative mechanisms in the inactivation of cardiac mitochondrial electron transport chain components by doxorubicin. The Biochemical journal. 1989;259:181–189. doi: 10.1042/bj2590181. [DOI] [PMC free article] [PubMed] [Google Scholar]
- 23.Radi R, Rodriguez M, Castro L, Telleri R. Inhibition of mitochondrial electron transport by peroxynitrite. Archives of biochemistry and biophysics. 1994;308:89–95. doi: 10.1006/abbi.1994.1013. [DOI] [PubMed] [Google Scholar]
- 24.Janssen AJ, et al. Spectrophotometric assay for complex I of the respiratory chain in tissue samples and cultured fibroblasts. Clinical chemistry. 2007;53:729–734. doi: 10.1373/clinchem.2006.078873. [DOI] [PubMed] [Google Scholar]
- 25.Andrade FH, McMullen CA. Lactate is a metabolic substrate that sustains extraocular muscle function. Pflugers Archiv : European journal of physiology. 2006;452:102–108. doi: 10.1007/s00424-005-0010-0. [DOI] [PubMed] [Google Scholar]
- 26.John GB, et al. The mitochondrial inner membrane protein mitofilin controls cristae morphology. Molecular biology of the cell. 2005;16:1543–1554. doi: 10.1091/mbc.E04-08-0697. [DOI] [PMC free article] [PubMed] [Google Scholar]
- 27.Mannella CA, Marko M, Penczek P, Barnard D, Frank J. The internal compartmentation of rat-liver mitochondria: tomographic study using the high-voltage transmission electron microscope. Microscopy research and technique. 1994;27:278–283. doi: 10.1002/jemt.1070270403. [DOI] [PubMed] [Google Scholar]
- 28.Mannella CA, Buttle K, Rath BK, Marko M. Electron microscopic tomography of rat-liver mitochondria and their interaction with the endoplasmic reticulum. BioFactors. 1998;8:225–228. doi: 10.1002/biof.5520080309. [DOI] [PubMed] [Google Scholar]
- 29.Khalifat N, Puff N, Bonneau S, Fournier JB, Angelova MI. Membrane deformation under local pH gradient: mimicking mitochondrial cristae dynamics. Biophysical journal. 2008;95:4924–4933. doi: 10.1529/biophysj.108.136077. [DOI] [PMC free article] [PubMed] [Google Scholar]
- 30.Hackenbr.Cr. Ultrastructural Bases for Metabolically Linked Mechanical Activity in Mitochondria. I. Reversible Ultrastructural Changes with Change in Metabolic Steady State in Isolated Liver Mitochondria. J Cell Biol. 1966;30:269–&. doi: 10.1083/Jcb.30.2.269. [DOI] [PMC free article] [PubMed] [Google Scholar]
- 31.Mannella CA, Lederer WJ, Jafri MS. The connection between inner membrane topology and mitochondrial function. Journal of molecular and cellular cardiology. 2013;62:51–57. doi: 10.1016/j.yjmcc.2013.05.001. [DOI] [PMC free article] [PubMed] [Google Scholar]
- 32.Zick M, Rabl R, Reichert AS. Cristae formation-linking ultrastructure and function of mitochondria. Biochimica et biophysica acta. 2009;1793:5–19. doi: 10.1016/j.bbamcr.2008.06.013. [DOI] [PubMed] [Google Scholar]