Abstract
We present a case series of a rare tumor, the desmoplastic infantile ganglioglioma (DIG) with MRI diffusion and perfusion imaging quantification as well as histopathologic characterization. Four cases with pathologically-proven DIG had diffusion weighted imaging (DWI) and two of the four had dynamic susceptibility contrast imaging. All four tumors demonstrate DWI findings compatible with low-grade pediatric tumors. For the two cases with perfusion imaging, a higher relative cerebral blood volume was associated with higher proliferation index on histopathology for one of the cases. Our results are discussed in conjunction with a literature review.
Keywords: pediatric brain tumors, desmoplastic infantile ganglioglioma, MRI, perfusion, diffusion
CASE SERIES
We report on four cases of desmoplastic infantile ganglioglioma at our institution with diffusion weighted imaging (DWI) for all four cases, dynamic susceptibility contrast (DSC) perfusion imaging for two of the cases, and described the histopathological findings in all four cases.
MRI Technique
Clinical MRI imaging was performed on all patients with a 1.5T scanner (Siemens Avanto, Erlangen, Germany; and GE Signa LX, Waukesha, WI, USA). Anatomic imaging included axial T2-weighted fast spin echo, sagittal and axial T1-weighted, axial T2-weighted fluid attenuated inversion recovery (T2 FLAIR), and post contrast axial, coronal and sagittal T1-weighted sequences. Diffusion weighted images were performed with multi-slice single shot spin-echo echoplanar imaging (EPI) with 5 mm slice thickness prior to administration of contrast material with b values of 0, and 1000 s/mm2 applied in the x, y, and z directions. Processing of apparent diffusion coefficient (ADC) maps was performed automatically on the MR units. DSC perfusion imaging was performed with a peripherally inserted 24 gauge angiocatheter with power injection of 4 cc/s of 0.1 mmol/kg of gadobenate dimeglumine (MultiHance, Bracco Diagnostics Inc., Princeton, NJ) diluted in normal saline for a total volume of 32 ml. DSC perfusion MR images were obtained during the first pass bolus of contrast on 1.5 MRI scanners (Siemens Avanto and Verio, Erlangen, Germany) using a gradient echo EPI sequence (TR 1531-1630 / TE 30–49 ms, flip angle 90 degrees).
Diffusion Analysis
ADC maps were independently analyzed by two board-certified neuroradiologists (C.H. and S.K.) with certificate of added qualification (CAQ) in neuroradiology. At least three regions of interest (ROI) with size ranging from 2–5 mm2 were placed in the mass at the PACS workstation using a manual/freeform ROI tool and the value was automatically calculated and expressed in 10-3 mm2/s. Sites of ROI placement were chosen by visual inspection and targeted the darkest signal intensity regions on the ADC map. The entire brain MRI sequences were available during ADC value placement to avoid placing an ROI on an area of presumed blood products based on intrinsic T1-weighted shortening, T2-weighted shortening, or susceptibility on the b0 images. The minimum absolute ADC values of the three ROIs for each neuroradiologist were then averaged and used as the final average absolute minimum value for the tumor. This technique has been previously utilized in the literature [1].
Perfusion Analysis
Quantitative analysis of tumor relative cerebral blood volume (rCBV) was performed by two neuroradiologists (C. H. and S. K.) using a commercially available workstation (Dynasuite Neuro 3.0 workstation, InVivo Corp, Pewaukee WI). Each neuroradiologist independently obtained a rCBV maximum (rCBVmax) for each tumor by drawing at least three 2–5 mm2 ROIs within the perceived highest CBV within tumor tissue, and using the highest value divided by a similar ROI placed in normal-appearing contralateral white matter. This technique has been previously described in the perfusion evaluation of adult tumors [2]. Conventional MR images were available to assist in ROI placement within the tumor and avoid placement within vascular structures and avoid T2* artifacts. Workstation-generated corrected CBV maps were used, with CBV correction by gamma variate fitting and an algorithm developed by Boxerman et al [3].
From April 2003 to March 2012, there were four pathologically proven cases of DIG at our institution. All four cases had diffusion imaging, and two of the four cases included DSC perfusion imaging.
Case 1
Clinical and Radiologic Data
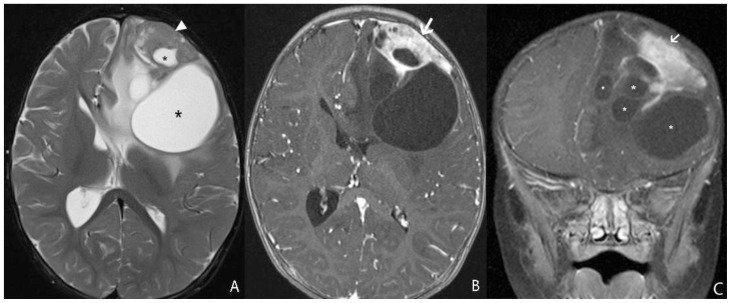
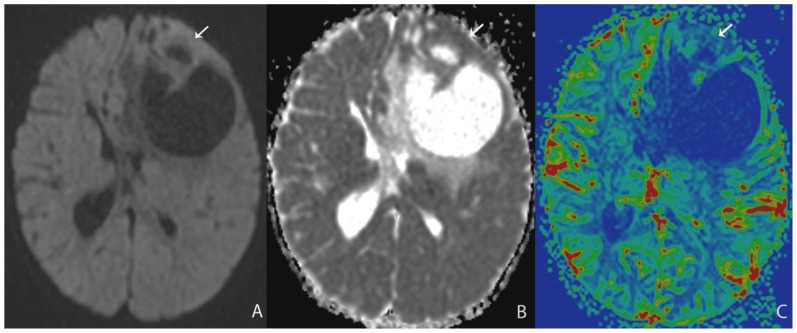
A 13 month-old female infant presented with clinical history of increasing head circumference, macrocephaly, and otherwise normal development. An MRI was performed showing a large multi-cystic tumor within the left frontal lobe with an intensely enhancing solid nodule located in the periphery with broad dural attachment. The entire tumor measured 5.7 × 7.2 × 6.5 cm (fig. 1). The highest rCBV within the tumor coincided with the solid enhancing portion, which was qualitatively less than normal surrounding cortex. The averaged rCBVmax was 1.28 while the averaged minimum ADC measurement was 0.76 × 10⁻³ mm2/s (fig. 2). Gross total resection was performed shortly after the MRI scan. The craniotomy site was complicated by a pseudomeningocele that was repaired by a dural patch 2 months after tumor resection. To date, there has been no recurrence by imaging at 6 months.
Figure 1.
13 month-old female infant with increasing head circumference and pathology proven DIG.
A) Findings: There is a large heterogeneous mass in the left frontal lobe with multiple cysts (asterisks) deep to the periphery and an isointense to brain solid nodule (arrowhead) abutting the dural surface. There is midline shift and adjacent T2 prolongation of the white matter.
Technique: Axial T2 turbo spin echo (1.5T, TR=3200, TE=91)
B) Findings: There is heterogeneous enhancement of the solid nodule with a broad dural base (arrow).
Technique: Axial 3D inversion recovery spoiled gradient recalled echo T1 post contrast (1.5T, TR=1900, TE=3, contrast=Multihance 0.1mmol/kg, delayed phase)
C) Findings: There is a heterogeneously enhancing solid component with a broad dural base (arrow) in addition to the more central cystic components (asterisks).
Technique: Coronal T1 turbo spin echo fat saturated post contrast image (1.5T, TR=514, TE=10, contrast=Multihance 0.1mmol/kg, delayed phase)
Figure 2.
13 month-old female infant with increasing head circumference and pathology proven DIG.
A) Findings: There is no no significant increased signal of the solid nodule (arrow) with respect to the normal brain parenchyma.
Technique: Axial DWI b=1000 image (1.5T, TR=7199, TE=97)
B) Findings: There is relative isointensity of solid tumoral ADC signal compared to adjacent brain parenchyma.
Technique: Axial ADC map image (1.5T, TR=7199, TE=97)
C) Findings: There is relative hypoperfusion of the solid nodule in comparison with adjacent and contralateral gray matter.
Technique: Axial rCBV map from DSC (1.5T, TR=1630, TE=49, contrast=Multihance 0.1mmol/kg, first pass bolus)
Pathology
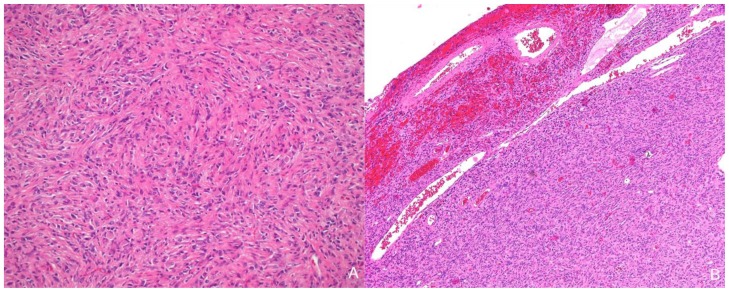
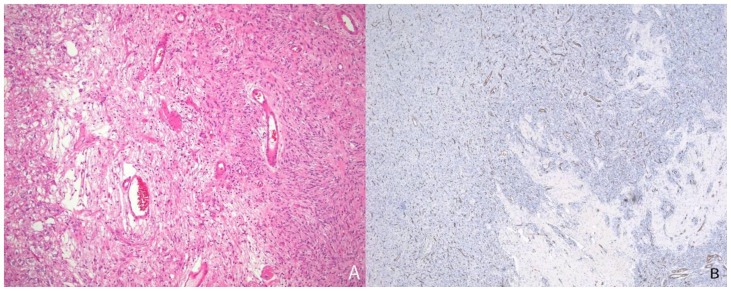
The solid component of this tumor was composed of desmoplastic spindle cells within a dense eosinophilic collagenous background (fig. 3A). This tumor was tightly adherent to the dura and surrounds the penetrating vessels of the meninges (fig. 3B). Other areas of the tumor showed cells within a looser backround matrix with intervening blood vessels (fig. 4A). There was no necrosis or endothelial vascular proliferation. It had a low Ki67 proliferative index (1–2%) and mitoses were not appreciated. The neuroepithelial cells were strongly immunoreactive for glial fibrillary acidic protein (GFAP), while CD34 and smooth muscle actin (SMA) highlighted the vascular walls of the intratumoral vessels (fig. 4B). While there were no directly visible connections of the meningeal vessels to the numerous small thin-walled vessels, it was highly suggestive that the vessels of the meninges may be providing collaterals to the solid components of the tumor.
Figure 3.
13-month old female with increasing head circumference and pathology proven DIG. A) Hematoxylin and Eosin (H&E) 100x stains of the solid component of tumor showing a desmoplastic spindle cell tumor with densely eosinophilic collagenous background. B) H&E, 40x. Cortical surface of tumor showing the superficial location of the tumor as well as tumor growth into the leptomeninges. Leptomeningeal vessels are prominent within the superficial portions of the tumor.
Figure 4.
13-month old female with increasing head circumference and pathology proven DIG. A) H&E, 100x. A small portion of the tumor shows tumor cells in a looser background matrix with many small to medium-sized blood vessels. B) CD34, 40x. A CD34 immunohistochemical stain highlights the numerous small vessels within the solid component of the tumor.
Case 2
Clinical and Radiologic Data
A 6 month-old male infant presented with increasing head circumference, macrocephaly, and otherwise normal development. An MRI was performed showing a large 7.9 × 8.1 × 8.7 cm multi-cystic tumor in the left frontal lobe with an intensely enhancing solid nodule located in the periphery with broad dural attachment, T2 prolongation of surrounding white matter, and midline shift (fig. 5). The highest rCBV within the tumor coincided with the solid enhancing portion, which was qualitatively less than normal surrounding cortex. The averaged rCBVmax was 3.05 while the averaged minimum ADC measurement was 0.88 × 10⁻³ mm2/s (fig. 6). Gross total resection was performed shortly after MRI scanning. To date, there has been no recurrence by imaging at 3 years, and the patient has no residual deficits.
Figure 5.
6 month-old male infant with increasing head circumference and pathology proven DIG
A) Findings: There is a large heterogeneous tumor with peripheral heterogeneous solid component with a broad dural base and more central multicystic components. There is midline shift and mass effect on the lateral ventricles. Note the linear areas of hypointensity within the solid component which likely represent vascular flow voids (arrow).
Technique: Axial T2 turbo spin echo (1.5T, TR=3700, TE=99)
B) Findings: There is an intensely enhancing solid nodule with a broad dural base (arrow).
Technique: Coronal T1 turbo spin echo fat saturation post contrast image (1.5T, TR=508, TE=17, contrast=Multihance 0.1mmol/kg, delayed phase)
Figure 6.
6 month-old male infant with increasing head circumference and pathology proven DIG.
A) Findings: ROI measurement of the lowest areas of diffusion.
Technique: ADC map (1.5T, DWI b=1000, TR=7199, TE=97)
B) Findings: ROI measurements to obtain an rCBV ratio. Measurement of the area with the highest signal intensity corresponds with the highest CBV values divided by the normal contralateral white matter.
Technique: Grayscale rCBV map from DSC PWI (1.5T, TR=1630, TE=49, contrast=Multihance 0.1mmol/kg, first pass bolus)
C) Findings: Color rCBV map from DSC PWI shows areas of relative hyperperfusion (arrows) compared to the rest of the solid enhancing component within the tumor. These areas were excluded from measurement if they correspond with vessels on anatomic images.
Technique: Color rCBV map from DSC PWI (1.5T, TR=1630, TE=49, contrast=Multihance 0.1mmol/kg, first pass bolus)
Pathology
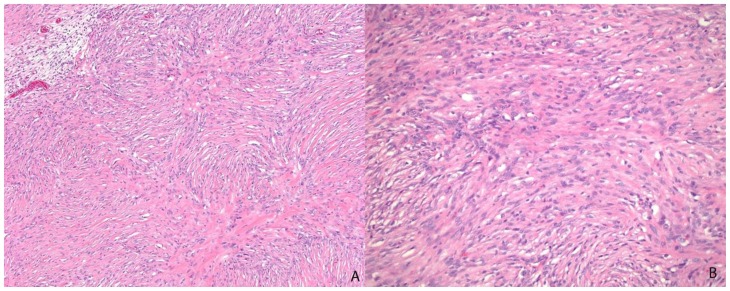
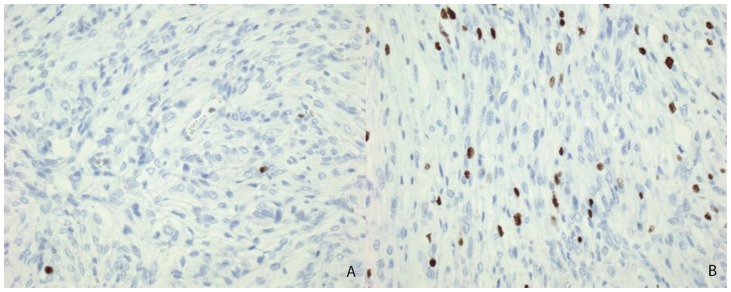
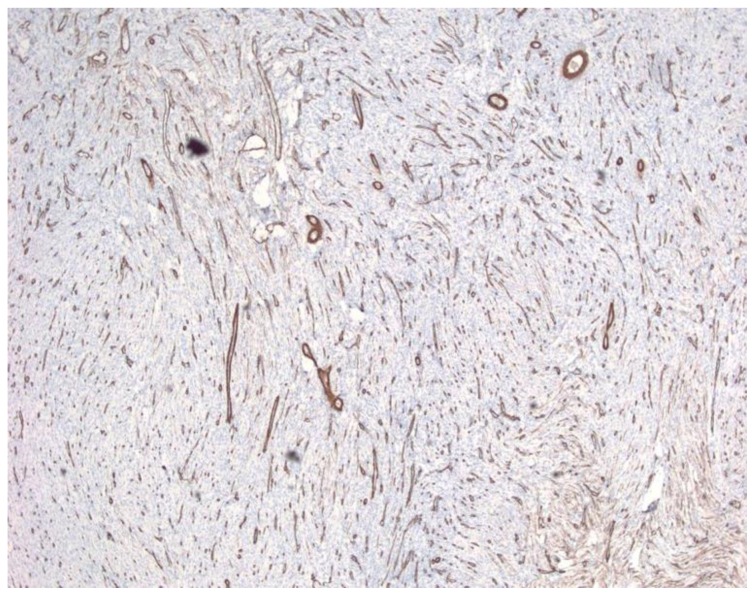
Histologically this was a heterogeneous tumor with cysts and solid areas composed of desmoplastic spindle cells in a dense collagenous background, intermixed with large islands of astrocytic cells (fig. 7). The majority of this tumor had a low ki67 proliferative index (1%), but there are foci, particularly in the astrocytic regions with a proliferative index up to 7% (fig 8). Mitoses are rare, 1 per ten high power fields (400x). The tumor was highly vascular, with the vessel walls being highlighted by an SMA immunostain (fig 9). These vessels are of greater concentration in the solid components of the tumor. This may contribute to the intense contrast enhancement on MRI scans. This tumor was located very superficially in the cortex. While there was no definitive evidence of penetration of the tumor by meningeal vessels the close proximity to the meninges was suggestive that some of the meningeal vessels may be contributing collaterals to the solid tumor component.
Figure 7.
6 month-old male infant with increasing head circumference and pathology proven DIG. Variable pathology is noted in this tumor including, A) H&E 200x showing the more classically described desmoplastic cells within a densely collagenous background matrix while B) H&E 200X, shows areas of the tumor were the cells are elongated with cytoplasmic processes, reminiscent of an astrocytic neoplasm.
Figure 8.
6 month-old male infant with increasing head circumference and pathology proven DIG. A) Ki67 proliferative index immunohistochemical stain, 200x, showing the low proliferation of the majority of the tumor. B) Ki67 proliferative index immunohistochemical stain, 200x, demonstrates rare areas of increased proliferation with an index rate of up to 7%.
Figure 9.
6 month-old male infant with increasing head circumference and pathology proven DIG. Smooth Muscle Actin, 100x, showing the numerous intratumoral blood vessels.
Case 3
Clinical and Radiologic Data
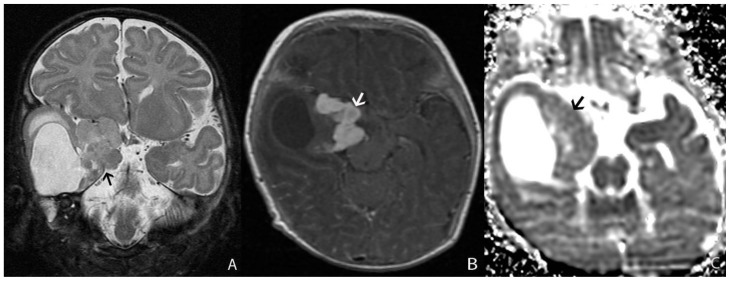
A seven-week old male infant presented with new onset seizures characterized by eye twitching. An MRI was performed showing a moderate 4.2 × 3.5 × 3.2 cm heterogeneous mass with a cyst in the right anterior temporal lobe with an intensely enhancing solid nodule located medially extending to the suprasellar cistern and with broad attachment to the right tentorial incisura (fig. 10). The averaged minimum ADC measurement was 0.97 × 10⁻³ mm2/s. Gross total resection was performed shortly after MRI imaging. At 5 years after diagnosis, the patient was hospitalized for status epilepticus; however, no tumor recurrence was seen on imaging. To date the patient has had no tumor recurrence by imaging at 6 years post resection but has had persistent developmental delay and left spastic hemiparesis.
Figure 10.
Seven-week old male infant with new onset seizures characterized by eye twitching and pathology proven DIG.
A) Findings: There is a solid and cystic mass involving the right temporal lobe, expanding the middle cranial fossa. Note the solid component is medial but demonstrates a broad base of attachment with the tentorial incisura (arrow). The solid component measures 3.4 cm in the craniocaudal dimension and demonstrates T2 iso to hyperintensity with mass effect on the overlying thalamus.
Technique: Coronal short TI inversion recovery (1.5T, TR=5000, TE=96)
B) Findings: There is intense homogeneous enhancement of the solid component, which protrudes into the suprasellar cistern (arrow).
Technique: Axial T1 turbo spin echo post contrast (1.5T, TR=450, TE=14, contrast=Prohance 0.1mmol/kg, delayed phase)
C) Findings: There is relative isointensity of the solid tumoral component on ADC map (arrow) compared to the adjacent brain parenchyma.
Technique: Axial ADC map image (1.5T, TR=7199, TE=97)
Pathology
This tumor had both solid and cystic components. The solid components were superficial and made up of a spindle cell population interwoven with a dense collagenous stroma. Rare mitotic figures were identified (less than 1 per 10 high power fields). Many of the tumor cells were immunoreactive for GFAP. A Ki67 proliferative index was less than 1% in most of the tumor, but there were foci with a proliferative index of up to 4%. There were no other signs of anaplasia such as necrosis, apoptosis, nuclear pleomorphism or endothelial vascular proliferation.
Case 4
Clinical and Radiologic Data
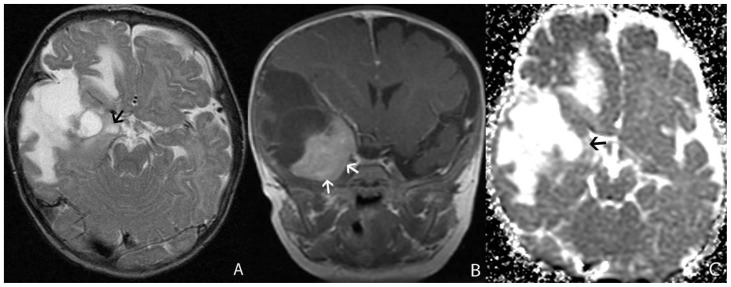
A 4 month-old male infant presented with new onset seizure and apneic episodes. An MRI was performed showing a large, 4.4 × 6.2 × 4.9 cm multi-cystic tumor centered in the right anterior temporal lobe with an intensely enhancing solid nodule extending medially to the suprasellar cistern with a broad dural attachment to the right tentorial incisura (fig. 11). The averaged minimum ADC measurement was 1.14 × 10⁻³ mm2/s. The patient had partial resection shortly after the MRI. At 3 months post craniotomy placement of a shunt catheter was performed within the tumor cyst due to enlargement of the cystic portion, causing greater mass effect. Finally, a near total resection of the tumor was performed at 4 months from initial craniotomy, with residual tumor adjacent and within the right cavernous sinus, encasing the right internal carotid artery. The patient was treated with two cycles of vincristine, carboplatin, and temozolomide, with shrinkage of tumor. At 6 years from diagnosis, there has been no recurrence by imaging, although the patient has behavioral issues, attention deficit hyperactivity disorder and Asperger’s syndrome.
Figure 11.
4 month-old male infant with new onset seizure and apneic episodes with pathology proven DIG
A) Findings: There is a large heterogeneous mass in the right temporal lobe, expanding the middle cranial fossa. There is a heterogeneous solid component (arrow) which is medial to the multiple cysts and surrounding T2 white matter prolongation.
Technique: Axial T2 turbo spin echo (1.5T, TR=3200, TE=91)
B) Findings: The solid component has near homogeneous intense enhancement with a broad dural attachment both medial and inferior to the tumor (arrows).
Technique: Coronal T1 turbo spin echo post contrast (1.5T, TR=508, TE=17, contrast=Prohance 0.1mmol/kg, delayed phase)
C) Findings: The solid component of the tumor (arrow) has relative iso- to hyperintensity compared to the adjacent brain parenchyma.
Technique: Axial ADC map image (1.5T, TR=7199, TE=97)
Pathology
Both the initial resection and the reresection four months later had nearly identical histology. The tumor was composed of desmoplastic stroma with dense collagen and intermixed with astrocytic cells with mild to moderate nuclear pleomorphism. GFAP was strongly immunoreactive. There were no mitoses or necrosis. The Ki67 proliferative index was 1%. This tumor was highly vascular with numerous small blood vessels throughout the solid components of the tumor. A reticulin stain highlighted these vessels. There was no definitive meningeal vessel penetration into the examined tumor sections.
DISCUSSION
Intracranial tumors presenting in the first years of life represent a diagnostic challenge as they are commonly large and heterogeneous [1,4–9]. Despite the similar imaging appearance of these tumors, the recognition of benign versus malignant entities are crucial as complete surgical resection may be curative. Desmoplastic infantile gangliogliomas (DIG) are generally benign intra-axial tumors commonly presenting in infants. Although they can have a recognizable imaging appearance consisting of a large, cystic tumor with an intensely enhancing peripheral nodule with dural attachment, this appearance is not exclusive to a benign etiology as malignant tumors may also have enhancing solid components and cystic or necrotic changes [1,10]. Diffusion and perfusion characteristics have been used to radiologically differentiate various brain tumors, although the perfusion characteristics of DIGs have not been previously reported. Therefore we present both the diffusion and perfusion characteristics of these tumors and compare these results with other low grade tumors and demonstrate a pathologic correlate to the imaging appearance.
Etiology & Demographics
DIGs are rare tumors primarily presenting in the first 18 months of life with a median age of 5–6 months at diagnosis [11]. A review by Hummel et al [12] of DIG cases within the literature show that there is a 1.7 male to female ratio.
Clinical & Imaging findings
Increased head circumference is the primary presenting symptom. The second most common symptom is seizures, which were more likely to occur in patients presenting after two years of age. Only 11% of patients presented with vomiting. As previously noted, the classic appearance of a DIG is a large heterogeneous supratentorial tumor with a solid nodule that contacts the dura with a broad dural base. The solid nodule is usually hyperdense on CT with calcification and hemorrhage not typically seen. The solid component is typically T1 and T2 isointense to brain parenchyma with intense contrast enhancement. Central cysts and adjacent parenchymal vasogenic edema is typical.
Treatment & Prognosis
The mainline treatment of DIGs is complete surgical resection, with adjuvant chemotherapy in case where surgical resection is not possible. Out of a total of 107 cases in the literature, only 76 had reported initial surgical outcomes. Out of these 76 cases, 47 had gross total resection, 26 had subtotal resection, and 3 had only an initial biopsy. The majority of patients (60.7%) had a clinically benign course after initial surgical resection, while the remainder required further treatment (re-resection, chemotherapy, and/ or radiotherapy). Overall, 15% of patients either developed leptomeningeal disease or died from the disease, suggesting that the remainder, 85%, had a benign clinical outcome with resection and/or adjuvant therapy. [12] (table 1).
Table 1.
Summary table of characteristics of Desmoplastic Infantile Ganglioglioma.
| Etiology: | Desmoplastic Infantile Ganglioglioma |
| Incidence: | <0.1% of CNS tumors |
| Gender Ratio: | M:F = 1.7:1 |
| Age Predilection: | 0–2 years of age |
| Risk Factors: | None known |
| Treatment: | Gross total resection, chemotherapy if complete surgical resection not possible |
| Prognosis: | Good, 85% with benign clinical course |
| Findings on Imaging: | Typically large and heterogeneous lobar tumor with cystic components and a solid enhancing nodule with a broad dural base |
Differential Diagnosis
Other common primary infantile CNS neoplasms with similar radiologic appearance include primitive neuroectodermal tumor, atypical teratoid rhabdoid tumor, choroid plexus carcinomas, and supratentorial ependymomas [13].
Primitve neuroectodermal tumor
These are large heterogeneous lobar tumors when occurring in the supratentorial brain. Solid components may be hyperdense on CT with calcification and hemorrhage potentially present. Cystic components are common with less than expected surrounding tumoral edema for size. Diffusion weighted imaging may show decreased diffusion of the solid component. The solid component typically has heterogeneous enhancement, and may have leptomeningeal seeding.
Atypical teratoid rhabdoid tumor
When presenting in the supratentorial brain this malignant tumor presents as a large heterogeneous lobar tumor, with calcification and possible hemorrhage. The solid component may be T1 and T2 iso to hyperintense depending on hemorrhage, with areas of central cystic necrosis. Diffusion images may show decreased diffusion. There is typically heterogeneous enhancement, with possible leptomeningeal seeding.
Choroid plexus carcinoma
These tumors are predominantly intraventricular, although can grow to be very large with invasion of the periventricular brain to dominate an entire hemisphere. Calcification is common and the solid components are iso to hyperdense on CT. On MRI, the solid components are T1 and T2 iso to hypointense, depending on calcification with typically intense enhancement.
Supratentorial ependymoma
These typically arise in a periventricular location due to ependymal rests outside the ventricle. They are typically heterogeneous and large, commonly with calcification and cystic areas. Solid components are iso to hyperdense on CT and T1 iso to hypointense and T2 iso to hyperintense on MRI. There is typically heterogeneous enhancement. There may be decreased diffusion particularly in anaplastic varieties.
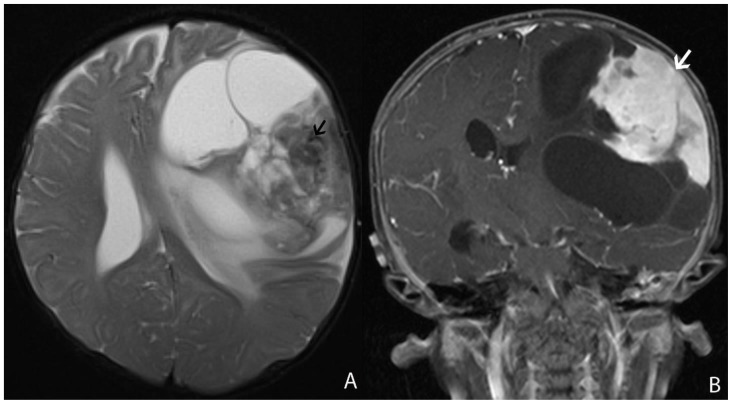
Many of these malignant tumors tend to have large heterogeneous appearance with cystic/ necrotic changes and enhancing solid portions (figure 1). This may represent a diagnostic challenge in differentiating a benign tumor such as DIG from these entities based on anatomic imaging alone [1,10] (table 2).
Table 2.
Differential diagnosis table for primary CNS tumor in infants.
| Etiology | CT | MRI | Pattern of enhancement |
|---|---|---|---|
| Desmoplastic Infantile Ganglioglioma |
|
|
|
| Primitive Neuroectodermal Tumor (Supratentorial) |
|
|
|
| Atypical Teratoid Rhabdoid Tumor (supratentorial) |
|
|
|
| Choroid Plexus Carcinoma |
|
|
|
| Supratentorial Ependymoma |
|
|
|
To our knowledge, these are the first cases of DIG with the combination of perfusion and ADC analysis in the literature. In a series of 9 patients with desmoplastic infantile tumors, Jurkiewicz et al reported the minimum ADC value of solid portion of the tumor ranged from 0.606 to 1.020 × 10⁻³ mm2/s with mean ADC value of 0.921 × 10⁻³ mm2/s [14]. Similarly, in our series of DIGs, the minimum ADC value of the solid tumor ranged from 0.76 to 1.14 × 10⁻³ mm2/s with mean ADC value 0.94 × 10⁻³ mm2/s. As demonstrated by Rumboldt et al, in a population of posterior fossa tumor in children, ADC is inversely proportional to tumor grade [15]. This is hypothetically due to increasing tumor cellularity, and thus tumor grade, leading to decrease in ADC [16]. However, Rose et al. did not find significant overlap in glioblastomas between minimum ADC and 3,4-dihydroxy-6-[18F]-fluoro-L-phenylalanine PET, which is thought to be a marker for tumor proliferation, with their conclusions suggesting that minimum ADC may represent tumor ischemia or tissue compression rather than primarily tumor cellularity [17]. Nevertheless, according to Rumboldt et al, the mean of the averaged ADC of low grade tumors, juvenile pilocytic astrocytoma and ependymoma within their study was 1.53 × 10⁻³ mm2/s. For high grade tumors, medulloblastomas and atypical teratoid rhabdoid tumors within their study, the mean of the averaged ADC was 0.64 × 10⁻³ mm2/s. Our mean of the averages of the minimum ADC values for the DIG cases is 0.94 × 10⁻³ mm2/s. While not as high as the majority of low grade tumors presented in their study, our measurements differed in that we looked for the minimum ADC value within the tumor. This ensures that the area potentially representing the highest cellularity is evaluated, especially within a heterogeneous tumor [18]. In a previous paper [1], within a cohort of intracranial tumors in the first year of life, we reported a threshold for which ADC values ≤ 0.698 × 10⁻³ mm2/s were likely to be World Health Organization grade I and II tumors for which three of these cases of DIGs were included. All minimum averaged ADC values for the DIGs in this series were above this cutoff, compatible with low grade neoplasm. Qualitatively, as the solid components of the tumors are typically peripheral and adjacent to cortex, we did not observe abnormally decreased ADC relative to the adjacent gray matter. The solid enhancing component was typically isointense or hyperintense to adjacent gray matter on ADC maps (Figs 2,6,10,11).
There is a paucity of perfusion imaging of pediatric tumors within the literature. Law et al. proposed a cut off of 1.75 rCBV between low and high grade adult astrocytic glial neoplasms [19]. However, the values from previous studies cannot be used as a threshold benchmark given the differences in patient population, and tumor type. Although rCBV has been shown to positively correlate with tumor grade in astrocytic adult gliomas, there is no direct histologic correlation in the literature. Theories postulate that rCBV could be a biomarker of tumor angiogenesis, although elevated rCBV can be seen in low grade tumors due to contrast leakage [20]. Our two cases with DSC perfusion demonstrated rCBV results of 1.28 and 3.05, for cases 1 and 2 respectively. Generally, this suggests a cerebral blood volume of the tumor 1.28 and 3.05 times greater than normal white matter for these two cases. The higher rCBV value is interesting in that it does not correlate as well for the predominantly low grade nature of DIGs. However, the pathology in our patient (case 2) with the higher rCBV demonstrated a higher proliferative index (7%) compared to our other case. As previously stated, Hummel et al. suggests that a minority of patients can have leptomeningeal disease or mortality from DIG, suggesting that not all DIGs have good outcome. Analysis of a larger numbers of patients would be necessary to determine if higher rCBV correlates with a higher Ki-67 index and is associated with worse prognosis. A similar correlation has been demonstrated by Bruna et al, in atypical and anaplastic meningiomas, where Ki-67 index ≥ 9.9% was significant for increased tumor recurrence and decreased overall survival [21]. Histologically, low and high mitotic activity due to clusters of poorly differentiated cells, neuronal and glial components, and variable vascularization without endothelial proliferation are described in DIGs despite the common radiologic finding in all reported cases of intense enhancement of the solid component [10,22,23,24]. A possible explanation for the increased vascularity and resulting intense enhancement may be that the tumors receive collateral supply from the meninges as was suggested by the pathology from three of the four cases in our series. This would be analogous to a meningioma, which are highly vascular yet predominantly benign tumors, which can also demonstrate elevated rCBV [25].
Historically, complete surgical resection of DIGs have a high likelihood of cure [26,27]. A few cases in the literature demonstrate progression to high grade tumor showing a small risk of progression in cases with subtotal resection [28, 29]. Currently, molecular and genomic features of these tumors are inconclusive [30]. As such, it is important to appropriately diagnose DIGs of infantile CNS neoplasms and attempt complete resection when feasible. Diffusion and perfusion imaging characteristics may serve as an additional useful clue to the diagnosis, especially when the anatomic images are not highly specific. Furthermore, further investigation is necessary to determine whether diffusion and perfusion data correlate with prognosis in these patients.
Limitations include the small sample size and the lack of direct anatomic correlation between histologic samples and radiographic location within the tumor. However, the possibility for sampling error is low as gross total resection was achieved on three of the four cases with the fourth receiving near total resection.
In summary, we present perfusion on two cases and diffusion data on four cases of DIG tumors, the combination of which to our knowledge has not been previously reported. This information may serve as an important adjunct to the diagnosis when anatomic neuroimaging are not specific. Further evaluation is necessary to determine whether these diffusion and perfusion data is related to tumor histopathology and prognosis.
TEACHING POINT
Desmoplastic infantile gangliogliomas are a key primary brain tumor to recognize in infants due to its commonly benign course. Although these tumors are typically large and heterogeneous with cystic components, the characteristic finding of a peripherally located enhancing nodule with a broad dural base can be helpful in differentiating this tumor from the malignant primary brain tumors which also present in the first two years of life.
ABBREVIATIONS
- ADC
apparent diffusion coefficient
- CAQ
certificate of additional qualification
- DIG
desmoplastic infantile ganglioglioma
- DSC
dynamic susceptibility contrast
- DWI
diffusion weighted imaging
- EPI
echo planar imaging
- GFAP
glial fibrillary acidic protein
- H&E
Hematoxylin and Eosin
- rCBV
relative cerebral blood volume
- ROI
region of interest
- SMA
smooth muscle actin
REFERENCES
- 1.Kralik S, Taha A, Kamer A, Cardinal J, Seltman T, Ho C. Diffusion imaging for tumor grading of supratentorial brain tumors in the first year of life. AJNR Am J Neuroradiol. 2014 Apr;35(4):815–23. doi: 10.3174/ajnr.A3757. [DOI] [PMC free article] [PubMed] [Google Scholar]
- 2.Emblem K, Nedregaard B, Nome T, et al. Glioma grading by using histogram analysis of blood volume heterogeneity from MR-derived cerebral blood volume maps. Radiology. 2008 Jun;247(3):808–17. doi: 10.1148/radiol.2473070571. [DOI] [PubMed] [Google Scholar]
- 3.Boxerman J, Schmainda K, Weisskoff R. Relative cerebral blood volume maps corrected for contrast agent extravasation significantly correlate with glioma tumor grade, whereas uncorrected maps do not. AJNR Am J Neuroradiol. 2006;27:859–67. [PMC free article] [PubMed] [Google Scholar]
- 4.Chung S, Wang K, Nam D, Cho B. Brain tumor in the first year of life: a single institute study. J Korean Med Sci. 1998 Feb;13(1):65–70. doi: 10.3346/jkms.1998.13.1.65. [DOI] [PMC free article] [PubMed] [Google Scholar]
- 5.Mehrotra N, Shamji M, Vassilyadi M, Ventureyra E. Intracranial tumors in first year of life: the CHEO experience. Childs Nerv Syst. 2009 Dec;25(12):1563–9. doi: 10.1007/s00381-009-0936-1. [DOI] [PubMed] [Google Scholar]
- 6.Rickert C, Probst-Cousin S, Gullotta F. Primary intracranial neoplasms of infancy and early childhood. Childs Nerv Syst. 1997 Oct;13(10):507–13. doi: 10.1007/s003810050127. [DOI] [PubMed] [Google Scholar]
- 7.Buetow P, Smirniotopoulos J, Done S. Congenital brain tumors: a review of 45 cases. AJNR Am J Neuroradiol. 1990 Jul-Aug;11(4):793–9. [PMC free article] [PubMed] [Google Scholar]
- 8.Dirks P, Harris L, Hoffman H, Humphreys R, Drake J, Rutka J. Supratentorial primitive neuroectodermal tumors in children. J Neurooncol. 1996 Jul;29(1):75–84. doi: 10.1007/BF00165520. [DOI] [PubMed] [Google Scholar]
- 9.Meyers S, Khademian Z, Biegel J, Chuang S, Korones D, Zimmerman R. Primary intracranial atypical teratoid/rhabdoid tumors of infancy and childhood: MRI features and patient outcomes. AJNR Am J Neuroradiol. 2006 May;27(5):962–71. [PMC free article] [PubMed] [Google Scholar]
- 10.Manoranjan B, Provias J. Congenital brain tumors: diagnostic pitfalls and therapeutic interventions. J Child Neurol. 2011 May;26(5):599–614. doi: 10.1177/0883073810394848. [DOI] [PubMed] [Google Scholar]
- 11.Trehan G, Bruge H, Vinchon M, Khalil C, Ruchoux M, Dhellemmes P, Ares G. MR imaging in the diagnosis of desmoplastic infantile tumor: retrospective study of six cases. AJNR Am J Neuroradiol. 2004 Jun-Jul;25(6):1028–33. [PMC free article] [PubMed] [Google Scholar]
- 12.Hummel T, Miles L, Mangano F, Jones B, Geller J. Clinical heterogeneity of desmoplastic infantile ganglioglioma: a case series and literature review. J Pediatr Hematol Oncol. 2012 Aug;34(6):e232–6. doi: 10.1097/MPH.0b013e3182580330. [DOI] [PubMed] [Google Scholar]
- 13.Lang S, Beslow L, Gabel B, Judkins A, Fisher M, Sutton L, Storm P, Heuer G. Surgical treatment of brain tumors in infants younger than six months of age and review of the literature. World Neurosurg. 2012 Jul;78(1–2):137–44. doi: 10.1016/j.wneu.2011.09.012. [DOI] [PMC free article] [PubMed] [Google Scholar]
- 14.Jurkiewicz E, Grajkowska W, Nowak K, et al. MR imaging, apparent diffusion coefficient and histopathological features of desmoplastic infantile tumors-own experience and review of the literature. Childs Nerv Syst. 2015 Feb;31(2):251–9. doi: 10.1007/s00381-014-2593-2. [DOI] [PubMed] [Google Scholar]
- 15.Rumboldt Z, Camacho D, Lake D, Welsh C, Castillo M. Apparent diffusion coefficients for differentiation of cerebellar tumors in children. AJNR Am J Neuroradiol. 2006 Jun-Jul;27(6):1362–9. [PMC free article] [PubMed] [Google Scholar]
- 16.Gupta R, Cloughesy T, Sinha U, et al. Relationships between choline magnetic resonance spectroscopy, apparent diffusion coefficient and quantitative histopathology in human glioma. J Neurooncol. 2000 Dec;50(3):215–26. doi: 10.1023/a:1006431120031. [DOI] [PubMed] [Google Scholar]
- 17.Rose S, Fay M, Thomas P, et al. Correlation of MRI-derived apparent diffusion coefficients in newly diagnosed gliomas with [18F]-fluoro-L-dopa PET: what are we really measuring with minimum ADC? AJNR Am J Neuroradiol. 2013 Apr;34(4):758–64. doi: 10.3174/ajnr.A3315. [DOI] [PMC free article] [PubMed] [Google Scholar]
- 18.Lee E, Lee S, Agid R, Bae J, Keller A, Terbrugge K. Preoperative grading of presumptive low-grade astrocytomas on MR imaging: diagnostic value of minimum apparent diffusion coefficient. AJNR Am J Neuroradiol. 2008 Nov;29(10):1872–7. doi: 10.3174/ajnr.A1254. [DOI] [PMC free article] [PubMed] [Google Scholar]
- 19.Law M, Yang S, Wang H, Babb JS, Johnson G, Cha S, Knopp EA, Zagzag D. Glioma grading: sensitivity, specificity, and predictive values of perfusion MR imaging and proton MR spectroscopic imaging compared with conventional MR imaging. AJNR Am J Neuroradiol. 2003 Nov-Dec;24(10):1989–98. [PMC free article] [PubMed] [Google Scholar]
- 20.Cha S. Update on brain tumor imaging: from anatomy to physiology. AJNR Am J Neuroradiol. 2006 Mar;27(3):475–87. [PMC free article] [PubMed] [Google Scholar]
- 21.Bruna J, Brell M, Ferrer I, Gimenez-Bonafe P, Tortosa A. Ki-67 proliferative index predicts clinical outcome in patients with atypical or anaplastic meningioma. Neuropathology. 2007 Apr;27(2):114–20. doi: 10.1111/j.1440-1789.2007.00750.x. [DOI] [PubMed] [Google Scholar]
- 22.Alexiou G, Stefanaki K, Sfakianos G, Prodromou N. Desmoplastic infantile ganglioglioma: a report of 2 cases and a review of the literature. Pediatr Neurosurg. 2008;44(5):422–5. doi: 10.1159/000149913. [DOI] [PubMed] [Google Scholar]
- 23.Nikas I, Anagnostara A, Theophanopoulou M, et al. Desmoplastic infantile ganglioglioma: MRI and histological findings case report. Neuroradiology. 2004 Dec;46(12):1039–43. doi: 10.1007/s00234-004-1283-2. [DOI] [PubMed] [Google Scholar]
- 24.Uematsu H, Maeda M, Sadato N, et al. Measurement of the vascularity and vascular leakage of gliomas by double-echo dynamic magnetic resonance imaging: a preliminary study. Invest Radiol. 2002 Oct;37(10):571–6. doi: 10.1097/00004424-200210000-00006. [DOI] [PubMed] [Google Scholar]
- 25.Zhang H, Rödiger LA, Shen T, Miao J, Oudkerk M. Perfusion MR imaging for differentiation of benign and malignant meningiomas. Neuroradiology. 2008 Jun;50(6):525–30. doi: 10.1007/s00234-008-0373-y. [DOI] [PMC free article] [PubMed] [Google Scholar]
- 26.Gelabert-Gonzalez M, Serramito-García R, Arcos-Algaba A. Desmoplastic infantile and non-infantile ganglioglioma. Review of the literature. Neurosurg Rev. 2010 Apr;34(2):151–8. doi: 10.1007/s10143-010-0303-4. [DOI] [PubMed] [Google Scholar]
- 27.Sugiyama K, Arita K, Shima T, et al. Good clinical course in infants with desmoplastic cerebral neuroepithelial tumor treated by surgery alone. J Neurooncol. 2002 Aug;59(1):63–9. doi: 10.1023/a:1016309813752. [DOI] [PubMed] [Google Scholar]
- 28.Al-Kharazi K, Gillis C, Steinbok P, Dunham C. Malignant desmoplastic infantile astrocytoma? a case report and review of the literature. Clin Neuropathol. 2013 Mar-Apr;32(2):100–6. doi: 10.5414/NP300548. [DOI] [PubMed] [Google Scholar]
- 29.Prakash V, Batanian JR, Guzman MA, et al. Malignant transformation of a desmoplastic infantile ganglioglioma in an infant carrier of a nonsynonymous TP53 mutation. Pediatr Neurol. 2014 Jul;51(1):138–43. doi: 10.1016/j.pediatrneurol.2014.02.012. [DOI] [PubMed] [Google Scholar]
- 30.Gessi M, Zur Mühlen A, Hammes J, et al. Genome-wide DNA copy number analysis of desmoplastic infantile astrocytomas and desmoplastic infantile gangliogliomas. J Neuropathol Exp Neurol. 2013 Sep;72(9):807–15. doi: 10.1097/NEN.0b013e3182a033a0. [DOI] [PubMed] [Google Scholar]


