. 2016 Aug 30;5:e18017. doi: 10.7554/eLife.18017

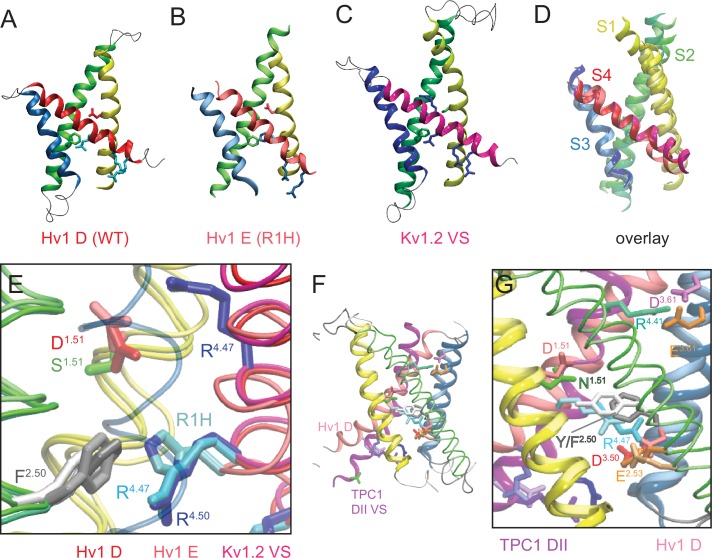
Figure 5. New Hv1 D (WT) and Hv1 E (R1H) VS domain resting-state model structures.

(AD) Ribbon diagrams represent backbone structures in snapshots taken from MD simulations of the Hv1 D (WT) VS domain resting-state model structure (A), Hv1 E R1H mutant model structure (B), resting-state Kv1.2 VS domain Rosetta model structure (Pathak et al., 2007) that was used as the template for construction of Hv1 D (C). The model structures in AC are overlain in D to illustrate their overall structural similarity. Transmembrane helical backbones in AD are color coded: S1, yellow; S2, green; S3, blue; S4 red. Video 1 shows similar representations of Hv1 D, Hv1 E and Kv1.2 resting-state model structures rotated about the vertical axis. (E) An overlay of the Hv1 D, Hv1 E and Kv1.2 resting-state Rosetta VS domain model structures illustrates the relative positions of S1-S4 helical backbones (tubes colored as in AD). Selected side chains (Hv1 D: D112/D1.51, red; F150/F2.50, light gray; R1/R205/R4.47, cyan; Hv1 E: D112/D1.51, light red; F150/F2.50, white; R1H/R205H, cyan/blue; Kv 1.2: S176/S1.51, green; F233/F2.50, dark gray; R1/R4.47 and R2/R4.50, blue) are shown in colored licorice. For clarity, only the S3 helix from Hv1 D (transparent blue tube) is shown. (F) The backbone structures of Hv1 D model and At TPC1 DII X-ray (pdb: 5EJ1) VS domains are overlain. S1, S3 and S4 helices are shown as ribbons and S2 helices are shown as tubes. Helical segments are colored as in AD and loop regions are gray; lighter shades represent Hv1 D and darker shades represent TPC1. Selected side chains in Hv1 D/TPC1 (D/N1.51, red/green; F/Y2.50, gray/white; D/E3.61, magenta/orange) are shown in colored licorice. (G) A magnified view of the overlain Hv1 D and TPC1 structures illustrates the similar positions of selected side chains, which are shown in colored licorice (Hv1 D: D112/D1.51, pale red; F150/F2.50, light gray; E153/E2.53, pale orange; D174/D3.50, pale red; D185/D3.61, pale magenta; R1/R205/R4.47, pale cyan; TPC1: N443/N1.51, green; Y475/Y2.50, white; E478/E2.53, orange; D500/D3.50, red; E511/E3.61, orange; R531/R4.41, aqua; R537/R1/R4.47, cyan).

DOI: http://dx.doi.org/10.7554/eLife.18017.013

Figure 5.

Figure 5—figure supplement 1. Comparison of Hv1 D to Kv1.2–2.1 chimera model and Ci VSP ‘down’ X-ray VS domain resting-state structures.

Figure 5—figure supplement 1.

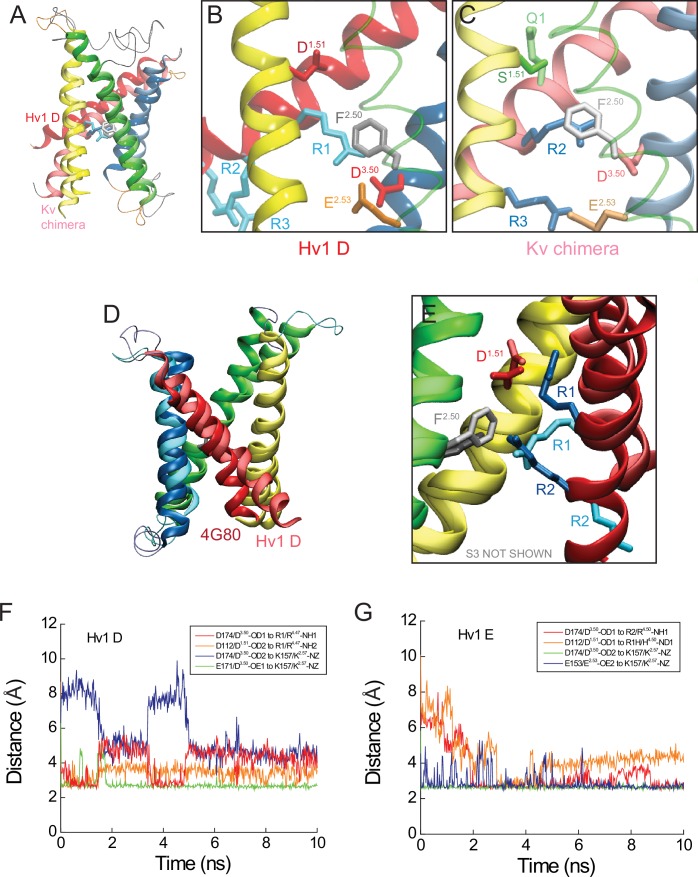
(A) The backbone structures of Hv1 D and a putative resting conformation of the Kv1.2–2.1 chimera (Jensen et al., 2012) VS domain are superimposed. Helical backbones are shown as colored ribbons (as in Figure 5; lighter shades represent Kv chimera). (B, C) Magnified views of Hv1 D (B) and Kv chimera (C) highlight the relative positions of selected side chains shown in colored licorice and labeled (Hv1 D: D112/D1.51, red; F150/F2.50, gray; E153/E2.53, orange; D174/D3.50, red; R1-R3, cyan; Kv chimera: S180/S1.51, green; F237/F2.50, white; E240/E2.53, orange; D263/D3.50, red; Q294/Q1/Q4.47, green; R297/R2/R4.50 and R300/R3/R4.53, blue). For clarity the S2 helix is represented as a transparent green tube in B and C. (D) The backbone structures of Hv1 D and Ci VSDD (pdb: 4G80) are superimposed. Helical backbones are represented as ribbons and colored as in AC; S4 is pink in Hv1 D and red in Ci VSDD. (E) Magnified view of the superimposed Hv1 D and Ci VSDD structures shown in D (S3 helices are omitted for clarity). Selected side chains are shown in colored licorice and labeled (Hv1 D: D112/D1.51, pale red; F150/F2.50, white; R1/R4.47 and R2/R4.50, cyan; Ci VSDD: D129/D1.51, red; F161/F2.50, gray; R1/R4.47 and R2/R4.50, blue). (F, G) Distances between indicated atoms in Hv1 D (F) and Hv1 E (G) that are predicted to participate in stable salt bridges (cutoff distance = 3.5 Å, VMD 1.9.2) are plotted in function of time during the last 10 ns of an all-atom MD simulation.
Figure 5—figure supplement 2. Comparison of Hv1 D and Hv1 E to Kv1.2 resting-state Rosetta model, Ci Hv1 resting-state model, and mHv1cc closed-state X-ray VS domain structures.

Figure 5—figure supplement 2.

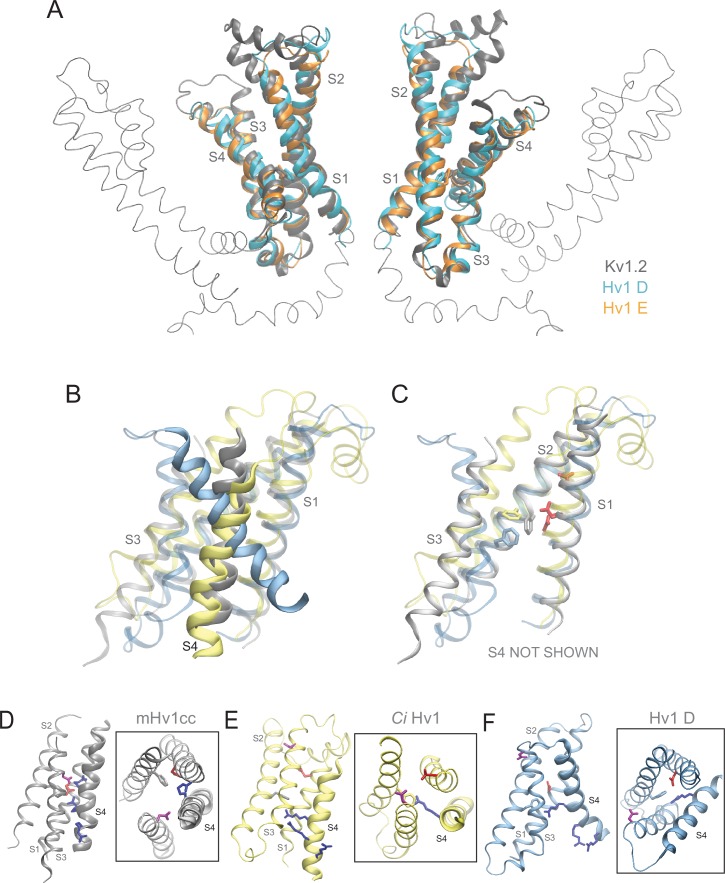
(A) Ribbon diagrams represent backbone structures of the VS and pore domains in a resting-state Kv1.2 VS domain Rosetta model (gray) superimposed with Hv1 D (cyan) and Hv1 E (orange) VS domains. The pore domain selectivity filter is oriented parallel to membrane normal. (BC) An overlay of mHv1cc (gray), Ci Hv1 (yellow) and Hv1 D (cyan) backbone ribbon diagrams illustrates how S4 exhibits a more pronounced tilt (B) relative to S1-S3, which are similarly oriented in each of the three structures (C). D112/D1.51 (red) and F150/F2.50 (backbone color) side chains are shown in colored licorice. S4 is omitted for clarity in C. (DF) Backbone structures of mHv1cc (D, gray), Ci Hv1 (E, yellow) and Hv1 D (F, cyan) resting-state VS domain models are represented by colored ribbons viewed side-on or from the extracellular space (boxed insets). The locations of S1-S4 helices are indicated by labels and S4 is rendered as a thicker ribbon. Selected side chains corresponding to D112/D1.51 (red), F150/F2.50 (backbone color), D185/D3.61 (violet) and R1/R4.47 (blue) are shown in colored licorice.
Figure 5—figure supplement 3. Atomic distances and central crevice hydration in Hv1 D and Hv1 E MD simulations.

Figure 5—figure supplement 3.

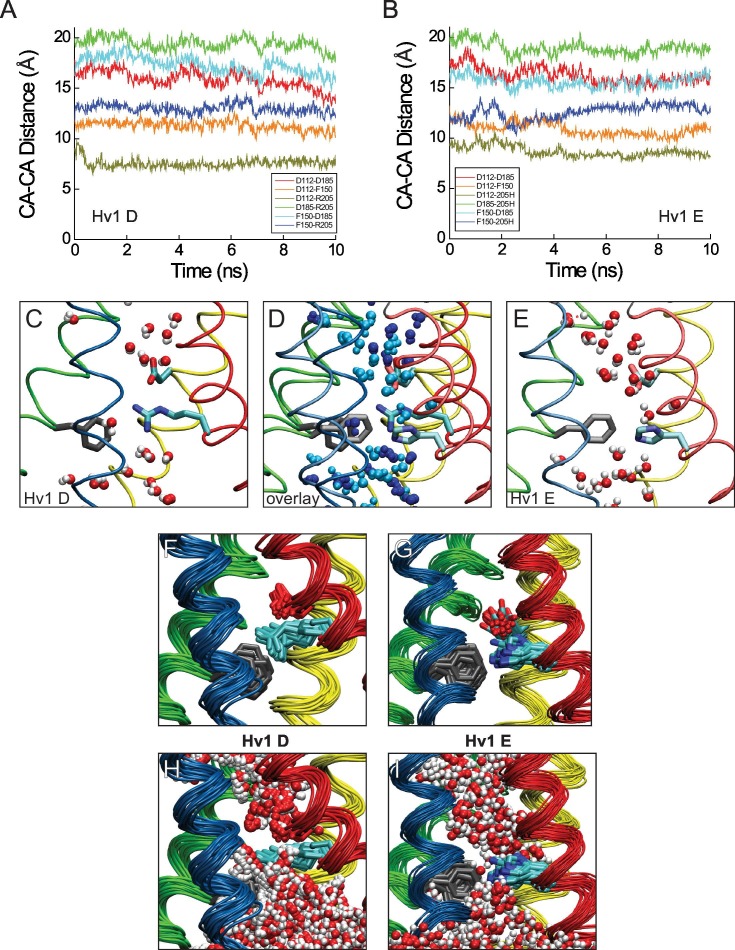
(A, B) Distances between Cα (CA) atoms of selected residues (D112/D1.51, F150/F2.50, D185/D3.61 and either R1/R205/R4.47 or R1H/R205H) are plotted in function of time during the last 10 ns of an all-atom MD simulation conducted with Hv1 D (A) or Hv1 E (B) model structures. (CE) Snapshots of the Hv1 D (C) and Hv1 E (E) model structures selected at t = 1 ns from the MD simulation trajectories are shown. Hv1 D and Hv1 E models are superimposed in panel D. Helices are shown as colored tubes (S1, yellow; S2, green; S3, blue; S4, red), F150/F2.50 is shown in gray licorice and D112/D1.51 and R1/R205/R4.47 are shown in colored licorice where carbon atoms are cyan, nitrogens are blue, and oxygens are red (hydrogens are not shown). Water molecules within 3.5 Å of protein are represented in CPK format, where oxygen is red and hydrogens are white. In the overlay (D), waters in the Hv1 D system are colored blue and waters in the Hv1 E system are colored cyan and backbone and side chains are represented by darker or lighter color shades in Hv1 D or Hv1 E, respectively. (FI) Snapshots selected from 30 frames of the Hv1 D (F, H) and Hv1 E (G, I) MD simulation trajectories corresponding to (0.7−1.0 ns) shown in A an11 B are superimposed. For clarity, water molecules (represented as in C and E) are shown only in panels H (Hv1 D) and I (Hv1 E).
Figure 5—figure supplement 4. Structure of the resting-state GSH permeation pathway.

Figure 5—figure supplement 4.

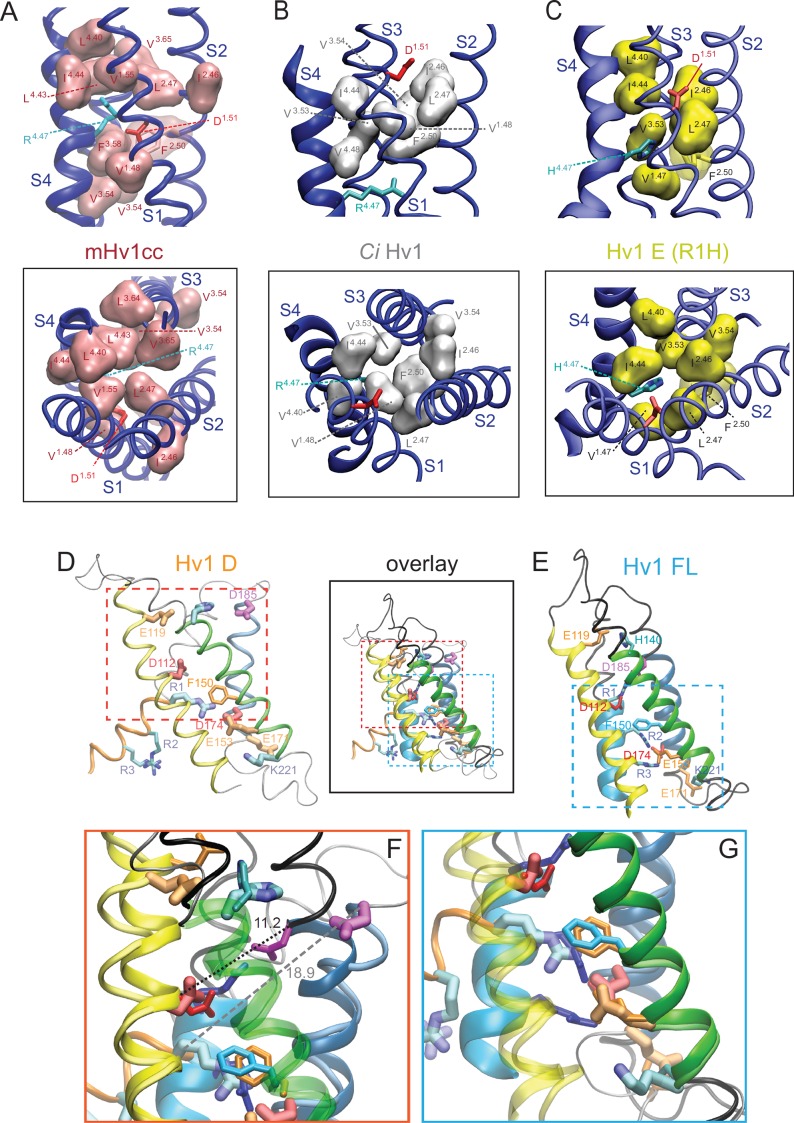
(AC) Magnified views of mHv1cc (A), Ci Hv1 (B) and Hv1 E (C) resting-state VS domain X-ray and model structures viewed either side-on from the plane of the membrane (top panels) or from the extracellular space (bottom panels). Helical segments are shown as colored ribbons (S1: X1.42-X1.58, yellow; S2: X2.40-X2.57, green; S3: X3.47-X3.66, blue; S4: X4.39-X4.56, red). Selected ionizable side chains are shown in colored licorice representations: D12/D1.51 (red), D185/D3.61 (magenta), R1/R4.47 (cyan), R2/R4.50 (blue) and R3/R4.53 (violet). With the exception of F150/F2.50 (licorice, backbone color), hydrophobic residues listed in Table 1 are shown as space-filling representations; wireframe colors refer to residues X1.52 (cyan), V1.55 (red), L2.47 (blue) and V3.53 (green). mHv1cc I173/I3.53 was transferred from Ci VSP into the mHv1cc chimera sequence. L189/L3.65 is not represented in Hv1 E because it is above of the plane of view. Videos 2 and 3 show mHv1cc, Ci Hv1 and Hv1 E in motion viewed from the plane of the membrane (Video 2) or from the extracellular space (Video 3). (D, E) Hv1 D (D) and Hv1 FL (E) VS domain model structures are superimposed and backbone structures are shown as tubes (Hv1 D) or ribbons (Hv1 FL) colored as in Figure 5, except that S4 is orange in Hv1 D and cyan in Hv1 FL. Selected side chains are shown in colored licorice (D112/D1.51 and D174/D3.50, red; E119/E1.58, E153/E2.53 and E171/E3.47, orange; F150/F2.50, orange; D185/D3.61, magenta; H140/H2.40, R1/R4.47, R2/R4.50 and K221/K4.63, cyan/blue) as indicated by labels. Selected Hv1 D side chains are shown in thicker licorice representations and lighter color shades to facilitate comparison with Hv1 FL. Dashed lines in E indicate areas that are magnified in F and G. (F) Magnified view of the extracellular networks in Hv1 D and Hv1 FL VS domain model structures illustrate similarities and differences in the positions of selected residue side chains. Atomic distances (in Å) between the Cα atoms of R1 and D185 are indicated by black (Hv1 FL) or gray (Hv1 D) dashed lines. (G) Residues in the intracellular side of the Hv1 D and Hv1 FL VS domains are shown. In F and G, the S2 and S1 helices, respectively, are transparent. Video 5 shows Hv1 B and Hv1 FL resting-state model structures in rotation.