Abstract
This study was conducted to improve the precision of arrhythmia-insensitive-rapid (AIR) cardiac T1 mapping through pulse sequence optimization and then evaluate the intra-scan repeatability in patients at 3T against investigational Modified Look-Locker inversion recovery (MOLLI) T1 mapping. In the first development phase (5 human subjects), we implemented and tested centric-pair k-space ordering to suppress image artifacts associated with eddy currents. In the second development phase (15 human subjects), we determined optimal flip angles to reduce the measurement variation in T1 maps. In the validation phase (35 patients), we compared the intra-scan repeatability between investigational MOLLI and optimized AIR. In 23 cardiac planes, conventional centric k-space ordering [3.7%] produced significantly (p < 0.05) more outliers as a fraction of left ventricular cavity area than optimal centric k-space ordering [1.4%]. In 15 human subjects, for each of 4 types of measurement (native myocardial T1, native blood T1, post-contrast myocardial T1, post-contrast blood T1), flip angles 55-65° produced lower measurement variation while producing results that are not significantly different with those produced by previously used flip angle 35° (p > 0.89, intra-class correlation coefficient ≥ 0.95 for all 4 measurement types). Compared with investigational MOLLI (coefficient of repeatability = 40.0, 77.2, 26.5, and 25.9 ms for native myocardial, native blood, post-contrast myocardial, and post-contrast blood T1, and 2.0% for ECV measurements, respectively), optimized AIR (coefficient of repeatability = 54.3, 89.7, 30.5, and 14.7 ms for native myocardial, native blood, post-contrast myocardial, and post-contrast blood T1, and 1.6% for ECV measurements, respectively) produced similar absolute intra-scan repeatability in all 35 patients in the validation phase. High repeatability is critically important for longitudinal studies, where the goal is to monitor physiologic/pathologic changes, not intra-scan repeatability. Optimized AIR cardiac T1 mapping is likely to yield high scan-retest repeatability for pre-clinical and clinical applications.
Keywords: Diffuse myocardial fibrosis, cardiac T1 mapping, k-space ordering, flip angle optimization, image artifacts, precision, repeatability
Graphical abstract
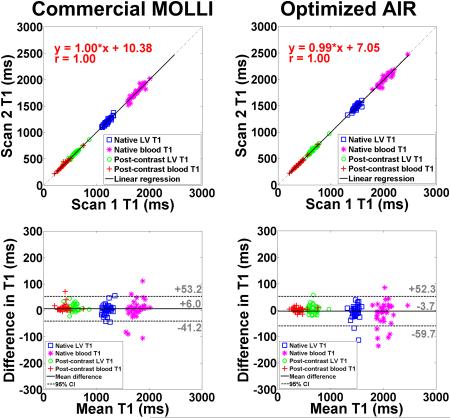
This study was conducted to improve the precision of AIR cardiac T1 mapping through k-space ordering and flip angle optimization. Rigorour evaluation in 35 patients show that investigational MOLLI and optimized AIR produce similar intra-scan repeatability as shown below. Optimized AIR cardiac T1 mapping is likely to yield high test-retest repeatability for pre-clinical and clinical applications.
Introduction
While biopsy is the current standard test for assessment of myocardial fibrosis, it is often impractical for the following reasons: (i) invasive procedure with risk of complications, (ii) susceptibility to sampling errors, and (iii) specimens obtained from the right ventricular septum may not represent the left ventricle (LV). Recent advancements in cardiovascular MRI, specifically cardiac longitudinal relaxation time (T1) mapping (1-3) or extracellular volume (ECV) fraction (3-8) mapping, has overcome the aforementioned limitations with biopsy and generated significant interest in the concept of “non-invasive biopsy” (9).
Currently, there are several investigational cardiac T1 mapping pulse sequences reported in literature, including Modified Look-Locker inversion recovery (MOLLI) (10), Shortened Modified Look-Locker inversion recovery (ShMOLLI) (11), saturation-recovery single-shot acquisition (SASHA) (12, 13), modified Look-Locker acquisition with saturation recovery (MLLSR) (14), saturation method using adaptive recovery times for cardiac T1 mapping (SMARTT1Map) (15), saturation pulse prepared heart rate independent inversion recovery (SAPPHIRE)(16), and arrhythmia-insensitive-rapid (AIR)(17). In general, saturation-recovery based T1 mapping pulse sequences produce higher accuracy than inversion-recovery based T1 mapping pulse sequences, whereas inversion-recovery based T1 mapping pulse sequences produce higher precision than saturation-recovery based T1 mapping pulse sequences (18). Saturation-and inversion-recovery based T1 mapping pulse sequences produce different T1 measurements (13, 16, 19); as well as ECV because systematic biases for native (large) and post-contrast (small) T1 measurements are different. This implies that investigators need to establish pulse sequence specific ECV cutoff values for distinguishing between normal and pathologies.
Among these investigational pulse sequences, AIR with a scan time of only 2 heart beats is particularly promising for imaging patients with rapid heart rates, arrhythmia (e.g., atrial fibrillation), and/or reduced breath-hold capacity (e.g., critically ill, advanced heart failure with pulmonary edema). AIR is an accurate method because it uses a robust saturation radio-frequency pulse (20) for T1 weighting (18) and the Bloch equation describing an ideal saturation recovery of magnetization to calculate T1, which is a valid first-order approximation because it uses centric k-space ordering. Because AIR acquires only one proton density weighted image and one T1 weighted image for speed, it produces lower precision than other cardiac T1 mapping pulse sequences which acquire multiple T1 weighted images over considerably longer scan times. In the context of longitudinal studies, high repeatability is critically important because the goal is to measure temporal changes due to pathophysiology, not measurement variability.
As an important first step towards pre-clinical and clinical applications of AIR, we sought to improve the precision of AIR cardiac T1 mapping pulse sequence through flip angle and k-space optimizations and then compare the intra-scan repeatability in patients against investigational MOLLI.
Methods
This study describes three separate experiments that were conducted to increase the precision of AIR and compare the intra-scan repeatability between investigational MOLLI and optimized AIR in patients. For technical refinements for increasing precision, we conducted two separate experiments to suppress image artifacts through k-space ordering optimization and decrease the measurement variation through flip angle optimization. For rigorous evaluation in vivo, we compared the intra-scan repeatability between investigational MOLLI and optimized AIR in 35 patients who are scheduled to undergo clinical cardiovascular MRI.
Human Subjects
This study enrolled 55 human subjects in total as follows. For the first technical experiment on optimizing k-space ordering, we imaged 5 subjects (4 patients and 1 volunteer; 3 males, 2 females, mean age = 30.5 ± 19.6 years). For the second technical experiment on flip angle optimization, we imaged 15 human subjects (4 volunteers and 11 patients; 11 males, 4 females, mean age = 46.4 ± 14.8 years). For the third experiment on evaluating intra-scan repeatability, we imaged 35 patients (23 males, 12 females, mean age = 59.8 ± 13.6 years) who were scheduled to undergo clinical cardiovascular MRI. While the patients had mixed etiologies, none of them had prior history of myocardial infarction, which was later confirmed with late gadolinium-enhanced (LGE) MRI. Note that the exact etiologies are not important to this study. Blood was drawn from 35 patients immediately before the clinical MR exam for hematocrit calculation. Human imaging was performed in accordance with protocols approved by our Institutional Review Board; all subjects provided written informed consent.
MRI Hardware
MRI was conducted on a 3T whole-body MRI scanner (Verio, Siemens Healthcare, Erlangen, Germany) equipped with a gradient system capable of achieving a maximum gradient strength of 45 mT/m and a slew rate of 200 T/m/s. Radio-frequency (RF) excitation was performed using the body coil. Standard receiver coil arrays (typically 12-elements total) were employed for signal reception.
Pulse Sequence
Briefly, an AIR cardiac T1 mapping pulse sequence consists of two single-short image acquisitions in the following order: proton density weighted image in the first heart beat and T1 weighted image in the second heart beat (see Fig.3 in (17)). We implemented an AIR cardiac T1 mapping pulse sequence with balanced steady-state free precession (b-SSFP) readout with the following relevant imaging parameters: field of view = 340 mm × 255 mm (phase-encoding), image acquisition matrix = 192 × 144 (phase-encoding), TR = 2.7 ms, TE = 1.1 ms, spatial resolution = 1.8 mm × 1.8 mm, slice thickness = 8 mm, generalized autocalibrating partially parallel acquisitions (GRAPPA)(21) acceleration factor 1.8, receiver bandwidth = 930 Hz/pixel, saturation-recovery time delay (TD) = 600 ms, temporal resolution = 217 ms, and 30 dummy RF pulses with amplitude envelope in the shape of a Kaiser Bessel function (17). AIR cardiac T1 mapping acquisition was performed with breath-hold duration of 2-3 heart beats (depending on heart rate) and within “normal” specific absorption rate (SAR) limit (2 W/kg) with a 3-second cool down period.
Figure 3.
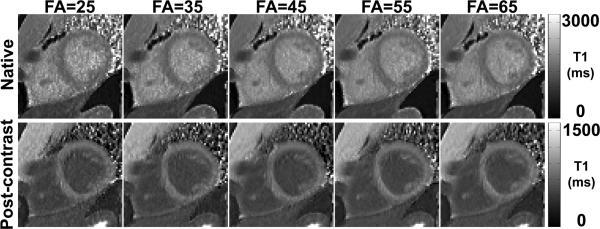
Native (top row) and post-contrast (bottom row) AIR T1 maps of a patient with flip angles ranging from 25-65° (columns 1-5). Increasing flip angles decreases apparent noise in T1 maps as shown.
Investigational 3-3-5 MOLLI cardiac T1 mapping pulse sequence (Siemens WIP #448) was performed with identical spatial resolution, receiver bandwidth, and parallel imaging factor as AIR. Notable MOLLI imaging parameters include FA = 35°, first TI = 133 ms, and TI increments = 80 ms (as inputs to the user interface). We note that 3-3-5 MOLLI acquires 11 T1 weighted images over 17 heartbeats, as previously described (10).
Experiment 1: k-space Ordering Optimization
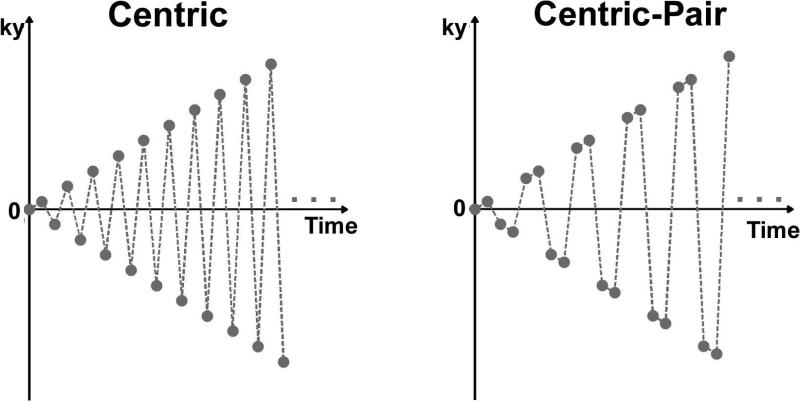
Original AIR cardiac T1 mapping calculates T1 based on the Bloch equation describing an ideal saturation recovery of magnetization because it uses a centric k-space ordering (17). Unfortunately, centric k-space ordering in b-SSFP readout is known to be sensitive to eddy currents arising from alternating positive and negative phase-encoding steps (22). In this study, we employed "paired" consecutive phase-encoding steps in centric k-space ordering (22)(a.k.a. centric-pair) to suppress image artifacts associated with eddy currents (23). We note that centric-pair k-space ordering does not alter the signal equation used to calculate T1, since in both centric and centric-pair k-space orderings the first radio-frequency excitation is used to acquire the center of k-space (see Figure 1). We also note that identical 30 dummy radio-frequency pulses are used for centric and centric-pair k-space orderings, so their difference in artifact is unrelated to signal oscillation on the approach to steady-state of magnetization.
Figure 1.
Centric (left) and centric-pair (right) k-space orderings for AIR cardiac T1 mapping.
For each of 5 subjects, we imaged 5 cardiac planes (apical short-axis, mid-ventricular short-axis, basal short-axis, 2-chamber long-axis, 4-chamber long-axis) using two different centric k-space ordering acquisitions with previously described flip angle of 35°. This experiment was conducted without administration of contrast agent, as eddy currents are not influenced by gadolinium. We regret that in one subject, we accidentally acquired only 3 cardiac (1 short-axis and 2 long-axis) planes. As such, this experiment yielded 23 cardiac planes in total. The objective of this experiment was to determine which centric k-space orderings produce fewer image artifacts induced by eddy currents. We then used the specific centric k-space ordering that produced fewer image artifacts for experiment 2.
Experiment 2: Flip Angle Optimization
For each of 15 subjects, we performed AIR cardiac T1 mapping in a mid-ventricular short-axis plane with flip angles ranging from 25-65° (10° steps), where 65° was the maximum value allowed within the SAR limit at 3T. AIR T1 mapping was performed pre-contrast and 15-30 min after administration of 0.15 mmol/kg of gadobenate dimeglumine (MultiHance, Bracco, Milan, Italy). The wide range in delayed imaging time (15-30 min) in patients was not by design, but it was unavoidable due to higher priority given to the clinical MRI protocol. Note that MultiHance is considered investigational use for imaging the heart. The objective of this experiment was to identify an optimal flip angle that achieves lower measurement variation while achieving same results obtained with flip angle 35°. We then used an optimal flip angle for experiment 3.
Experiment 3: Evaluation of Intra-Scan Repeatability
In 35 patients who are scheduled to undergo clinical cardiovascular MRI, both native and post-contrast 3-3-5 MOLLI and optimized AIR (an optimal k-space ordering and flip angle) acquisitions were repeated in a randomized order to calculate their intra-scan repeatability. Because this study was an add-on to a clinical examination, we did not remove the patient from the MR table. Each subject was imaged in a mid-ventricular short-axis plane pre-contrast and post-contrast. For each patient, we retrospectively estimated the mean R-R interval and mean variation in R-R interval based on the time stamps embedded on the 11 MOLLI digital imaging and communications in medicine (DICOM) images. Since each patient underwent 4 MOLLI acquisitions (pre- and post-contrast twice), the heart rate information represents “averaged” cardiac rhythm over 44 heart beats (11 heart beats times 4). Note that post-contrast MRI was conducted 15-30 min after administration of 0.15 mmol/kg of MultiHance. Again, the wide range in delayed imaging time was due to the clinical MRI protocol having priority.
Image Analysis
AIR T1 maps were calculated on a pixel-by-pixel basis, as previously described (21). In contrast to the previous study, we did not apply any filters to appreciate the impact of each optimization step. 3-3-5 MOLLI T1 maps were automatically generated in-line (Siemens WIP #448). Customized software in MATLAB (R2009a, The MathWorks, Inc., Natick, MA) was used to manually segment the myocardial contours and blood pools in the left ventricle for each data set separately. Care was taken to avoid partial volume averaging for each contour tracing.
Statistical Analysis
For experiment 1, we compared the resulting T1 maps between centric and centric-pair k-space orderings. Given that most of the artifacts were localized to the blood pool, we identified outliers within the ventricular cavity region-of-interest (ROI) as follows. For each cardiac plane, we drew an ROI to include the ventricular cavity only and pooled its T1 values to calculate the first quartile, third quartile, and interquartile range (IQR) values. Lower outliers were defined as values less than first quartile − 1.5 * IQR, and upper outliers were defined as values higher than third quartile + 1.5 * IQR. We then calculated the outlier fraction as outlier count divided by ROI size. A paired t-test was performed to compare the mean outlier fraction values between standard centric and centric-pair k-space orderings, where p < 0.05 was considered statistically significant.
For experiment 2, we calculated the mean and standard deviation of T1 for each ROI: native myocardial T1, native blood T1, post-contrast myocardial T1, and post-contrast blood T1. To compare flip angle dependence, we then averaged the mean T1 results over subjects to calculate the mean and standard deviations per measurement type as a function of flip angle. For each measurement type, we used analysis of variance (ANOVA) to test for differences in mean T1 between flip angles, and Bonferroni correction to compare between the control (previously used flip angle 35) and other flip angles, where a p-value < 0.05 was considered statistically significant. In addition, we performed the intra-class correlation (ICC) analysis to evaluate the association of mean T1 between flip angles. In this study without myocardial infarction, we used the standard deviation of T1 as a metric for measurement variation, because measuring "true" noise from GRAPPA reconstruction is not straightforward. We then averaged the mean standard deviations over subjects to evaluate the trend in measurement variation as a function of flip angle.
For experiment 3, we calculated the mean and standard deviation of T1 in 4 tissue types (native myocardium, native blood, post-contrast myocardium, post-contrast blood) and then calculated ECV expressed as (3): ΔR1,b×(1 − hematocrit) × 100%, where Δ is the difference between post-contrast and native, and R1,m is of myocardium and R1,b is of blood. For assessment of relative intra-scan repeatability in both T1 and ECV measurements, we performed a linear regression analysis between scan 1 and scan 2 for each pulse sequence. For assessment of absolute intra-scan repeatability in both T1 and ECV measurements, we performed the Bland-Altman analysis of repeated scans to calculate the coefficient of repeatability (CR), which is defined as 2 times the standard deviation of differences.
Results
Experiment 1: k-space Ordering Optimization
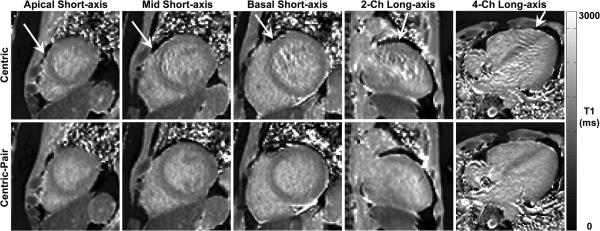
Figure 2 shows T1 maps of a patient in 5 different cardiac planes, where centric k-space ordering produced image artifacts associated with eddy currents, whereas centric-pair k-space ordering did not produce significant image artifacts. Comparing all 23 cardiac planes, outlier as a fraction of ventricular cavity area was significantly (p < 0.01) higher for centric (3.7 ± 2.0 %) than centric-pair (1.4 ± 1.1 %) k-space ordering. Note that a few outliers can affect the mean. Thus, the remaining results reported in this study were acquired with centric-pair k-space ordering.
Figure 2.
AIR T1 maps of a patient in 5 different cardiac planes: apical short-axis (column 1), mid-ventricular short-axis (column 2), basal short-axis (column 3), 2-chamber long-axis (column 4), and 4-chamber long-axis (column 5). In this patient, centric (top row) k-space ordering produced noticeable artifacts in all 5 planes, whereas centric-pair (bottom row) k-space ordering did not produce noticeable artifacts in any plane. Arrows point to image artifacts arising from eddy currents with centric-out k-space ordering in b-SSFP readout. All T1 maps displayed with an identical grayscale (0-3,000 ms).
Experiment 2: Flip Angle Optimization
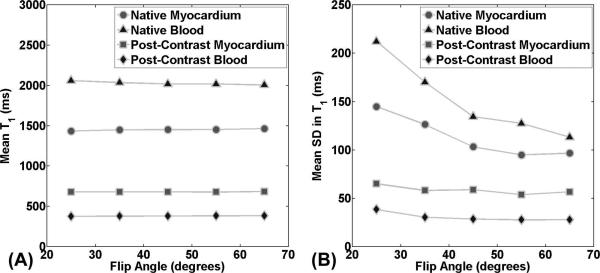
Figure 3 shows native and post-contrast AIR T1 maps of patient acquired with flip angles ranging from 25-65°. These T1 maps show decreased measurement variation with increasing flip angles, particularly for native T1 maps. Figure 4 shows plots of mean T1 as a function of flip angle, for each of 4 different types of measurement. According to ANOVA, mean T1 values were not different between flip angles ranging from 25-65°, and between 35° (control) and any other flip angle for each of 4 measurement types (native myocardial T1, native blood T1, post-contrast myocardial T1, and post-contrast blood T1). According to ICC, mean T1 values were strongly correlated with correlation coefficient ≥ 0.93 for all measurement types (Table 1). Figure 4 also shows plots of mean standard deviation of T1 as a function of flip angle. Note that standard deviation decreases with increasing flip angles. Averaging the SD over 4 measurement types, the mean SD was 122.1, 102.0, 85.4, 79.8, and 77.0 for flip angles 25°, 35°, 45°, 55° and 65°, respectively. Given the small difference in SD between 55° and 65° and the fact this study did not include a wide range of body habitus, we elected to use slightly inferior 55° for experiment 3 in consideration of scanning patients with cardiac implants such as stents.
Figure 4.
Plots of mean (A) and standard deviation (B) in T1 as a function of flip angle per measurement type (native myocardial T1, native blood T1, post-contrast myocardial T1, and post-contrast blood T1). Mean T1 was not significantly different for any of four measurement types (p ≥ 0.65) and strongly correlated across flip angles (ICC coefficient ≥ 0.93). Standard deviation in T1 decreases with flip angle, where the trend was greater for native T1 measurements.
Table 1.
Summary of mean T1 for each of 4 measurement types (native myocardial T1, native blood T1, post-contrast myocardial T1, and post-contrast blood T1), reported as mean ± standard deviation over subjects. According to ANOVA, mean T1 measurements were not different between flip angles (p ≥ 0.65). According to ICC, T1 measurements were strongly correlated (correlation coefficient ≥ 0.93).
| Measurement Type | FA=25° | FA=35° | FA=45° | FA=55° | FA=65° | ANOVA | ICC |
|---|---|---|---|---|---|---|---|
|
Native myocardial
T1 (ms) |
1435.2 ±
50.8 |
1449.8 ±
53.1 |
1450.2 ±
52.4 |
1453.2 ±
46.2 |
1464.7 ±
56.0 |
0.65 | 0.93 |
| Native blood T1 (ms) |
2060.9 ±
162.5 |
2035.8 ±
165.2 |
2019.3 ±
163.3 |
2019.1 ±
158.0 |
2006.0 ±
151.1 |
0.90 | 0.98 |
|
Post-contrast
myocardial T1 (ms) |
678.4 ±
98.6 |
678.0 ±
97.7 |
679.3 ±
94.6 |
677.6 ±
98.1 |
683.3 ±
97.7 |
0.99 | 0.99 |
|
Post-contrast blood
T1 (ms) |
374.9 ±
91.1 |
377.6 ±
90.7 |
378.8 ±
90.4 |
380.8 ±
89.1 |
381.9 ±
92.8 |
0.99 | 0.99 |
Experiment 3: Evaluation of Intra-scan Repeatability in Patients
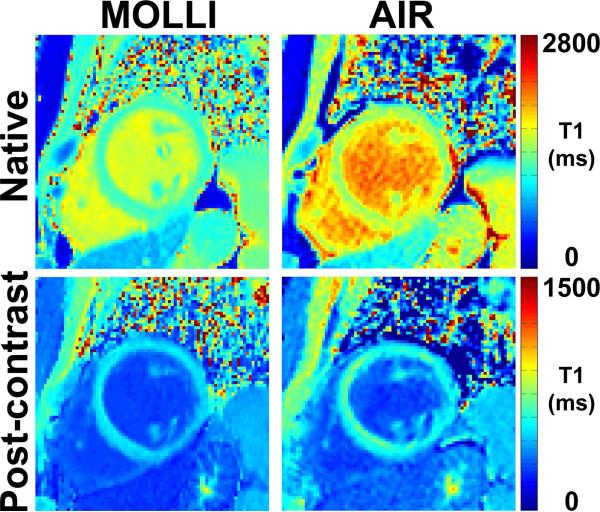
The 35 patients had a mixture of sinus and irregular rhythms; the mean R-R interval was 1020.2 ± 216.1 ms; the mean standard deviation of R-R interval was 101.8 ± 117.8 ms. Figure 5 shows representative native and post-contrast 3-3-5 MOLLI and optimized AIR T1 maps of a patient. Consistent with previous studies (see Fig.7 in (17) and Fig.3 in (19)), MOLLI and AIR produced different T1 results (17, 19).
Figure 5.
Representative T1 maps of a patient in a mid-ventricular short-axis view acquired with 3-3-5 MOLLI (left column) and optimized AIR (right column): native (top, left), post-contrast MOLLI (bottom, left), native AIR (top, right), and post-contrast AIR (bottom, right). Overall, image quality was similar between 3-3-5 MOLLI and optimized AIR.
Figure 7.
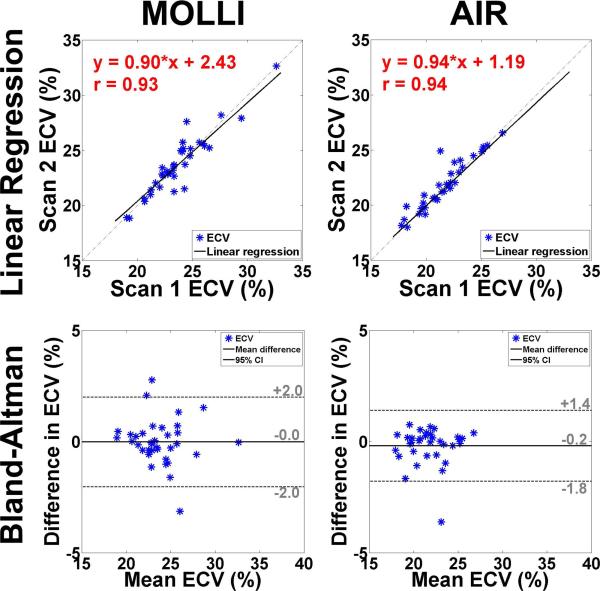
Linear regression (first row) and Bland-Altman (second row) plots comparing ECV measurements between MOLLI scan 1 vs. MOLLI scan 2 (column 1) and AIR scan 1 vs. AIR scan 2 (column 2). These scatter plots suggest that 3-3-5 MOLLI and optimized AIR produce similar relative and absolute intra-scan repeatability.
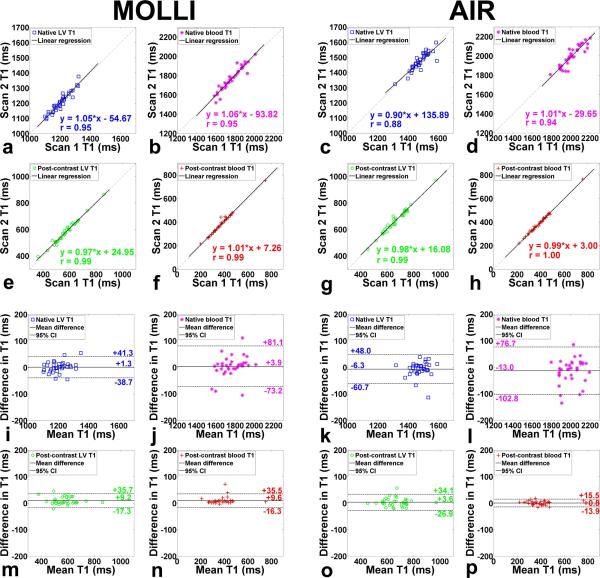
Table 2 shows the coefficient of variation (CV), defined as SD divided by mean, of native and post-contrast myocardial T1. Statistically, mean CV in myocardial T1 is significantly (p < 0.001) lower for MOLLI than optimized AIR, both for native and post-contrast conditions. These results confirm that investigational MOLLI produces higher precision than optimized AIR. In Figure 6, a - h show linear regression plots comparing MOLLI scan 1 vs. MOLLI scan 2 and AIR scan 1 vs. AIR scan 2, separately plotted for native myocardial, native blood, post-contrast myocardial, and post-contrast blood T1 measurements. For MOLLI, slope, bias, and Pearson's correlation coefficient (r) were 1.05, −54.67, and 0.95 for native myocardium; 1.06, −93.82, and 0.95 for native blood; 0.97, 24.95, and 0.99 for post-contrast myocardium; 1.01, 7.26, and 0.99 for post-contrast blood, respectively. For AIR, slope, bias, and r were 0.90, 135.89, and 0.88 for native myocardium; 1.01, −29.65, and 0.94 for native blood; 0.98, 16.08, and 0.99 for post-contrast myocardium; 0.99, 3.00, and 1.00 for post-contrast blood, respectively. These statistics suggest that 3-3-5 MOLLI and optimized AIR produce similar relative intra-scan repeatability. In Figure 6, i - p also show the corresponding Bland-Altman plots. For MOLLI, the CR was 40.0, 77.2, 26.5 and 25.9 ms for native myocardial, native blood, post-contrast myocardial, and post-contrast blood T1 measurements, respectively. For AIR, the CR was 54.3, 89.7, 30.5, and 14.7 ms for native myocardial, native blood, post-contrast myocardial, and post-contrast blood T1 measurements, respectively. These statistics suggest that 3-3-5 MOLLI and optimized AIR produce similar absolute intra-scan repeatability. Figure 7 shows linear regression (first row) and corresponding Bland-Altman (second row) plots comparing scan 1 and scan 2 in 3-3-5 MOLLI (column 1) and optimized AIR (column 2), separately plotted for ECV measurements. For MOLLI, slope, bias, and r were 0.90, 2.43, and 0.93, respectively, and the CR was 2.0%. For AIR, slope, bias, and r were 0.94, 1.19, and 0.94, respectively, and the CR was 1.6%. These statistics also suggest that 3-3-5 MOLLI and optimized AIR produce similar relative and absolute intra-scan repeatability in ECV measurements.
Table 2.
Summary of mean, SD, and CV of native and post-contrast myocardial T1 for investigational MOLLI and optimized AIR. For native myocardial T1, the mean CV was significantly (p < 0.001) lower for investigational MOLLI (3.8 ± 1.2 %) than optimized AIR (6.5 ± 1.8 %). For post-contrast myocardial T1, the mean CV was significantly (p < 0.001) lower for investigational MOLLI (4.1 ± 1.1 %) than optimized AIR (7.4 ± 1.6 %). Note that it is difficult to compare CV between native and post-contrast, because of the difference in mean T1.
| No. | Investigational MOLLI | Optimized AIR | ||||||||||
|---|---|---|---|---|---|---|---|---|---|---|---|---|
| Native | Post-contrast | Native | Post-contrast | |||||||||
| Mean (ms) |
SD (ms) |
CV (%) |
Mean (ms) |
SD (ms) |
CV (%) |
Mean (ms) |
SD (ms) |
CV (%) |
Mean (ms) |
SD (ms) |
CV (%) |
|
| 1 | 1192.2 | 44.0 | 3.7 | 434.9 | 23.2 | 5.3 | 1519.3 | 90.5 | 6.0 | 515.9 | 45.4 | 8.8 |
| 2 | 1149.2 | 45.0 | 3.9 | 567.6 | 17.9 | 3.2 | 1422.6 | 72.7 | 5.1 | 619.2 | 45.4 | 7.3 |
| 3 | 1122.9 | 39.4 | 3.5 | 614.7 | 19.4 | 3.2 | 1430.0 | 58.7 | 4.1 | 778.3 | 46.4 | 6.0 |
| 4 | 1172.7 | 39.4 | 3.4 | 546.6 | 17.4 | 3.2 | 1504.6 | 72.6 | 4.8 | 649.3 | 40.5 | 6.2 |
| 5 | 1110.3 | 46.3 | 4.2 | 596.5 | 17.2 | 2.9 | 1503.8 | 87.7 | 5.8 | 741.7 | 42.0 | 5.7 |
| 6 | 1221.7 | 44.8 | 3.7 | 602.7 | 33.7 | 5.6 | 1484.5 | 96.7 | 6.5 | 724.8 | 42.9 | 5.9 |
| 7 | 1171.1 | 44.7 | 3.8 | 623.6 | 21.8 | 3.5 | 1432.5 | 83.2 | 5.8 | 754.0 | 35.0 | 4.6 |
| 8 | 1123.4 | 36.1 | 3.2 | 579.3 | 18.4 | 3.2 | 1427.5 | 59.6 | 4.2 | 715.5 | 39.2 | 5.5 |
| 9 | 1197.2 | 76.7 | 6.4 | 569.3 | 27.4 | 4.8 | 1519.3 | 86.8 | 5.7 | 660.7 | 51.0 | 7.7 |
| 10 | 1165.5 | 26.0 | 2.2 | 499.0 | 19.7 | 3.9 | 1505.7 | 86.7 | 5.8 | 604.0 | 41.8 | 6.9 |
| 11 | 1217.9 | 39.9 | 3.3 | 561.5 | 22.6 | 4.0 | 1457.6 | 136.2 | 9.3 | 644.5 | 64.9 | 10.1 |
| 12 | 1184.4 | 39.6 | 3.3 | 502.9 | 28.2 | 5.6 | 1469.6 | 86.9 | 5.9 | 599.8 | 56.6 | 9.4 |
| 13 | 1201.2 | 53.1 | 4.4 | 667.5 | 21.5 | 3.2 | 1455.7 | 153.2 | 10.5 | 731.9 | 60.0 | 8.2 |
| 14 | 1258.2 | 78.1 | 6.2 | 361.2 | 25.1 | 7.0 | 1566.2 | 113.2 | 7.2 | 452.8 | 36.7 | 8.1 |
| 15 | 1211.0 | 35.9 | 3.0 | 566.8 | 17.5 | 3.1 | 1530.4 | 72.1 | 4.7 | 664.0 | 41.5 | 6.3 |
| 16 | 1154.7 | 78.4 | 6.8 | 491.1 | 20.5 | 4.2 | 1427.9 | 111.3 | 7.8 | 599.7 | 46.2 | 7.7 |
| 17 | 1158.7 | 70.5 | 6.1 | 663.8 | 33.5 | 5.1 | 1503.4 | 120.1 | 8.0 | 730.9 | 54.4 | 7.4 |
| 18 | 1130.3 | 58.1 | 5.1 | 583.9 | 19.4 | 3.3 | 1449.5 | 113.6 | 7.8 | 743.3 | 44.2 | 5.9 |
| 19 | 1111.3 | 33.9 | 3.0 | 531.1 | 25.9 | 4.9 | 1422.9 | 68.8 | 4.8 | 650.0 | 60.4 | 9.3 |
| 20 | 1164.2 | 30.1 | 2.6 | 527.5 | 15.5 | 2.9 | 1499.7 | 54.0 | 3.6 | 644.4 | 37.2 | 5.8 |
| 21 | 1202.9 | 48.8 | 4.1 | 600.8 | 25.6 | 4.3 | 1314.9 | 129.3 | 9.8 | 709.6 | 61.5 | 8.7 |
| 22 | 1135.1 | 34.6 | 3.0 | 494.9 | 16.1 | 3.2 | 1472.3 | 56.0 | 3.8 | 573.3 | 29.7 | 5.2 |
| 23 | 1237.4 | 29.8 | 2.4 | 734.6 | 21.3 | 2.9 | 1590.2 | 82.3 | 5.2 | 750.6 | 54.0 | 7.2 |
| 24 | 1283.3 | 44.8 | 3.5 | 483.5 | 24.9 | 5.2 | 1535.6 | 98.2 | 6.4 | 568.2 | 47.6 | 8.4 |
| 25 | 1283.3 | 45.3 | 3.5 | 592.1 | 23.1 | 3.9 | 1535.0 | 129.3 | 8.4 | 660.7 | 51.6 | 7.8 |
| 26 | 1318.9 | 55.1 | 4.2 | 643.1 | 42.7 | 6.6 | 1465.7 | 128.0 | 8.7 | 745.1 | 77.5 | 10.4 |
| 27 | 1225.5 | 34.8 | 2.8 | 860.4 | 24.5 | 2.8 | 1409.3 | 93.9 | 6.7 | 968.5 | 74.7 | 7.7 |
| 28 | 1221.3 | 59.9 | 4.9 | 551.5 | 24.4 | 4.4 | 1480.7 | 74.6 | 5.0 | 621.1 | 44.8 | 7.2 |
| 29 | 1275.0 | 41.3 | 3.2 | 638.2 | 19.8 | 3.1 | 1526.1 | 134.0 | 8.8 | 719.7 | 54.7 | 7.6 |
| 30 | 1217.0 | 33.0 | 2.7 | 560.5 | 17.0 | 3.0 | 1480.9 | 83.4 | 5.6 | 627.3 | 34.2 | 5.4 |
| 31 | 1310.9 | 42.1 | 3.2 | 536.3 | 26.9 | 5.0 | 1515.4 | 78.5 | 5.2 | 581.2 | 26.0 | 4.5 |
| 32 | 1198.7 | 66.8 | 5.6 | 658.7 | 31.4 | 4.8 | 1499.5 | 131.0 | 8.7 | 731.8 | 63.5 | 8.7 |
| 33 | 1257.7 | 34.8 | 2.8 | 496.0 | 20.0 | 4.0 | 1453.2 | 115.7 | 8.0 | 583.5 | 50.0 | 8.6 |
| 34 | 1321.6 | 45.0 | 3.4 | 512.2 | 24.1 | 4.7 | 1584.9 | 123.5 | 7.8 | 563.4 | 47.4 | 8.4 |
| 35 | 1 227.8 | 38.4 | 3.1 | 508.6 | 21.1 | 4.1 | 1480.7 | 86.5 | 5.8 | 563.8 | 61.1 | 10.8 |
Figure 6.
Linear regression plots (rows 1-2) comparing T1 measurements in four different tissue types between MOLLI scan 1 vs. MOLLI scan 2 (columns 1-2) and AIR scan 1 vs. AIR scan 2 (columns 3-4) . These scatter plots suggest that 3-3-5 MOLLI and optimized AIR produce similar relative intra-scan repeatability. Bland-Altman plots (rows 3-4) comparing T1 measurements in four different tissue types between MOLLI scan 1 vs. MOLLI scan 2 (columns 1-2) and AIR scan 1 vs. AIR scan 2 (columns 3-4). These scatter plots suggest that 3-3-5 MOLLI and optimized AIR produce similar absolute intra-scan repeatability. Four tissue types are: native myocardium (red box) - a, c, i, and k; native blood (purple star) - b, d, j, and l; post-contrast myocardium (green circle) - e, g, m, and o; post-contrast blood (red cross) - f, h, n, and p.
Discussion
In this study, we sought to improve the precision of AIR cardiac T1 mapping through k-space ordering and flip angle optimizations and then compare the intra-scan repeatability in patients with respect to investigational MOLLI. In the first technical experiment, we show that employing centric-pair k-space ordering suppresses image artifacts associated with eddy currents. In the second technical experiment, we show that increasing flip angle up to 65° reduces standard deviation in T1 while producing results that are not significantly different compared with those produced by previously used flip angle 35°. In the validation experiment, we show that investigational MOLLI and optimize AIR produce similar intra-scan repeatability in all 35 patients.
Original AIR cardiac T1 mapping calculates T1 based on the Bloch equation describing an ideal saturation recovery of magnetization because it uses a centric k-space ordering. In b-SSFP readout, however, this k-space ordering is sensitive to eddy currents induced by alternative positive and negative phase-encoding steps in b-SSFP readout. We suppressed this artifact using centric-pair k-space ordering. Artifact suppression is important to minimize measurement errors. Regrettably, original AIR was developed using 35° flip angle, without carefully examining other flip angle values. In this study, we further improved the precision through flip angle optimization, where any flip angle between 55° and 65° was shown to produce high precision while producing results that are not significantly different compared with those produced by previously used flip angle 35°. For this study, we elected to use flip angle 55°, even though 65° is superior, in consideration of scanning patients with cardiac implants such as stents. A larger study including a wide range of body habitus is necessary to determine the maximal flip angle allowed within the SAR limit at 3T.
This study has several additional points worth discussing. First, we did not evaluate the performance of other investigational saturation-recovery based cardiac T1 mapping pulse sequences reported in literature, such as SASHA (12), MLLSR (14), and SMARTT1Map (15). Thus, results from this study may not be directly applicable for the aforementioned pulse sequences. Compared with SASHA, MLLSR, and SMARTT1Map, AIR is considerably faster because it acquires only two images. However, AIR is likely to be inferior in precision, since SASHA, MLLSR, and SMARTT1Map acquire more T1 weighted images over longer scan times. Another study is warranted to directly compare the intra-scan repeatabiliity between optimized AIR and other investigational saturation-recovery based cardiac T1 mapping pulse sequences. Second, we elected to use 55° to achieve a good balance between precision and SAR at 3T. Flip angle 55°, however, may not be optimal at 1.5T, since T1 and T2 values and SAR limits are different at lower field strength. Another investigation is needed to empirically determine the optimal flip angles at 1.5T. Third, for the validation experiment, the mean standard deviation of R-R interval was only 10% of mean R-R interval (1020.2 ms). Another study is warranted to compare the intra-scan repeatability between investigational MOLLI and optimized AIR in patients with higher burden of arrhythmia. Fourth, as previously reported (17, 19), AIR and MOLLI mapping pulse sequences produce different T1 and ECV measurements. This is consistent with previous studies which reported that different cardiac T1 mapping methods produce different T1 and ECV results (13, 16, 24). Different T1 measurements may produce different ECV measurements, suggesting that it is important to calibrate cutoff values for each T1 mapping pulse sequence. Fifth, for practical consideration, this study evaluated intra-scan repeatability only. A future investigation is warranted to evaluate inter-scan repeatability. Sixth, we compared the performance of original AIR and optimized AIR in two patients without contrast agent administration. Consistent with other results reported in this study, optimized AIR produced the lower CV in native myocardial and blood T1 values (see Figure S1 and Table S1 in Supplementary Materials). Seventh, consistent with previous studies (16, 18), investigational MOLLI produced higher precision within an ROI than optimized AIR (see Table 2). Our study also shows that optimized AIR and investigational MOLLI produce similar intra-scan repeatability of mean T1 measurements, likely due to spatial averaging within an ROI. However, this trend could become invalid if the number of voxels within an ROI becomes too small.
In conclusion, this study demonstrates two technical upgrades aimed to improve the precision of AIR cardiac T1 mapping. First, centric-pair k-space ordering suppresses image artifacts associated with eddy currents. Second, an optimal flip angle (55°) decreases standard deviation in T1 measurements while producing results that are not significantly different compared with those produced by previously used 35°. Our initial study of 35 patients shows that investigational MOLLI and optimized AIR produce similar intra-scan repeatability. Note that high repeatability is important for longitudinal studies, where the goal is to monitor temporal changes that reflect pathophysiology, not intra-scan repeatability. Finally, optimized AIR cardiac T1 mapping is likely to yield higher repeatability than original AIR cardiac T1 mapping for pre-clinical and clinical applications.
Supplementary Material
Acknowledgements
The authors are grateful for funding support from the NIH (HL116895-01A1, HL117888) and the American Heart Association (14GRNT18350028).
List of Abbreviations
- T1
longitudinal relaxation time
- T2
transverse relaxation time
- LV
left ventricle
- ECV
extracellular volume fraction
- MOLLI
modified Look-Locker Inversion-recovery
- ShMOLLI
shortened modified Look-Locker Inversion-recovery
- SASHA
saturation-recovery single-shot acquisition
- MLLSR
modified Look-Locker acquisition with saturation recovery
- SMARTT1Map
saturation method using adaptive recovery times for cardiac T1 mapping
- SAPPHIRE
saturation pulse prepared heart rate independent inversion recovery
- AIR
arrhythmia-insensitive-rapid
- LGE
late gadolinium enhancement
- RF
radio-frequency
- b-SSFP
balanced steady state of free precession
- GRAPPA
generalized autocalibrating partially parallel acquisitions
- TE
echo time
- TR
repetition time
- TD
saturation-recovery time delay
- TI
inversion time
- RF
radio-frequency
- DICOM
digital imaging and communication in medicine
- ROI
region of interest
- IQR
interquartile range
- ANOVA
analysis of variance
- ICC
intra-class correlation
- CR
coefficient of repeatability
- SAR
specific absorption rate
- CV
coefficient of variation
Bibliography & References Cited
- 1.Iles L, Pfluger H, Phrommintikul A, Cherayath J, Aksit P, Gupta SN, Kaye DM, Taylor AJ. Evaluation of diffuse myocardial fibrosis in heart failure with cardiac magnetic resonance contrast-enhanced T1 mapping. J Am Coll Cardiol. 2008;52(19):1574–80. doi: 10.1016/j.jacc.2008.06.049. [DOI] [PubMed] [Google Scholar]
- 2.Sibley CT, Noureldin RA, Gai N, Nacif MS, Liu S, Turkbey EB, Mudd JO, van der Geest RJ, Lima JA, Halushka MK, Bluemke DA. T1 Mapping in Cardiomyopathy at Cardiac MR: Comparison with Endomyocardial Biopsy. Radiology. 2012;265(3):724–32. doi: 10.1148/radiol.12112721. [DOI] [PMC free article] [PubMed] [Google Scholar]
- 3.Miller CA, Naish JH, Bishop P, Coutts G, Clark D, Zhao S, Ray SG, Yonan N, Williams SG, Flett AS, Moon JC, Greiser A, Parker GJ, Schmitt M. Comprehensive validation of cardiovascular magnetic resonance techniques for the assessment of myocardial extracellular volume. Circ Cardiovasc Imaging. 2013;6(3):373–83. doi: 10.1161/CIRCIMAGING.112.000192. [DOI] [PubMed] [Google Scholar]
- 4.Flett AS, Hayward MP, Ashworth MT, Hansen MS, Taylor AM, Elliott PM, McGregor C, Moon JC. Equilibrium contrast cardiovascular magnetic resonance for the measurement of diffuse myocardial fibrosis: preliminary validation in humans. Circulation. 2010;122(2):138–44. doi: 10.1161/CIRCULATIONAHA.109.930636. [DOI] [PubMed] [Google Scholar]
- 5.Kehr E, Sono M, Chugh SS, Jerosch-Herold M. Gadolinium-enhanced magnetic resonance imaging for detection and quantification of fibrosis in human myocardium in vitro. Int J Cardiovasc Imaging. 2008;24(1):61–8. doi: 10.1007/s10554-007-9223-y. [DOI] [PubMed] [Google Scholar]
- 6.Jerosch-Herold M, Sheridan DC, Kushner JD, Nauman D, Burgess D, Dutton D, Alharethi R, Li D, Hershberger RE. Cardiac magnetic resonance imaging of myocardial contrast uptake and blood flow in patients affected with idiopathic or familial dilated cardiomyopathy. Am J Physiol Heart Circ Physiol. 2008;295(3):H1234–H42. doi: 10.1152/ajpheart.00429.2008. [DOI] [PMC free article] [PubMed] [Google Scholar]
- 7.White SK, Sado DM, Fontana M, Banypersad SM, Maestrini V, Flett AS, Piechnik SK, Robson MD, Hausenloy DJ, Sheikh AM, Hawkins PN, Moon JC. T1 Mapping for Myocardial Extracellular Volume Measurement by CMR: Bolus Only Versus Primed Infusion Technique. JACC Cardiovasc Imaging. 2013 doi: 10.1016/j.jcmg.2013.01.011. [DOI] [PubMed] [Google Scholar]
- 8.Arheden H, Saeed M, Higgins CB, Gao DW, Bremerich J, Wyttenbach R, Dae MW, Wendland MF. Measurement of the distribution volume of gadopentetate dimeglumine at echo-planar MR imaging to quantify myocardial infarction: comparison with 99mTc-DTPA autoradiography in rats. Radiology. 1999;211(3):698–708. doi: 10.1148/radiology.211.3.r99jn41698. [DOI] [PubMed] [Google Scholar]
- 9.Kramer CM, Chandrashekhar Y, Narula J. T1 mapping by CMR in cardiomyopathy: a noninvasive myocardial biopsy? JACC Cardiovasc Imaging. 2013;6(4):532–4. doi: 10.1016/j.jcmg.2013.02.002. [DOI] [PubMed] [Google Scholar]
- 10.Messroghli DR, Radjenovic A, Kozerke S, Higgins DM, Sivananthan MU, Ridgway JP. Modified Look-Locker inversion recovery (MOLLI) for high-resolution T1 mapping of the heart. Magn Reson Med. 2004;52(1):141–6. doi: 10.1002/mrm.20110. [DOI] [PubMed] [Google Scholar]
- 11.Piechnik SK, Ferreira VM, Dall'Armellina E, Cochlin LE, Greiser A, Neubauer S, Robson MD. Shortened Modified Look-Locker Inversion recovery (ShMOLLI) for clinical myocardial T1-mapping at 1.5 and 3 T within a 9 heartbeat breathhold. J Cardiovasc Magn Reson. 2010;12:69. doi: 10.1186/1532-429X-12-69. [DOI] [PMC free article] [PubMed] [Google Scholar]
- 12.Chow K, Flewitt JA, Green JD, Pagano JJ, Friedrich MG, Thompson RB. Saturation recovery single-shot acquisition (SASHA) for myocardial T1 mapping. Magnetic Resonance in Medicine. 2014;71(6):2082–95. doi: 10.1002/mrm.24878. [DOI] [PubMed] [Google Scholar]
- 13.Robson MD, Piechnik SK, Tunnicliffe EM, Neubauer S. T1 measurements in the human myocardium: The effects of magnetization transfer on the SASHA and MOLLI sequences. Magn Reson Med. 2013;70(3):664–70. doi: 10.1002/mrm.24867. [DOI] [PubMed] [Google Scholar]
- 14.Song T, Stainsby JA, Ho VB, Hood MN, Slavin GS. Flexible cardiac T1 mapping using a modified Look-Locker acquisition with saturation recovery. Magn Reson Med. 2012;67(3):622–7. doi: 10.1002/mrm.24137. [DOI] [PubMed] [Google Scholar]
- 15.Slavin G, Stainsby J. True T1 mapping with SMART1Map (saturation method using adaptive recovery times for cardiac T1 mapping): a comparison with MOLLI. Journal of Cardiovascular Magnetic Resonance. 2013;15(Suppl 1):P3. [Google Scholar]
- 16.Roujol S, Weingartner S, Foppa M, Chow K, Kawaji K, Ngo LH, Kellman P, Manning WJ, Thompson RB, Nezafat R. Accuracy, precision, and reproducibility of four T1 mapping sequences: a head-to-head comparison of MOLLI, ShMOLLI, SASHA, and SAPPHIRE. Radiology. 2014;272(3):683–9. doi: 10.1148/radiol.14140296. [DOI] [PMC free article] [PubMed] [Google Scholar]
- 17.Fitts M, Breton E, Kholmovski EG, Dosdall DJ, Vijayakumar S, Hong KP, Ranjan R, Marrouche NF, Axel L, Kim D. Arrhythmia insensitive rapid cardiac T1 mapping pulse sequence. Magn Reson Med. 2013;70(5):1274–82. doi: 10.1002/mrm.24586. [DOI] [PubMed] [Google Scholar]
- 18.Kellman P, Hansen MS. T1-mapping in the heart: accuracy and precision. J Cardiovasc Magn Reson. 2014;16(1):2. doi: 10.1186/1532-429X-16-2. [DOI] [PMC free article] [PubMed] [Google Scholar]
- 19.Hong K, Kim D. MOLLI and AIR T1 mapping pulse sequences yield different myocardial T1 and ECV measurements. NMR Biomed. 2014;27(11):1419–26. doi: 10.1002/nbm.3221. [DOI] [PMC free article] [PubMed] [Google Scholar]
- 20.Kim D, Oesingmann N, McGorty K. Hybrid adiabatic-rectangular pulse train for effective saturation of magnetization within the whole heart at 3 T. Magn Reson Med. 2009;62(6):1368–78. doi: 10.1002/mrm.22140. [DOI] [PMC free article] [PubMed] [Google Scholar]
- 21.Griswold MA, Jakob PM, Heidemann RM, Nittka M, Jellus V, Wang J, Kiefer B, Haase A. Generalized autocalibrating partially parallel acquisitions (GRAPPA) Magnetic Resonance in Medicine. 2002;47(6):1202–10. doi: 10.1002/mrm.10171. [DOI] [PubMed] [Google Scholar]
- 22.Bieri O, Markl M, Scheffler K. Analysis and compensation of eddy currents in balanced SSFP. Magn Reson Med. 2005;54(1):129–37. doi: 10.1002/mrm.20527. [DOI] [PubMed] [Google Scholar]
- 23.Markl M, Leupold J, Bieri O, Scheffler K, Hennig J. Double average parallel steady-state free precession imaging: optimized eddy current and transient oscillation compensation. Magn Reson Med. 2005;54(4):965–74. doi: 10.1002/mrm.20615. [DOI] [PubMed] [Google Scholar]
- 24.Hong KP, Kholmovski EG, McGann CJ, Ranjan R, Kim D. Comparison of canine ECV measurements derived from CMR: bolus injection vs. slow infusion of Gd-BOPTA. Journal of Cardiovascular Magnetic Resonance. 2014;16(Suppl 1):P64. [Google Scholar]
Associated Data
This section collects any data citations, data availability statements, or supplementary materials included in this article.


