Abstract
T and B lymphocytes undergo metabolic re-programming upon activation that is essential to allow bioenergetics, cell survival, and intermediates for cell proliferation and function. To support changes in the activity of signaling pathways and to provide sufficient and necessary intracellular metabolites, uptake of extracellular nutrients increases sharply with metabolic re-programming. One result of increased metabolic activity can be reactive oxygen species (ROS), which can be toxic when accumulated in excess. Uptake of cystine allows accumulation of cysteine that is necessary for glutathione synthesis and ROS detoxification. Cystine uptake is required for T cell activation and function but measurements based on radioactive labeling do not allow analysis on single cell level. Here we show the critical role for cystine uptake in T cells using a method for measurement of cystine uptake using a novel CystineFITC probe. T cell receptor stimulation lead to upregulation of the cystine transporter xCT (SLC7a11) and increased cystine uptake in CD4+ and CD8+ human T cells. Similarly, lipopolysaccharide stimulation increased cystine uptake in human B cells. The CystineFITC probe was not toxic and could be metabolized to prevent cystine starvation induced cell death. Furthermore, blockade of xCT or competition with natural cystine decreased uptake of CystineFITC. CystineFITC is thus a versatile tool that allows measurement of cystine uptake on single cell level and shows the critical role for cystine uptake for T cell ROS regulation and activation.
Keywords: T cells, xCT, Cystine, CystineFITC, Reactive oxygen species (ROS), Metabolism
1. Introduction
Cell survival and proliferation requires adequate uptake of a wide range of nutrients whose dynamics support and mirror the metabolic activity of the cell. It is important, therefore, to develop robust methods to measure nutrient uptake through transporter proteins. Uptake of nutrients such as glucose, glutamine or cystine is often measured using radioactive-labeled substrates. These approaches provide a robust readout, however lack single-cell resolution and applicability in in vivo systems. Fluorescent probes to measure nutrient uptake, such as the glucose analog 2-(N-(7-nitrobenz-2-oxa-1,3-diazol-4-yl)amino)-2-deoxyglucose (2-NBDG) or folate conjugated to fluorescent Texas red (Sandoval et al., 2004) allow measurement on single cell level and can be utilized by various technologies, such as flow cytometry or fluorescent microscopy. However, fluorescent probes allowing measurement of amino acid uptake on single cell level are less developed.
Cysteine is a nonessential amino acid that is critical to maintain cellular redox balance. In the predominantly oxidative extracellular environment cysteine exists primarily in form of cystine, a covalent dimer of cysteine molecules. Accordingly, the concentration of plasma cysteine is approximately ten times lower than that of cystine (Yan & Banerjee, 2010) and uptake of cystine is mediated via cystine transporters. After the uptake of cystine into the cytoplasm, the reducing intracellular environment leads to a separation of one cystine molecule into two cysteine molecules (Arner & Holmgren, 2000; Garg et al., 2011). Cellular uptake of cystine is mediated by system , an amino acid antiporter mediating the exchange of extracellular cystine and intracellular glutamate (Garg et al., 2011; Bridges et al., 2012). consists of a 4F2 heavy chain and a light chain xCT (Slc7a11) (Lewerenz et al., 2013).
A key function of cysteine is to maintain the cellular pools of glutathione (GSH), which is a critical regulator of reactive oxygen species (ROS) homeostasis in mammalian cells (Lu, 2009). Cysteine insufficiency leads to GSH depletion, ROS accumulation and cell death (Aquilano et al., 2014). Therefore, blockade of xCT to increase cellular ROS and induce cell death in cancer cells has been tested as potential anti-tumor therapy. The xCT inhibitor sulfasalazine (SAS) increased cellular ROS, depleted GSH and led to cell death in several cancer models including lung cancer (Guan et al., 2009), lymphoma (Dai et al., 2014; Gout et al., 2001), renal cell carcinoma (Tang et al., 2016), malignant glioma (Chung et al., 2005) and breast cancer (Narang et al., 2003). However, nonmalignant cells, such as proliferating lymphocytes also require sufficient levels of GSH to ensure proper ROS balance. Resting T cells do not express xCT and their low demand on cysteine is provided by other cells, such as antigen presenting cells that can release cysteine upon activation (Angelini et al., 2002). However, T cell receptor (TCR) activation leads to increased production of ROS and activated T cells induce high levels of xCT (Garg et al., 2011). Cystine uptake is required for T cell activation (Srivastava et al., 2010) and activated T cells require extracellular cystine for proliferation (Levring et al., 2012) and DNA synthesis (Levring et al., 2015). Autoreactive T cells depend on cystine uptake as pharmacologic blockade attenuates experimental autoimmune encephalomyelitis (EAE) and Slc7a11-deficient mice are protected from EAE (Evonuk et al., 2015). Interestingly, myeloid derived suppressor cells (MDSC) are proposed to block T cells in part by depleting extracellular cystine that impairs anti-tumor T cell response (Srivastava et al., 2010).
In this study, we present a novel approach to measure cystine uptake on single cell level. We synthesized a fluorescent cystine analog and demonstrated its uptake in stimulated T cells as well as other cell types. The probe was transported into cells in xCT specific manner, as both blockade of xCT and competition with unlabeled cystine decreased the measured fluorescence. We also demonstrate, that both conventional and imaging flow cytometry as well as fluorescent microcopy can be utilized to measure cystine uptake on single cell level and that cystine transport is critical for T cell activation.
2. Materials and methods
2.1. Cells and cell culture
Peripheral blood mononuclear cells (PMBCs) from de-identified healthy donors were isolated by density gradient centrifugation. Only fresh cells were used for subsequent cell culture. PBMCs were cultured for indicated times in complete RPMI with 10% FBS, 1% Pen-Strep and stimulated by addition of anti-CD3 (eBioscience) or LPS (Sigma Aldrich). BEAS2B human epithelial cells were stably transfected with empty vector or xCT. Erastin and (S)-4-Carboxyphenylglycine (S4-CPG) treatment was performed on PMBCs at indicated concentrations for 1 h or 3 days. Treatment with 0.5 mM sulfasalazine (SAS) was performed 3 h prior to exposure to CystineFITC. For competition experiments, cells were incubated with CystineFITC with or without 0.5 mM unlabeled cystine (Sigma Aldrich). For selected experiments, CD8+ T cells were isolated using magnetic-bead based column separation (Miltenyi). MDA-MB-231 cells were cultured in DMEM, 10% dialyzed FBS (Sigma, F0392) and PenStrep with or without unlabeled cystine and indicated treatments.
2.2. CystineFITC probe
For detailed experimental procedure, refer to Fig. 2. Briefly, commercially available L-cystine bis-(t-butyl ester) dihydrochloride was mono N-Boc protected. The resulting intermediate was then coupled through a thioamide linkage to commercially available fluorescein 5-isothiocyanate to complete the synthesis. To measure cystine uptake of human T cells, B cells and BEAS2B cells, cells were subject to one hour starve in Krebs buffer (115 mM NaCl, 2 mM KCl, 25 mM NaHCO3, 1 mM MgCl2, 0.25% BSA, pH 7.4) at 37 °C. After starve, CystineFITC was dissolved in Krebs buffer and added to cell suspension in indicated concentration with or without additional staining of cell surface molecules. Cells were incubated for indicated times at 37 °C. Subsequently, cells subjected to conventional or imaging flow cytometry were washed twice in ice-cold PBS and re-suspended in flow cytometry buffer. For confocal microscopy, cells were treated with 150uM CystineFITC for 3 h.
Fig. 2.
Synthesis of CystineFITC probe. (A) To a cooled (0 °C) suspension of commercially available L-cystine bis-(t-butyl ester) dihydrochloride (1, 116.2 mg, 0.273 mmol) in CH2Cl2 (5 mL), was added Et3N (100 μL, 0.717 mmol) and a solution of Boc anhydride (178.7 mg, 0.819 mmol) in CH2Cl2 (1 mL). After stirring for 3 h at 0 °C, methylamine (2.0 M in THF, 2 mL) was added. After stirring for 1 h at 25 °C, the reaction was quenched by the addition of saturated NaHCO3. The layers were separated and the aqueous layer was extracted with CH2Cl2. The combined organic layers were dried over anhydrous Na2SO4 and concentrated in vacuo. The residue was purified by column chromatography (silica gel, EtOAc/hexanes = 1/1) to afford 2 (63.9 mg, 52%): 1H NMR (500 MHz, CDCl3) δ 5.40 (d, J = 7.5 Hz, 1H), 4.47–4.48 (m, 2H), 3.66 (dd, J = 7.5, 4.5 Hz, 2H), 3.23 (dd, J = 13.5, 4.5 Hz, 2H), 3.09–3.14 (m, 4H), 2.87 (dd, J = 13.5, 7.5 Hz, 2H), 1.48 (s, 18H), 1.44 (s, 9H). (B) To a solution of 2 (143.1 mg, 0.293 mmol) in DMF (10 mL) were added Et3N (407 μL, 2.93 mmol) and fluorescein-5-isothiocyanate (108.7 mg, 0.279 mmol). After stirring for 2 h at 25 °C, the reaction mixture was concentrated in vacuo. The residue was purified by column chromatography (silica gel, CH2Cl2/CH3OH = 20/1 to 10/1) to afford 3 (46.4 mg, 20%): 1H NMR (400 MHz, CD3OD) δ 8.28 (d, J = 1.6 Hz, 1H), 7.85 (dd, J = 8.4, 2.0 Hz, 1H), 7.15 (d, J = 8.4 Hz, 1H), 6.66–6.68 (m, 4H), 6.54 (dd, J = 8.4, 2.4 Hz, 2H), 5.32 (dd, J = 5.6, 5.6 Hz, 1H), 4.34 (dd, J = 8.4, 5.2 Hz, 1H), 3.46 (dd, J = 14.0, 4.8 Hz, 1H), 3.20–3.25 (m, 2H), 2.98 (dd, J = 13.6, 8.8 Hz, 1H), 1.53 (s, 9H), 1.47 (s, 9H), 1.43 (s, 9H).
2.3. Conventional and imaging flow cytometry, microcopy, glutathione measurements
Cells were treated with CystineFITC and analyzed by conventional flow cytometry (MacsQuant, Miltenyi Biotec), imaging flow cytometry (Imagestream X, Amnis Corp) or confocal microscopy. For some experiments, ImageXpress Micro XL (Molecular Devices) technology was used. For cell surface staining, cells were stained with anti-human CD4 Violet Blue, CD8 PerCP (both Miltenyi Biotec), CD25 PE, CD71 APC, CD8 APC, CD19 APCe780 (all eBioscience). Staining for total xCT was performed after fixation/permeabilization with paraformaldehyde and methanol. Anti-xCT antibody (Abcam) was used at 1:200 and cells were stained with anti-goat PE antibody (R&D) at 1:50. DCFDA, MitoSOX and ThiolTracker (all Invitrogen) assays were performed according to manufacturer protocols. Oxidized and total glutathione (GSH) levels were detected on purified T cells using the GSH/GSSG-Glo™ Assay (Promega). Cell cycle distribution was measured after fixation/permeabilization with paraformaldehyde and methanol and subsequent treatment with RNAse A (Macherey-Nagel) and propidium iodide (Sigma Aldrich). Conventional flow cytometry data were analyzed using FlowJo software (Tree Star, Ashland, OR) and cell cycle analysis was performed using ModFit LT software (Verity Software House, Topsham ME).
2.4. Statistics
Data involving two groups were analyzed using paired or unpaired two-tailed Student’s t-test. Statistical analysis was performed using Prism (Graphpad Software, La Jolla, CA).
3. Results
3.1. ROS accumulation and increase of glutathione upon TCR stimulation of human T cells
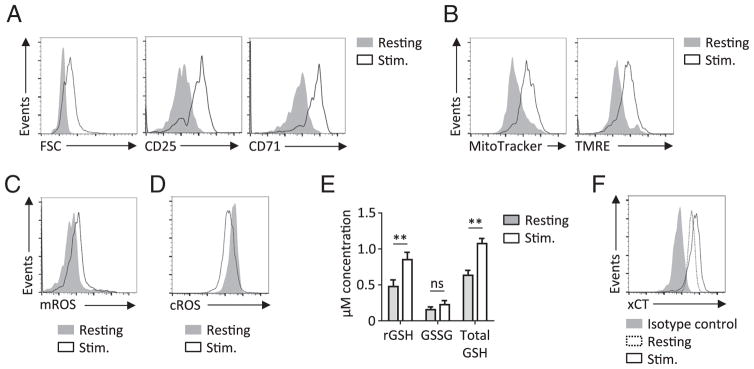
Intracellular cysteine levels are critical to regulate levels of reactive oxygen species (ROS). While ROS can be toxic when excessive, moderate levels of ROS are required for optimal T cell activation by promoting tyrosine kinase and calcium signaling (Sena et al., 2013). Human peripheral blood T cells increased cells size and expression of activation markers CD25 and CD71 after three-day stimulation in vitro (Fig. 1A). This was accompanied by increased mitochondrial mass and mitochondrial membrane potential (Fig. 1B). Increased mitochondrial activity can lead to accumulation of ROS, predominantly in the form of superoxides (Nathan & Cunningham-Bussel, 2013). Consistent with elevated ROS generation we detected increased mitochondrial and cytosolic ROS in acutely stimulated T cells (Supplementary Fig. 1). While prolonged stimulation lead to an accumulation of mitochondrial ROS as measured by MitoSox (mROS), cytosolic ROS (cROS) levels as measured by DCFDA decreased after prolonged 3 day T cell stimulation (Fig. 1C,D). The analysis of the reduced (rGSH), oxidized (GSSG) and total glutathione (GSH) concentrations was performed next and showed an increase in total GSH levels upon T cell stimulation that was attributed to an increase in the rGSH fraction (Fig. 1E). To maintain non-toxic ROS levels, rGSH pool is replenished through reduction of oxidized GSH or through de novo synthesis that requires cysteine derived from cystine (Lu, 2009). After three days of stimulation, T cells had increased expression of cystine transporter xCT (Fig. 1F). Thus, despite TCR stimulation induced changes in mitochondria that correlated with mROS accumulation, levels of cROS decreased while xCT expression and rGSH levels increased in stimulated human T cells.
Fig. 1.
T cell receptor stimulation induces changes in cellular ROS homeostasis and regulates xCT expression in human T cells. (A) Peripheral blood mononuclear cells (PBMCs) from healthy donors were stimulated with anti-CD3 for three days. Cell size and expression of CD25 and CD71 was measured with flow cytometry on CD8+ T cells. (B) Mitochondrial mass and membrane potential was assessed by MitoTracker and TMRE assays, respectively. (C–D) Detection of mitochondrial ROS (mROS) cytosolic ROS (cROS) on resting or stimulated CD8+ T cells. (E) Measurements of reduced (rGSH), oxidized (GSSH) and total (GSH) glutathione concentrations. (F) Expression of xCT measured on resting or stimulated T cells using antibodies against xCT or isotype control antibody. Data are representative of 3 to 5 analyzed donors. ** P < 0.01.
3.2. A novel compound to measure cystine uptake in stimulated T cells
Effective ROS-detoxification, increased rGSH pool and induced expression of xCT suggested elevated cystine uptake in stimulated human T cells. To measure cystine uptake on single-cell level with simultaneous measurement of multiple cell surface markers, a reagent was developed to measure single-cell cystine uptake via flow cytometry by conjugation of cystine to the fluorescent molecule fluorescein isothiocyanate (FITC) (Fig. 2A,B).
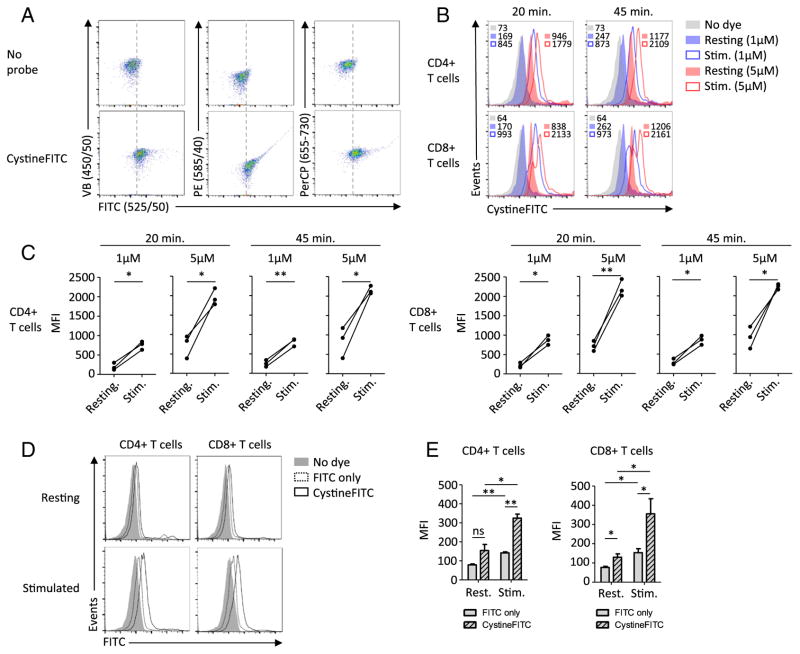
Stimulated T cells were next treated with or without the CystineFITC probe and emitted fluorescence was analyzed by flow cytometry after excitation with a violet (405 nm), blue (488 nm) and red (635 nm) laser. T cells treated with the CystineFITC probe showed fluorescence levels that were above the background auto fluorescence of untreated T cells. Cells with increased fluorescence in FITC emission filter (475–575 nm) also showed increased signal in phycoerythrin (PE; 545–625 nm) filter, suggesting a spectral overlap in these two channels. No spectral overlap was detected in violet-blue (VB; 400–500 nm) channel and only a minimal spectral overlap was detected in the peridinin chlorophyll (PerCP; 655–730 nm) emission channel (Fig. 3A). Next we analyzed stimulated CD4+ and CD8+ T cells using modifications of the protocol for flow-cytometry based measurement of cystine uptake. T cell stimulation resulted in robust increase in fluorescence detected by the FITC emission filter. This was the case for both CD4+ and CD8+ T cells. Both longer time and higher concentration of the compound resulted in higher signal, however the effect of concentration was more prominent (Fig. 3B,C).
Fig. 3.
Flow cytometry based measurements of cystine uptake using CystineFITC in stimulated human T cells. (A) Stimulated CD8+ T cells were treated with 5 μM CystineFITC for 45 min and fluoresce was detected using standard band-pass filters. (B–C) Resting or stimulated CD4+ and CD8+ T cells were treated with 1 μM or 5 μM of CystineFITC for 20 or 45 min and analyzed with flow cytometry. (D–E) Resting or stimulated CD4+ and CD8+ T cells were stained with 1 μM CystineFITC or FITC for 20 min and fluorescence was measured with flow cytometry. Data are representative of at least 3 donors. * P < 0.05 and ** P < 0.01.
CystineFITC signals may have been due to unspecific binding of the FITC moiety to T cell surface. Resting and stimulated T cells were therefore stained with equal concentrations of FITC or CystineFITC. FITC stained T cells showed a signal increase upon stimulation suggesting the ability of FITC to unspecifically stain stimulated T cells. CystineFITC fluorescence however exceeded that of FITC (Fig. 3D,E). Thus, CystineFITC signal increase upon T cell stimulation was not due to unspecific binding of FITC, however stimulated T cells were able to unspecifically bind FITC.
3.3. CystineFITC can be utilized to differentiate cystine uptake in lymphocyte sub-populations
Flow-cytometry based assays allow comparative analysis of different sub-populations. Higher CystineFITC uptake was detected in CD8+ T cells relative to CD4+ T cells from the same human donor (Fig. 4A). CD8+ T cells show lower cROS levels compared to CD4+ T cells in mouse studies (Cao et al., 2014) and human donors (Fig. 4B). Increased cystine uptake and decreased cROS levels in CD8+ T cells therefore suggested upregulated cystine/cysteine ROS detoxification pathway in this T cell subpopulation. LPS stimulation of B cells increases cellular ROS, xCT expression and GSH accumulation (Vene et al., 2010). We tested whether flow-cytometry based measurement of cystine uptake can be used in resting and stimulated human B cells. Stimulation with LPS increased FITC fluorescence levels in human CD19+ B cells, indicating higher cystine uptake upon B cell activation similar to that observed in activated T cells (Fig. 4C).
Fig. 4.
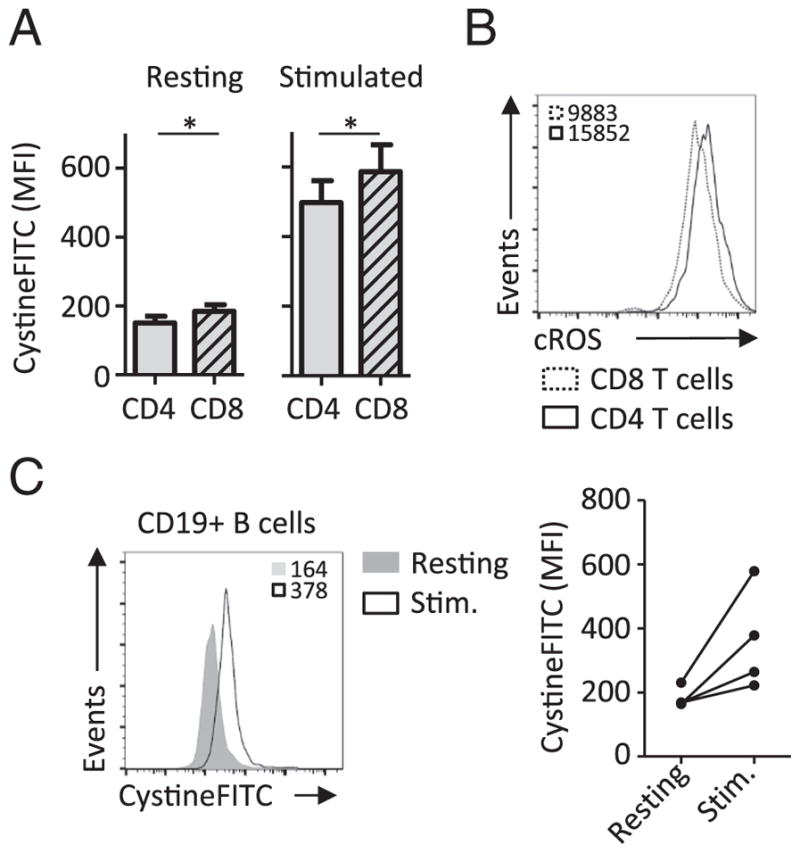
CystineFITC can be utilized to measure cystine uptake in resting or stimulated lymphocyte sub-populations. (A) Peripheral blood mononuclear cells from 10 healthy donors were stimulated and treated with 1 μM CystineFITC. Cystine uptake was measured in CD4+ and CD8+ T cells using flow cytometry. (B) CD4+ and CD8+ T cells from at least 9 donors were analyzed for accumulation of cellular ROS (cROS). (C) Cystine uptake was measured in CD19+ B cells from 3 donors after 3 day LPS stimulation.
3.4. Novel probe for cystine uptake localizes intracellularly in stimulated T cells
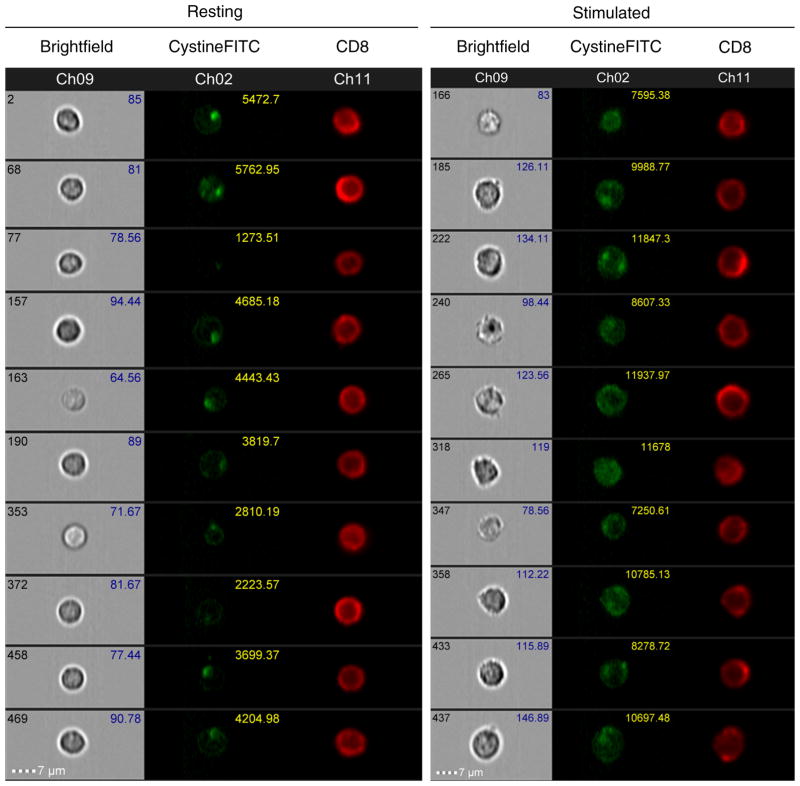
It was next important to test if CystineFITC probe was taken into cells in a specific manner. Imaging flow cytometry measured cystine uptake on single cell level to establish probe localization and if CystineFITC probe was bound the cell surface or was transported intracellularly. Human CD8+ T cells were stimulated and measurement of cystine uptake in combination with CD8 cell surface staining was performed. Imaging flow cytometry showed increased cell size and increased intracellular FITC fluorescence in stimulated CD8+ T cells. Focal areas of increased FITC fluorescence were detected in resting T cells (Fig. 5). These apparent vesicular structures were also present in stimulated T cells, although with a notable increase in general cytosolic staining. Quantification of the detected fluorescence levels revealed an increase of geometric mean fluorescence intensity after stimulation (Supplementary Fig. 2), closely resembling data obtained with conventional flow cytometry.
Fig. 5.
Imaging flow cytometry reveals increased cystine uptake and intracellular localization of CystineFITC in stimulated CD8+ T cells. Peripheral blood mononuclear cells from 2 donors were stimulated with anti-CD3 for 3 days and treated with 1 μM CystineFITC for 20 min. Brightfield images and CD8-APC and CystineFITC fluorescence was collected using ImageStream imaging flow cytometry. Representative 10 cells from one donor are shown for each condition. Numbers in CystineFITC channel represent relative fluorescence intensity. Fluorescence histograms are shown in Supplementary Fig. 2.
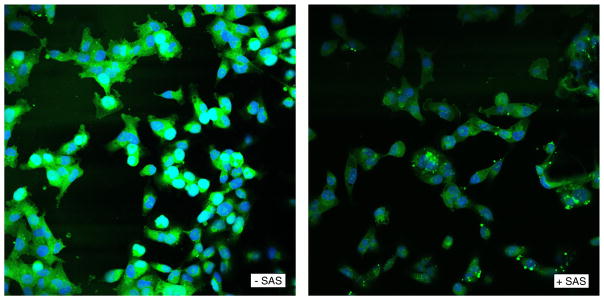
Next, human breast cancer cell line MDA-MB-231 expressing high levels of endogenous xCT (Supplementary Fig. 3) was treated with the xCT inhibitor sulfasalazine (SAS) to inhibit cystine uptake. Confocal microscopy confirmed the intracellular localization of the CystineFITC probe and SAS treatment decreased the measured fluorescence (Fig. 6). Thus, CystineFITC localized intracellularly and xCT blockade decreased CystineFITC uptake suggesting transport through xCT.
Fig. 6.
CystineFITC localizes intracellularly in MDA-MB-231 breast cancer cells and CystineFITC uptake is decreased after xCT blockade. MDA-MB-231 cells were untreated or treated with the xCT inhibitor sulfasalazine (SAS) for 3 h. Confocal microscopy was used to assess the signal intensity and cellular localization of the CystineFITC probe.
3.5. CystineFITC is metabolized and rescues from cystine deprivation induced cell death
After uptake through xCT, it was unclear if CystineFITC was stable or may be processed to provide cysteine. In addition, CystineFITC may decrease cell viability by blocking the access to extracellular cystine. Cellular ATP levels were therefore measured to assess the effects of CystineFITC uptake on viability of MDA-MB-231 cells under cystine deprivation or xCT blockade. Interestingly, cystine depletion induced cell death was rescued by treatment with CystineFITC (Fig. 7A). This appeared to be due to specific uptake of CystineFITC because xCT blockade with SAS decreased viability of cells supplemented with both cystine or CystineFITC (Fig. 7B) and CystineFITC was partially able to overcome the xCT blockade induced cell death (Fig. 7C). Thus, CystineFITC can be metabolized to prevent cystine deprivation induced cell death.
Fig. 7.
CystineFITC is metabolized and rescues from cystine deprivation induced cell death. Cellular ATP levels were measured to assess the effects of CystineFITC uptake on viability of MDA-MB-231 cells under cystine deprivation or xCT blockade. (A) Effects of cystine depletion or CystineFITC treatment on viability of MDA-MB-231 cells. (B) xCT blockade with 0.5 μM sulfasalazine (SAS) alone or in combination with CystineFITC in indicated concentrations in cystine depleted or replete cells. (C) CystineFITC treatment in cystine depleted and SAS treated MDA-MB-231 cells.
3.6. Pharmacological blockade of cystine uptake increases cellular ROS levels and decreases T cells activation
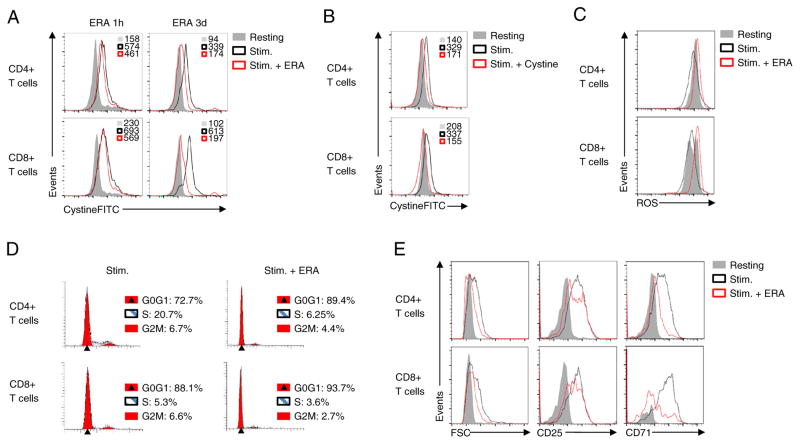
We next tested the role of xCT in CystineFITC uptake and cellular ROS regulation and T cell activation. Even in human epithelial cells with high levels of basal xCT expression, we found that retroviral transduction for xCT overexpression led to further increased cystine uptake (Supplementary Fig. 4A). Pharmacological inhibition of xCT or competition of unlabeled cystine with CystineFITC was next performed to determine the specificity of CystineFITC for xCT. While one-hour treatment with the xCT inhibitor erastin only modestly affected CystineFITC uptake, three days of erastin treatment robustly decreased the measured CystineFITC signal (Fig. 8A). Importantly, competition of CystineFITC with unlabeled cystine reduced the measured cellular fluorescence of CystineFITC in stimulated T cells to levels similar to resting T cells (Fig. 8B).
Fig. 8.
Uptake of CystineFITC is xCT specific and xCT blockade increases cellular ROS levels and decreases T cells activation. (A) Human peripheral blood mononuclear cells were stimulated with anti-CD3 for 3 days and subsequently treated with 50 μM erastin (ERA) for indicated times. Cystine uptake was measured with flow cytometry. (B) CD4+ and CD8+ cells were stimulated with anti-CD3 and CystineFITC uptake was measured in absence or presence of 0.5 mM natural cystine. (C) Cellular ROS levels were measured in stimulated untreated T cells or in cells treated with erastin. (D) Cell cycle analysis was performed on untreated or erastin treated stimulated CD4+ and CD8+ T cells using propidium iodide. Numbers indicate percentages of cells in specific cell cycle phases. (E) Cell size and expression of CD25 and CD71 was measured on resting and stimulated T cells with or without erastin treatment. Data are representative of at least two independent experiments.
Insufficient ROS clearance due to impaired cystine uptake and conversion to cysteine and GSH could increase ROS and impair T cell function. To determine if decreased cystine uptake by pharmacological xCT blockade affects T cell phenotype, CD4+ and CD8+ T cells were stimulated in presence of erastin. Erastin treatment resulted in increased levels of ROS in both CD4+ and CD8+ T cells (Fig. 8C). Furthermore, erastin treatment led to accumulation of CD4+ and CD8+ T cells in the G0G1 phase, suggesting an effect on cell cycle progression (Fig. 8D). Next, expression of T cell activation markers was assessed on resting T cells or T cells stimulated in the presence or absence of erastin. While expression of CD25 was largely unaffected, erastin treatment resulted in decreased cell size and CD71 expression on stimulated T cells (Fig. 8E). Similarly, decreased CystineFITC uptake and reduced T cell activation was observed after treatment with an independent xCT inhibitor (S)-4-Carboxyphenylglycine (S4-CPG) (Bridges et al., 2012) (Supplementary Fig. 4B). Thus, CystineFITC reveals a dynamic cystine uptake in stimulated lymphocytes that shows an essential role for cystine uptake to regulate cellular ROS levels and T cell activation (Fig. 9).
Fig. 9.
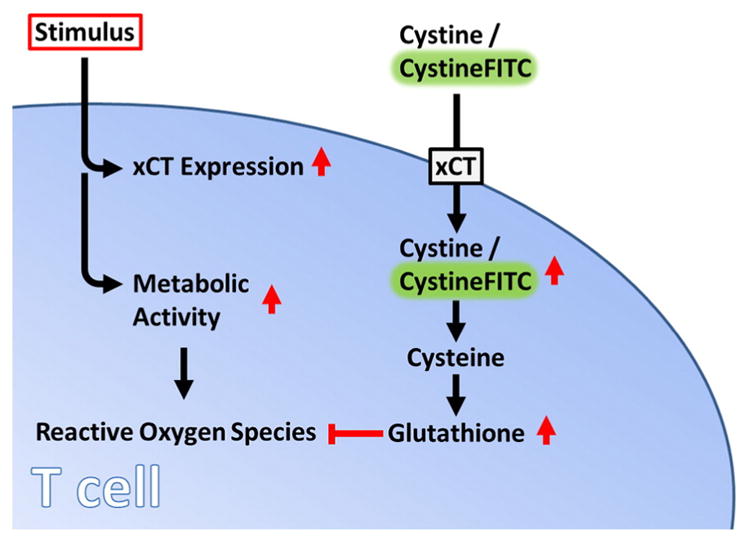
CystineFITC can be used as a surrogate for cystine uptake. Upon stimulation, T cells upregulate xCT expression leading to increased cystine uptake. Cytosolic cystine contributes to glutathione formation and reactive oxygen species detoxification.
4. Discussion
Despite their robustness and high sensitivity, measurements of cellular nutrient uptake that are based on radioactive labeling lack single cell resolution. In contrast, approaches that utilize specific probes labeled with fluorophores or metal isotopes offer versatile readout modes by providing information on single cell level and can be performed on multiple parameters simultaneously. Here we describe a novel method of cellular cystine uptake measurement using a fluorescent CystineFITC probe. While additional transporters may contribute to cystine uptake, the probe appeared to be taken up predominantly through the endogenous cystine transporter xCT, as both competition with unlabeled cystine and pharmacological xCT blockade decreased the measured CystineFITC signal. Furthermore, the probe did not induce toxicity but surprisingly prevented cystine starvation induced cell death, suggesting that CystineFITC can be metabolized similarly to natural cystine. To demonstrate the advantage of cystine uptake measurement on single cell level, we analyzed resting and stimulated human immune cells and showed that both CD4+ and CD8+ T cells as well as CD19+ B cells increase cystine uptake upon stimulation. Blockade of xCT decreased cystine uptake and increased ROS levels that correlated with changes in cell cycle progression, cell growth and CD71 expression of stimulated T cells.
Activated T cells re-wire their metabolism in response to extrinsic stimuli and intrinsic energetic demands. This metabolic re-programming is essential for proper T cell growth, proliferation and function (MacIver et al., 2013). However, increased metabolic activity leads to ROS production that can accumulate and be toxic. To prevent ROS related toxicity, T cells increase GSH formation that is critical for ROS homeostasis. Activated T cells upregulate xCT expression (Garg et al., 2011) that transports cystine. Cystine is degraded to cysteine and contributes to GSH formation. Uptake of cystine is necessary for T cell activation (Srivastava et al., 2010) and proliferation (Levring et al., 2012). It has been also demonstrated that T cell cystine uptake is required for proper DNA synthesis (Levring et al., 2015). We observed that decreased cystine uptake led to higher percentage of cells in the G0G1-phase and decreased percentage of cells in the S-phase. In addition to the effect on cell cycle progression, blockade of cystine uptake prevented stimulation induced CD71 expression, CD25 upregulation however was not affected. Both observations are in agreement with data from Messina et al., who showed that decreased GSH prevents the entry into the S-Phase while not affecting CD25 expression on stimulated human peripheral blood mononuclear cells (Messina & Lawrence, 1989).
The in vivo relevance of cystine uptake for T cell function was studied by Evonuk et al. (Evonuk et al., 2015). These studies demonstrated that autoreactive T cells in experimental autoimmune encephalomyelitis (EAE) require cystine uptake for their function as pharmacological blockade or genetic deletion of xCT prevented EAE. These results further strengthen the evidence for cystine uptake as a critical regulator of T cell function. Furthermore, cystine uptake in immune cells and other cell types may mirror cellular ROS stress as well as metabolic activity of the cells. Therefore, tools such as the here described CystineFITC probe may be used as a readout for broad changes in cellular metabolism. Here we demonstrate that employment of the novel CystineFITC probe allows measurement of cystine uptake in various cell populations on single cell level. Future studies will explore other potential applications of the CystineFITC dye and may contribute to a deeper understanding of the role of cellular cystine uptake on ROS homeostasis and metabolism.
Supplementary Material
Acknowledgments
We would like to thank members of the Rathmell lab for support and helpful discussions. This work was supported by the Alliance for Lupus Research and National Institutes of Health R01105550DK.
Abbreviations
- ROS
reactive oxygen species
- SAS
sulfasalazine
- TCR
T cell receptor
- PBMCs
peripheral blood mononuclear cells
- GSH
glutathione
- LSP
lipopolysaccharide
- FITC
fluorescein isothiocyanate
Footnotes
Supplementary data to this article can be found online at http://dx.doi.org/10.1016/j.jim.2016.08.013.
References
- Angelini G, et al. Antigen-presenting dendritic cells provide the reducing extracellular microenvironment required for T lymphocyte activation. Proc Natl Acad Sci U S A. 2002;99:1491–1496. doi: 10.1073/pnas.022630299. http://dx.doi.org/10.1073/pnas.022630299. [DOI] [PMC free article] [PubMed] [Google Scholar]
- Aquilano K, Baldelli S, Ciriolo MR. Glutathione: new roles in redox signaling for an old antioxidant. Front Pharmacol. 2014;5:196. doi: 10.3389/fphar.2014.00196. http://dx.doi.org/10.3389/fphar.2014.00196. [DOI] [PMC free article] [PubMed] [Google Scholar]
- Arner ES, Holmgren A. Physiological functions of thioredoxin and thioredoxin reductase. Eur J Biochem. 2000;267:6102–6109. doi: 10.1046/j.1432-1327.2000.01701.x. [DOI] [PubMed] [Google Scholar]
- Bridges RJ, Natale NR, Patel SA. System xc-cystine/glutamate antiporter: An update on molecular pharmacology and roles within the CNS. Brit J Pharmacol. 2012;165:20–34. doi: 10.1111/j.1476-5381.2011.01480.x. http://dx.doi.org/10.1111/j.1476-5381.2011.01480.x. [DOI] [PMC free article] [PubMed] [Google Scholar]
- Cao Y, Rathmell JC, Macintyre AN. Metabolic reprogramming towards aerobic glycolysis correlates with greater proliferative ability and resistance to metabolic inhibition in CD8 versus CD4 T cells. PLoS One. 2014;9:e104104. doi: 10.1371/journal.pone.0104104. http://dx.doi.org/10.1371/journal.pone.0104104. [DOI] [PMC free article] [PubMed] [Google Scholar]
- Chung WJ, et al. Inhibition of cystine uptake disrupts the growth of primary brain tumors. J Neurosci. 2005;25:7101–7110. doi: 10.1523/JNEUROSCI.5258-04.2005. http://dx.doi.org/10.1523/JNEUROSCI.5258-04.2005. [DOI] [PMC free article] [PubMed] [Google Scholar]
- Dai L, Cao Y, Chen Y, Parsons C, Qin Z. Targeting xCT, a cystine-glutamate transporter induces apoptosis and tumor regression for KSHV/HIV-associated lymphoma. J Hematol Oncol. 2014;7:30. doi: 10.1186/1756-8722-7-30. http://dx.doi.org/10.1186/1756-8722-7-30. [DOI] [PMC free article] [PubMed] [Google Scholar]
- Evonuk KS, et al. Inhibition of system (−)(Xc) transporter attenuates autoimmune inflammatory demyelination. J Immunol. 2015;195:450–463. doi: 10.4049/jimmunol.1401108. http://dx.doi.org/10.4049/jimmunol.1401108. [DOI] [PMC free article] [PubMed] [Google Scholar]
- Garg SK, Yan Z, Vitvitsky V, Banerjee R. Differential dependence on cysteine from transsulfuration versus transport during T cell activation. Antioxid Redox Sig. 2011;15:39–47. doi: 10.1089/ars.2010.3496. http://dx.doi.org/10.1089/ars.2010.3496. [DOI] [PMC free article] [PubMed] [Google Scholar]
- Gout PW, Buckley AR, Simms CR, Bruchovsky N. Sulfasalazine, a potent suppressor of lymphoma growth by inhibition of the x(c)- cystine transporter: a new action for an old drug. Leukemia. 2001;15:1633–1640. doi: 10.1038/sj.leu.2402238. [DOI] [PubMed] [Google Scholar]
- Guan J, et al. The x (c) (−) cystine/glutamate antiporter as a potential therapeutic target for small-cell lung cancer: use of sulfasalazine. Cancer Chemother Pharm. 2009;64:463–472. doi: 10.1007/s00280-008-0894-4. http://dx.doi.org/10.1007/s00280-008-0894-4. [DOI] [PubMed] [Google Scholar]
- Levring TB, et al. Activated human CD4+ T cells express transporters for both cysteine and cystine. Sci Rep. 2012;2:266. doi: 10.1038/srep00266. http://dx.doi.org/10.1038/srep00266. [DOI] [PMC free article] [PubMed] [Google Scholar]
- Levring TB, et al. Human CD4+ T cells require exogenous cystine for glutathione and DNA synthesis. Oncotarget. 2015;6:21853–21864. doi: 10.18632/oncotarget.5213. http://dx.doi.org/10.18632/oncotarget.5213. [DOI] [PMC free article] [PubMed] [Google Scholar]
- Lewerenz J, et al. The cystine/glutamate antiporter system x(c)(−) in health and disease: from molecular mechanisms to novel therapeutic opportunities. Antioxid Redox Signal. 2013;18:522–555. doi: 10.1089/ars.2011.4391. http://dx.doi.org/10.1089/ars.2011.4391. [DOI] [PMC free article] [PubMed] [Google Scholar]
- Lu SC. Regulation of glutathione synthesis. Mol Asp Med. 2009;30:42–59. doi: 10.1016/j.mam.2008.05.005. http://dx.doi.org/10.1016/j.mam.2008.05.005. [DOI] [PMC free article] [PubMed] [Google Scholar]
- MacIver NJ, Michalek RD, Rathmell JC. Metabolic regulation of T lymphocytes. Annu Rev Immunol. 2013;31:259–283. doi: 10.1146/annurev-immunol-032712-095956. http://dx.doi.org/10.1146/annurev-immunol-032712-095956. [DOI] [PMC free article] [PubMed] [Google Scholar]
- Messina JP, Lawrence DA. Cell-cycle progression of glutathione-depleted human peripheral-blood mononuclear-cells is inhibited at S-phase. J Immunol. 1989;143:1974–1981. [PubMed] [Google Scholar]
- Narang VS, Pauletti GM, Gout PW, Buckley DJ, Buckley AR. Suppression of cystine uptake by sulfasalazine inhibits proliferation of human mammary carcinoma cells. Anticancer Res. 2003;23:4571–4579. [PubMed] [Google Scholar]
- Nathan C, Cunningham-Bussel A. Beyond oxidative stress: An immunologist’s guide to reactive oxygen species. Nat Rev Immunol. 2013;13:349–361. doi: 10.1038/nri3423. http://dx.doi.org/10.1038/nri3423. [DOI] [PMC free article] [PubMed] [Google Scholar]
- Sandoval RM, Kennedy MD, Low PS, Molitoris BA. Uptake and trafficking of fluorescent conjugates of folic acid in intact kidney determined using intravital two-photon microscopy. Am J Physiol Cell Physiol. 2004;287:C517–C526. doi: 10.1152/ajpcell.00006.2004. http://dx.doi.org/10.1152/ajpcell.00006.2004. [DOI] [PubMed] [Google Scholar]
- Sena LA, et al. Mitochondria are required for antigen-specific T cell activation through reactive oxygen species signaling. Immunity. 2013;38:225–236. doi: 10.1016/j.immuni.2012.10.020. http://dx.doi.org/10.1016/j.immuni.2012.10.020. [DOI] [PMC free article] [PubMed] [Google Scholar]
- Srivastava MK, Sinha P, Clements VK, Rodriguez P, Ostrand-Rosenberg S. Myeloid-derived suppressor cells inhibit T-cell activation by depleting cystine and cysteine. Cancer Res. 2010;70:68–77. doi: 10.1158/0008-5472.CAN-09-2587. http://dx.doi.org/10.1158/0008-5472.CAN-09-2587. [DOI] [PMC free article] [PubMed] [Google Scholar]
- Tang XH, et al. Cystine deprivation triggers programmed necrosis in VHL-deficient renal cell carcinomas. Cancer Res. 2016;76:1892–1903. doi: 10.1158/0008-5472.CAN-15-2328. http://dx.doi.org/10.1158/0008-5472.Can-15-2328. [DOI] [PMC free article] [PubMed] [Google Scholar]
- Vene R, et al. Redox remodeling allows and controls B-cell activation and differentiation. Antioxid Redox Signal. 2010;13:1145–1155. doi: 10.1089/ars.2009.3078. http://dx.doi.org/10.1089/ars.2009.3078. [DOI] [PubMed] [Google Scholar]
- Yan ZH, Banerjee R. Redox remodeling as an Immunoregulatory strategy. Biochemistry-Us. 2010;49:1059–1066. doi: 10.1021/bi902022n. http://dx.doi.org/10.1021/bi902022n. [DOI] [PMC free article] [PubMed] [Google Scholar]
Associated Data
This section collects any data citations, data availability statements, or supplementary materials included in this article.


