

Abstract
Context
Since the syndrome of hypogonadotropic hypogonadism (HH) is associated with anemia and the administration of testosterone restores hematocrit to normal, we investigated the potential underlying mechanisms.
Design
Randomized, double blind, placebo controlled trial
Methods
We measured basal serum concentrations of erythropoietin, iron, iron binding capacity, transferrin (saturated and unsaturated), ferritin and hepcidin and the expression of ferroportin and transferrin receptor (TR) in peripheral blood mononuclear cells (MNC) of 94 men with type 2 diabetes. 44 men had HH (defined as subnormal free testosterone along with low or normal LH concentrations) while 50 were eugonadal. Men with HH were randomized to testosterone or placebo treatment every 2 weeks for 15 weeks. Blood samples were collected at baseline, 3 and 15 weeks after starting treatment. 20 men in testosterone group and 14 men in placebo group completed the study.
Results
Hematocrit levels were lower in men with HH (41.1±3.9% vs. 43.8±3.4%, p=0.001). There were no differences in plasma concentrations of hepcidin, ferritin, erythropoietin, transferrin or iron, or in the expression of ferroportin or TR in MNC among HH and eugonadal men. Hematocrit increased to 45.3±4.5%, hepcidin decreased by 28±7% and erythropoietin increased by 21±7% after testosterone therapy (p<0.05). There was no significant change in ferritin concentrations but transferrin concentration increased while transferrin saturation and iron concentrations decreased (p<0.05). Ferroportin and TR mRNA expression in MNC increased by 70±13% and 43±10%, respectively (p<0.01) after testosterone therapy.
Conclusions
The increase in hematocrit following testosterone therapy is associated with an increase in erythropoietin, the suppression of hepcidin, and an increase in the expression of ferroportin and transferrin receptor.
Keywords: diabetes, testosterone, anemia, hepcidin, ferroportin
Introduction
A third of men of men with type 2 diabetes have subnormal free testosterone concentrations in association with inappropriately low LH and FSH concentrations (1-4). These abnormalities are independent of the duration and severity of hyperglycemia but are directly related to insulin resistance. Obesity and metabolic syndrome are also associated with hypogonadotropic hypogonadism (HH)(5). HH associated with type 2 diabetes and obesity has been shown in various populations all over the world and at all age groups(3, 4, 6-9). HH in men with type 2 diabetes is associated with insulin resistance, inflammation, anemia, decreased bone density in non-weight bearing regions, lower PSA concentrations, sexual symptoms and increased cardiovascular mortality(4, 10-15). Studies have also shown that obesity is inversely related to sperm counts, sperm morphology and sperm motility(16, 17).
Since testosterone deficiency in the male is associated with normocytic normochromic anemia (12, 14, 18), we previously investigated whether they had low erythropoietin concentrations. However, we found that these patients had elevated or high normal erythropoietin concentrations (12). Clearly, in these patients, an increase in erythropoietin was not able to restore hemoglobin concentrations to normal. Thus, must be other mechanisms which contribute to anemia associated with this form of male hypogonadism.
It is now known that anemia of chronic inflammation is associated with an increase in the plasma concentrations of hepcidin, a protein which binds to ferroportin in the plasma membrane and thus inhibits its ability to mediate iron transport (19). The binding of hepcidin to ferroportin leads to tyrosine phosphorylation, ubiquitination and eventual proteolytic degradation of the latter (19). Since ferroportin is responsible for the transport of absorbed iron from the intestinal cell and then from the macrophage into the circulation, the inhibition and suppression of ferroportin is likely to reduce the bioavailability of iron. Testosterone replacement has recently been shown to suppress hepcidin concentrations in men (20-22). However, it is not known whether this results in increased cellular expression of ferroportin and other relevant mechanisms in humans.
Since the state of HH is associated with type 2 diabetes and obesity, both of which are characterized by chronic inflammation, (12, 23) and since testosterone replacement decreases inflammation(10), we hypothesized that in hypogonadal men, cellular expression and plasma concentrations of hepcidin are increased, that the cellular expression of ferroportin is decreased and that testosterone replacement restores them to normal. While investigating these changes, we also investigated whether concomitant changes occurred in the plasma transferrin, iron, iron binding capacity, erythropoietin and ferritin concentrations and the expression of transferrin receptor. The data below are a secondary analysis of a trial that evaluated the effect of testosterone replacement therapy on insulin sensitivity in men with HH and type 2 diabetes (10).
Patients and Methods
We recruited 94 men with type 2 diabetes between the ages of 30-65 years, with an HbA1c ≤8% and a stable diabetes regimen for 3 months for a randomized placebo controlled trial of testosterone replacement that was funded by the National Institutes of Health. The details on study design as well as the results on insulin sensitivity, inflammation and body composition from that trial have recently been published (10). In short, 50 eugonadal men and 44 men with HH (defined as calculated free testosterone concentration less than 0.23 nmol/L on two occasions along with low or low normal LH concentrations) participated in the study. It has been shown that hypogonadism defined by dichotomization based on free, rather than total, testosterone is better associated with symptoms consistent with androgen deficiency(24). Men with HH were randomized to receive intramuscular injections of 250 mg testosterone cypionate (Watson Pharmaceuticals, New Jersey, USA; 200mg/ml) or placebo (1.25 ml saline) intramuscularly in the buttock every 2 weeks for 6 months. There was no significant difference in any of the baseline measures of body composition, insulin sensitivity or inflammation of men randomized to testosterone or placebo arms (10).
20 men in testosterone group and 14 men in placebo group completed the study. The predominant cause of drop-out was unwillingness to complete all required study procedures. There were no differences in baseline characteristics of study completers and drop-outs (10).
Testosterone concentrations were measured at baseline, week 3, week 9, week 15 and week 23. Dose of testosterone was adjusted to keep calculated free testosterone (cFT) concentrations in normal range (0.23-0.89 nmol/L). If cFT was <0.35 or 0.35-0.49 nmol/L, then the dose of testosterone was increased by 100 or 50 mg/injection respectively. If cFT was >0.59 nmol/L, then the dose was reduced by 50 mg/injection. Patients and study investigators except one research nurse were blinded to the study treatment. The mean dose of testosterone given over the study duration to subjects randomized to testosterone therapy was 216±40 mg every 2 weeks. Hemoglobin and hematocrit were measured at baseline and week 15 to evaluate for polycythemia and adjust dose of testosterone if needed. However, no subject developed hemoglobin >180 g/L or hematocrit >55% during the trial. We report here the results of plasma hepcidin, erythropoietin, transferrin, ferritin, iron and iron binding capacity as well as expression of ferroportin and transferrin receptor in mononuclear cells (MNC) in samples from baseline and weeks 3 and 15. The data are not available for various indices at week 24 and hence have not been presented. The protocol was approved by the Human Research Board of the State University of New York at Buffalo, informed consent was signed by all subjects and the trial was registered with clinicaltrials.gov (NCT01127659).
Laboratory assays
All measurements were carried out by Quest diagnostics. Total testosterone concentrations were measured by liquid chromatography tandem mass spectrometry (LCMS/MS)(25). A detailed description of the methodology has previously been published(25). The sensitivity of the assay (LOQ), set at a coefficient of variation(CV) of ≤20%, was 0.01 nmol/L. The intra-assay CV ranged from 7.6-10.8% and inter-assay CV ranged from 9.8-13.4% at total testosterone concentrations between 0.35-41.67 nmol/L. Reference range for total testosterone (8.7-38.2 nmol/L) was determined from 264 apparently healthy men. Tracer equilibrium dialysis is considered the gold standard for measuring free steroid hormone concentrations and this methodology was used to separate the free testosterone (25, 26). Samples were collected at the Research Center, allowed to clot (15 min), centrifuged and the supernatant sent to the Pittsburgh Business Unit refrigerated(cold packs). Pittsburgh then sent the refrigerated samples to Nichols Institute – Chantilly, VA. The methodology for free testosterone measurement at Nichols Institute has been published (25). The normal range for free testosterone is 0.17-0.89 nmol/L. SHBG, LH and FSH concentrations were measured by a solid-phase, chemiluminescent immunometric assay (Siemens, IMMULITE 2500). Free testosterone concentrations were also calculated from the concentrations of total testosterone, SHBG and albumin by the formula of Sodergard and Vermuelen et al (1, 27, 28). Complete blood counts, HbA1c, plasma concentrations of iron, transferrin, transferrin saturation, total iron binding capacity (TIBC) and unsaturated iron binding capacity (UIBC) were calculated or measured by well established clinical laboratory assays. As per World health Organization definition, anemia was defined as hemoglobin <130 g/L or hematocrit <39%. Hepcidin and ferritin concentrations were measured by ELISA (MyBiosource, San Diego, CA and Elascience Biotechnology, UK, respectively).
Mononuclear cells (MNC) isolation
Blood samples were collected in Na-EDTA and carefully layered on Lympholyte medium (Cedarlane Laboratories, Hornby, ON). Samples were centrifuged and two bands separate out at the top of the RBC pellet. The MNC band was harvested and washed twice with Hank's balanced salt solution. This method provides yields greater than 95% MNC preparation.
Quantification of mRNA Expression by RT-PCR
Expression of ferroportin and transferrin receptor-2 were measured in MNC by RT-PCR. Total RNA was isolated from MNC using commercially available RNAqueous®-4PCR Kit (Ambion, Austin, TX). Real Time RT-PCR was performed using Stratagene Mx3000P QPCR System (La Jolla, CA), Sybergreen master mix(Qiagen, CA) and gene specific primers for ferroportin and transferrin receptor-2 (Life Technologies, MD). All values were normalized to the expression of a group of housekeeping genes including actin, ubiquitin C and cyclophilin A. The normalization factor used is calculated by GeneNorm software and is based on the values of all housekeeping genes used.
Statistical Analysis
Group comparisons were performed by two-sided t tests, Mann-Whitney rank sum tests, and χ2 tests as appropriate. Data that were not normally distributed (Kolmogorov-Smirnov test) were log-transformed to perform the parametric statistical tests. Pearson correlation between variables and generalized linear model analysis were performed using SPSS software (SPSS Inc, Chicago, Illinois). Data are presented as means±SD (or means±SE where indicated) for normally distributed data and median [25th, 75th percentile] for non-normal data. p<0.05 was considered significant. Results for post-treatment group comparisons are presented as mean difference [95% confidence interval].
Results
Hemoglobin concentrations and hematocrit and red blood cell parameters
Hemoglobin concentrations and the hematocrit were lower in men with HH (table 1). There was a significant increase in the hematocrit (table 2) following testosterone treatment. There was also an increase in red blood cell count and a decrease in mean corpuscular volume and mean corpuscular hemoglobin (table 2). Age of subjects was not related with change in hemoglobin (r=0.25, p=0.31) or hematocrit (r=0.28, p=0.28) in the testosterone treatment group.
Table 1.
Demographics, laboratory measures, body composition, insulin sensitivity and iron metabolism mediators in men with and without HH. All patients had their testosterone concentrations measured twice at baseline. The concentrations reported in the table for total, free and calculated free testosterone are an average of the two measurements.
| Hypogonadal | Eugonadal | P | |
|---|---|---|---|
| Number of subjects | 44 | 50 | |
| Age (years) | 54.6±7.9 | 51.5±8.9 | 0.075 |
| Duration of diabetes (years) | 9.4±8.6 | 10.9±9.8 | 0.50 |
| BMI (kg/m2) | 39.8±7.8 | 34.0±6.4 | <0.001 |
| Testicular size (ml) | 17.4±4.7 | 19.1±5.3 | 0.19 |
| Laboratory measurements | |||
| Total testosterone (nmol/L) | 8.8±2.8 | 16.8±6.4 | <0.001 |
| Free testosterone (nmol/L) | 0.15±0.04 | 0.26±0.08 | <0.001 |
| Calculated Free testosterone (nmol/L) | 0.19±0.04 | 0.33±0.06 | <0.001 |
| SHBG (nmol/L) | 26.3±12.8 | 36.0±23.5 | 0.01 |
| LH (IU/L) | 3.9 [2.4, 5.8] | 5.0 [3.6, 6.1] | 0.05 |
| FSH (IU/L) | 5.3 [3.5, 9.4] | 6.9 (4.2, 9.3] | 0.34 |
| HbA1c% (mmol/mol) | 7.0±1.1 (53±12) | 7.1±1.1 (54±12) | 0.66 |
| Hematological parameters | |||
| Hemoglobin (g/L) | 138±13 | 146±12 | 0.002 |
| Hematocrit % | 41.1±3.9 | 43.8±3.2 | 0.001 |
| Prevalence of anemia | 20% | 10% | 0.18 |
| Red blood cell count (million/μL) | 4.6±0.4 | 4.9±0.5 | 0.001 |
| Mean corpuscular volume (fL) | 90.1±5.3 | 89.3±5.8 | 0.47 |
| Mean corpuscular hemoglobin (pg/cell) | 30.1±2.0 | 29.9±2.4 | 0.60 |
| Mean corpuscular hemoglobin concentration (g/L) | 334±7 | 334±10 | 0.93 |
| Red cell distribution width (%) | 14.2±1.2 | 14.2±1.2 | 0.81 |
| White blood cells (thousands/μL) | 7.5±0.4 | 6.7±2.0 | 0.11 |
| Platelets(thousands/μL) | 221±61 | 210±49 | 0.36 |
| Hepcidin (ng/ml) | 197±14 | 207±16 | 0.73 |
| Erythropoietin (mU/ml) | 21.7±3.9 | 23.5±4.8 | 0.41 |
| Transferrin (μg/dl) | 261±8 | 256±9 | 0.83 |
| Transferrin Saturation (%) | 22.1±4.2 | 23.2±3.7 | 0.87 |
| Ferritin (μg/ml) | 2.11±0.16 | 2.28±0.16 | 0.74 |
| Iron (μg/dl) | 78±7 | 85±8 | 0.28 |
| TIBC (μg/dl) | 342±14 | 317±12 | 0.31 |
| UIBC (μg/dl) | 261±16 | 229±15 | 0.54 |
| Ferroportin expression (Arbitrary Units) | 0.48±0.08 | 0.43±0.14 | 0.62 |
| Transferrin Receptor-2 expression (Arbitrary Units) | 0.83±0.17 | 0.91±0.28 | 0.45 |
Table 2.
Laboratory parameters and iron metabolism mediators after 15 weeks of testosterone and placebo treatment. There was no significant difference in any of the baseline measures of body composition, insulin sensitivity or inflammation of men randomized to testosterone or placebo arms (10).
| Testosterone (n=20) | Placebo (n=14) | |||||||
|---|---|---|---|---|---|---|---|---|
| baseline | 15 weeks | p | baseline | 15 Weeks | p | mean difference, [95% CI] | P | |
| Weight (kg) | 119 ±21 | 118 ±21 | 0.62 | 124 ±30 | 124 ±29 | 0.95 | −0.5, [−2.9, 2.0] | 0.70 |
| BMI (kg/m2) | 38.4 ±6.8 | 38.3±7.0 | 0.66 | 39.4±7.9 | 39.4±7.8 | 0.85 | −0.1, [−0.9, 0.7] | 0.80 |
| Laboratory measurements | ||||||||
| Total testosterone (nmol/L) | 9.0 ±3.0 | 24.4±6.7 | <0.001 | 8.3 ±2.8 | 8.1 ±4.2 | 0.78 | 15.3, [11.7, 18.9] | <0.001 |
| Free testosterone (nmol/L) | 0.16±0.05 | 0.49±0.14 | <0.001 | 0.15±0.04 | 0.14±0.05 | 0.80 | 0.33, [0.24, 0.42] | <0.001 |
| Calculated Free testosterone (nmol/L) | 0.19±0.04 | 0.62±0.17 | <0.001 | 0.18±0.03 | 0.17±0.06 | 0.56 | 0.43, [0.33, 0.54] | <0.001 |
| SHBG (nmol/L) | 27 ±14 | 26 ±11 | 0.17 | 26 ±13 | 26 ±13 | 0.68 | −1.4, [−5.2, 2.4] | 0.46 |
| HbA1c% (mmol/mol) | 6.8 ±0.9 (51±9.8) | 7.2 ±0.9 (55±9.8) | 0.27 | 7.0 ±1.4 (53±15.3) | 7.1 ±1.5 (54±16.4) | 0.72 | 0.15, [−0.59, 0.90] | 0.40 |
| Hematocrit % | 42.1±2.75 | 45.6±4.6 | 0.001 | 40.7±2.9 | 41.6±3.0 | 0.22 | 2.7 [0.2, 5.1] | 0.03 |
| Hemoglobin (g/L) | 141±9 | 151±16 | 0.002 | 135±9 | 139±11 | 0.05 | 7 [−1, 14] | 0.07 |
| Red blood cell count (million/μL) | 4.6±0.3 | 5.2±0.6 | <0.001 | 4.5±0.4 | 4.7±0.4 | 0.04 | 0.39 [0.06, 0.72] | 0.02 |
| Mean corpuscular volume (fL) | 91.4±4.3 | 87.9±6.1 | <0.001 | 89.7±5.4 | 89.1±4.4 | 0.34 | −2.9 [−5.2, −0.7] | 0.01 |
| Mean corpuscular hemoglobin (pg/cell) | 30.4±1.6 | 29.2±2.4 | <0.001 | 30.2±2.0 | 29.9±1.7 | 0.07 | −0.9 [−1.7, −0.2] | 0.02 |
| Mean corpuscular hemoglobin concentration (g/L) | 333±5 | 332±7 | 0.57 | 336±7 | 335±8 | 0.51 | 02 [−5, 5] | 0.94 |
| Red cell distribution width (%) | 14.0±0.8 | 14.7±1.2 | 0.006 | 14.2±1.1 | 14.1±1.0 | 0.70 | 0.8 [0.1, 1.5] | 0.03 |
| White blood cells (thousands/μL) | 7.3±2.3 | 7.6±1.9 | 0.42 | 6.7±2.6 | 6.5±2.2 | 0.67 | 0.5 [−0.7, 1.6] | 0.40 |
| Platelets(thousands/μL) | 222±52 | 223±52 | 0.85 | 188±70 | 187±59 | 0.92 | 3 [−24, 29] | 0.84 |
| Hepcidin (ng/ml) | 194±12 | 137±14 | <0.01 | 200±12 | 198±9 | 0.84 | −54 [−75, −33] | <0.01 |
| Erythropoietin (mU/ml) | 21.4±1.7 | 24.7±2.1 | 0.034 | 22.1±1.7 | 21.6±1.8 | 0.62 | 4.1 [2.8, 5.4] | 0.023 |
| Ferritin (μg/ml) | 2.01±0.12 | 1.87±0.17 | 0.27 | 2.24±0.17 | 2.16±0.13 | 0.57 | −0.06 [−0.11, 0.05] | 0.39 |
| Iron (ug/dl) | 77±6 | 70±8 | 0.13 | 79±8 | 84±9 | 0.3 | −12 [−16, −6] | 0.03 |
| TTBC (μg/dl) | 331±18 | 390±20 | 0.04 | 353±7 | 363±22 | 0.54 | 37 [11, 55] | 0.02 |
| UIBC (μg/dl) | 254±21 | 321±22 | 0.04 | 271±12 | 273±18 | 0.74 | 55 [21, 68] | 0.01 |
| Transferrin (μg/dl) | 262±11 | 318±14 | <0.01 | 257±11 | 257±11 | 0.85 | 52 [25,79] | 0.018 |
| Transferrin Saturation (%) | 23.6±2.2 | 18.3±1.3 | 0.02 | 21.3±1.0 | 22.2±1.1 | 0.52 | −6.1 [−8.3, −3.9] | 0.012 |
| Ferroportin expression (Arbitrary Units) | 0.46±0.11 | 0.78±0.28 | 0.008 | 0.50±0.13 | 0.52±0.15 | 0.63 | 0.29 [0.15, 0.44] | 0.019 |
| Transferrin Receptor-2 expression (Arbitrary Units) | 0.81±0.18 | 1.12±0.28 | 0.029 | 0.85±0.21 | 0.95±0.26 | 0.41 | 0.22 [0.12, 0.33] | 0.035 |
Hepcidin, transferrin, erythropoietin, ferritin and iron concentrations in plasma
There were no differences in plasma concentrations of hepcidin, ferritin, erythropoietin, transferrin, iron or the expression of ferroportin or TR in MNC among HH and eugonadal men (Table 1). Hepcidin decreased by 28±7% (from 194±12 to 137±14ng/ml, placebo corrected change= −54±7ng/ml p<0.01, Figure 1) and erythropoietin increased by 21±7% (from 21.4±1.7 to 24.7±2.1mU/ml, placebo corrected change=4.4±0.7mU/ml, p<0.05, Figure 2) after testosterone therapy as compared to placebo. The decrease in hepcidin was related to the increase in erythropoietin (r=−0.44, p=0.04), free testosterone (r= −0.59, p=0.016), calculated free testosterone (r=−0.53, p=0.026) and tended to relate to total testosterone (r= −0.44, p=0.068). There was no significant change in ferritin concentrations but transferrin concentration increased by 22±5% (table 2 and figure 3A) while serum iron concentration decreased by 15±4% after testosterone therapy as compared to placebo (table 2) compared to placebo group. Consistent with this, transferrin saturation decreased by 21±6% (table 2 and figure 3B) while TIBC increased by 19±5% and UIBC increased even more by 30±10% (table 2). Change in hepcidin was not related to changes in transferrin, iron, ferritin or any of the red blood cell parameters. Change in erythropoietin was also not related to the change in any of these indices or to testosterone concentrations.
Figure 1.
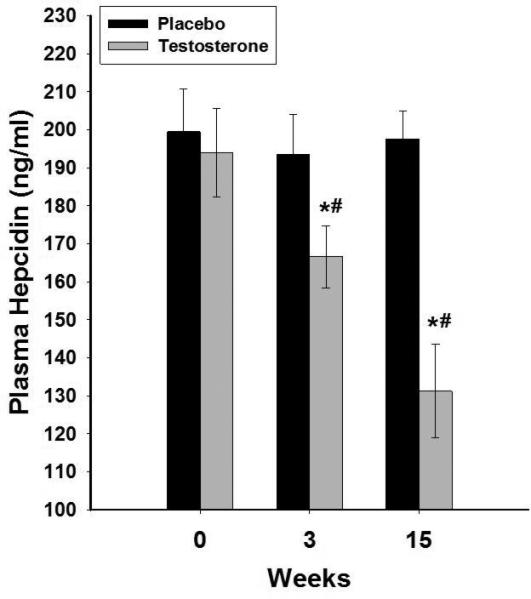
Change in plasma concentrations of hepcidin following 15 weeks of testosterone (n=20) or placebo (n=14) treatments in HH men with type 2 diabetes. Data are presented as mean SE. *p<0.05 with paired t-test compared to baseline. #p<0.05 with t-test compared to placebo.
Figure 2.
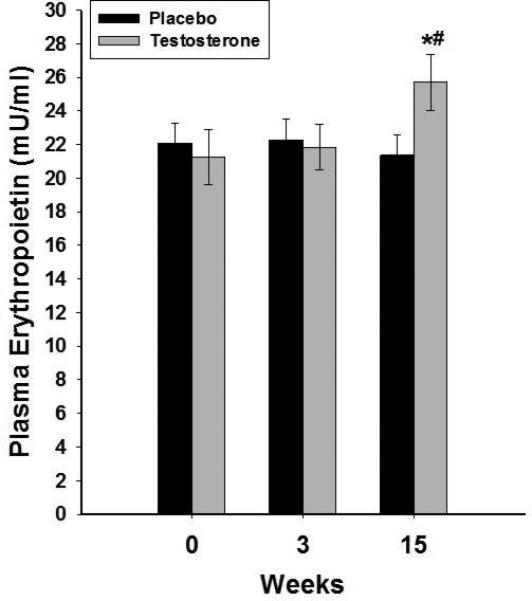
Change in plasma concentrations of erythropoietin following 15 weeks of testosterone (n=20) or placebo (n=14) treatments in HH men with type 2 diabetes. Data are presented as mean SE. *p<0.05 with paired t-test compared to baseline. #p<0.05 with t-test compared to placebo.
Figure 3A-B.

Change in plasma concentrations of transferrin (A) and % transferrin saturation (B) following 15 weeks of testosterone (n=20) or placebo (n=14) treatments in HH men with type 2 diabetes. Data are presented as mean SE. *p<0.05 with paired t-test compared to baseline. #p<0.05 with t-test compared to placebo.
Expression of hepcidin, ferroportin and transferrin receptor in MNC
Ferroportin was expressed in MNC but we could find no significant expression of hepcidin in these cells. Ferroportin and TR mRNA expression in MNC increased by 70±13% and 43±10%, respectively after testosterone therapy (p<0.01, figure 4) compared to placebo. There was no change in these indices after placebo.
Figure 4A-B.

Change in mRNA expression of ferroportin (A) and transferrin receptor-2 (B) in MNC following 15 weeks of testosterone (n=20) or placebo (n=14) treatments in HH men with type 2 diabetes. Data are presented as mean SE. *p<0.05 with paired t-test compared to baseline. #p<0.05 with t-test compared to placebo.
Discussion
Our data show clearly that the administration of testosterone increases hemoglobin concentrations and hematocrit significantly in patients with HH over the 15 weeks of testosterone treatment. There is, in parallel, a reduction in plasma hepcidin concentrations while there is a significant increase in the expression of ferroportin, plasma concentrations of transferrin and the expression of transferrin receptor. Consistent with this, total and unsaturated iron binding capacity increased. The increase in unsaturated iron binding capacity was greater, consistent with a reduction in serum iron concentration. In addition, there was a marked increase in the expression of ferroportin. Thus, testosterone treatment potentially facilitates the transport of iron from the intestinal cell and the macrophage into the circulation through the suppression of hepcidin and increase in ferroportin. In addition, it would appear to facilitate the transport within the circulation through an increase in transferrin concentrations and to stimulate the cellular uptake of iron through an increase in the expression of the transferrin receptor at the cellular level. These novel actions are in addition to the known effect of testosterone in increasing erythropoietin concentrations which stimulate erythropoiesis (21).
Ferroportin is responsible for the transport of iron at the cell membrane level. Thus, it facilitates the export of iron by cells of the reticulo-endothelial system and by enterocytes after they have absorbed iron. Hepcidin binds to ferroportin and thus induces the internalization and tyrosine phosphorylation of this cell membrane molecule(19). Ferroportin then gets ubiquitinated and is subjected to proteolytic degradation. The reduction in ferroportin limits the absorption of iron from the gut and the secretion of iron from cells that store iron such as hepatocytes and macrophages. The reduction in hepcidin concentrations would potentially increase cellular expression of ferroportin while facilitating iron export from these cells. Hepcidin also reduces the risk of iron overload since iron induces hepcidin expression. The marked increase in ferroportin is consistent with an increase in iron transport and erythropoiesis.
The increase in transferrin concentrations would potentially facilitate the transport of exported iron and thus increase the bio-availability of iron at the issue and cellular level. It would thus appear that testosterone replenishment in testosterone deficient states may suppress hepcidin while increasing ferroportin, transferrin and transferrin receptor and thus help reverse the anemic state through improvements in iron metabolism, beyond its known role as a modulator of erythropoietin. It is intriguing that there was a significant relationship between the decrease in hepcidin concentration and the increase in erythropoietin concentration following testosterone therapy. This raises the possibility that hepcidin may be a modulator of erythropoietin levels.
Testosterone replacement is well known to increase Hb concentrations (29-31). According to a meta-analysis, testosterone increases hemoglobin and hematocrit by 0.8 g/dl and 3.2% on average (32). The effect of testosterone on hemoglobin is dose-dependent and evident within a month of starting testosterone replacement and generally plateaus by the fourth month (33). Prior studies have shown that testosterone increases the mobilization of iron from stores by suppressing hepcidin (20, 22). In the presence of erythropoietin, this translates into increased iron incorporation into red blood cells and erythropoiesis (34, 35). This is accompanied by an increase in red blood cell mass, decrease in serum ferritin concentrations, and transient increases in serum erythropoietin and soluble transferrin receptor concentrations after testosterone replacement in elderly men (20-22, 33). Testosterone also suppresses the expression of hepcidin in hepatocytes in mice (34). This suppression appears essential to mediate the effect of testosterone on erythropoiesis because testosterone therapy is not able to increase hemoglobin in mice with transgenic overexpression of hepcidin. Testosterone therapy also increases erythropoietin expression in renal tissue and ferroportin expression in splenic macrophages in mice (34). Our study is the first to show an increase in ferroportin expression following testosterone therapy in humans.
Bachman and colleagues have studied the effect of transdermal testosterone replacement in 209 elderly men in a randomized placebo controlled trial for 6 months (21). They found increases in hemoglobin and hematocrit and changes in red blood cell indices that were generally similar in magnitude to our study. In contrast, iron, iron saturation or iron binding capacity did not change in their study but ferritin concentrations decreased. However, the results of both trials suggest an increased utilization of iron. The difference in changes among the various parameters may be reflective of different baseline concentrations and the different patient population. Similar to our study, Bachman et al also found an increase in erythropoietin and a decrease in hepcidin concentrations (21). In addition they found an increase in soluble transferrin receptor in the serum, while we found an increase in serum transferrin concentrations and in transferrin receptor on mononuclear cells. For reasons that are not clear, elderly men are more predisposed to exaggerated erythropoiesis after testosterone replacement therapy as compared to younger men (33, 36). We did not find a relation of age with change in hemoglobin or hematocrit after testosterone therapy. However, the small sample size does not permit us to draw any firm conclusions about this relationship.
The effect of testosterone on erythropoietin has not been consistent in prior studies. Ip et al did not find a relation between change in testosterone and change in erythropoietin concentrations in men treated with testosterone pellets over 8 years (36). Trials of short duration (such as ours) have generally reported a transient increase in erythropoietin concentrations that relapse back to baseline after 6 months (21, 33). This is expected since an increase in hematocrit would be expected to suppress serum erythropoietin concentrations. However, Bachman et al found that for a given hemoglobin concentration, serum erythropoietin concentrations were 30% higher after testosterone treatment for 6 months than they had been at baseline (21).
Hepcidin production is increased by inflammatory mediators; this is the underlying mechanism of anemia of inflammation (19). Hepcidin is induced in vitro by treating hepatocytes with LPS or IL-6. IL-6 antibody also suppresses LPS induced hepcidin release. Its secretion is, however, not affected by TNFα or IL-1β. We have previously shown that testosterone replacement suppresses IL-1β, CRP and TNF-α in men with type 2 diabetes (10). It is therefore possible that following testosterone administration, the suppression of inflammation may contribute to a fall in hepcidin. However, we did not find a relationship between the suppression of inflammatory mediators (IL-1β, CRP and TNF-α) with that of hepcidin concentrations (data not shown). Our results are similar to a previous study of that showed a suppression of hepcidin after testosterone replacement but no change in IL-6, CRP or TNF-α in elderly men (21). It is likely that the effect of testosterone on hepcidin suppression is a direct effect and not mediated via suppression of inflammation since in mice the activation of androgen receptor suppresses hepcidin transcription by attenuating BMP/Smad signaling (34). In this context, it also relevant that hepcidin deletion is associated with iron overload and its overexpression with low iron concentrations(19).
One weakness of our study is that we do not have complete data for all the indices investigated at 24 weeks. However, the data, as they are, for 15 weeks have provided novel and original observations on the effect of testosterone treatment on ferroportin and transferrin receptor expression, plasma transferrin and iron concentrations and the inverse relationship between plasma concentrations of hepcidin and erythropoietin. It is possible that increased erythropoiesis after testosterone replacement may affect HbA1c independently of changes in glycemia. As previously reported, we did not find a change in HbA1c in our study (10). However, subjects were allowed to have changes in their anti-hyperglycemic medications at the discretion of their physician. Studies with careful collection of self-monitored glucose concentrations and measures of glycemia other than HbA1c will have to be designed to evaluate the effect of testosterone on HbA1c independently of glycemia.
The effect of testosterone on erythropoiesis is dose dependent and polycythemia in response to over-replacement with testosterone is well known(33). It is, therefore, possible that eugonadal men with type 2 diabetes as well as men with hypergonadotropic hypogonadism may also show changes in erythropoiesis and iron mobilization consistent with those described after testosterone replacement in men with HH. However, the primary trial was designed to investigate the effects of testosterone replacement on insulin sensitivity in men with HH. The data in this paper are a secondary analysis and we are limited by the population that we studied. Furthermore, testosterone replacement therapy in clinical practice is not provided to eugonadal men. In conclusion, patients with type 2 diabetes and HH when treated with testosterone have a reduction in plasma concentrations of hepcidin and an increase in the expression of ferroportin, plasma concentrations of transferrin and the expression of transferrin receptor. These changes would potentially facilitate a greater bio-availability of iron from the storage/absorption sites, an increase in iron transport in the circulation and the uptake at iron utilization sites. Such changes would thus facilitate erythropoiesis. These novel actions would be in addition to that of the classical effect of increasing plasma erythropoietin concentrations.
ACKNOWLEDGEMENTS
None.
SOURCE OF FUNDING: Supported by National Institute of Diabetes and Digestive and Kidney Diseases (NIDDK) (RO1 grant to PD; R01DK075877)
Footnotes
CONFLICTS OF INTEREST:
SD: Abbvie (speaker panel and research support)
HG: none
MB: none
NK: Novo Nordisk (speaker panel)
SA: none
KG: none
AM: none
AC: Eli Lilly, Sanofi-Avenits (speaker panel)
PD: Research Support: GlaxoSmithKline; Novo Nordisk; Bristol Meyer Squibb; Takeda Pharmaceuticals; Allergan; Sanofi-Aventis; Conjuchem; Dannipon Pharmaceuticals; Proctor and Gamble Pharma; Mitsubishi; Quigley Pharma Inc.; Solvay Pharmaceuticals; Transition Therapeutics; ToleRx
Honorarium: Eli Lilly; Novartis; GlaxoSmithKline; Merck; Novo Nordisk; Takeda; Sanofi-Aventis
Grants: National Institutes of Health; GlaxoSmithKline; Center for Disease Control; Bristol Meyers Squibb; Novartis Pharmaceuticals; Abbott Labs; Takeda Pharmaceuticals; Sankyo Pharmaceuticals North America; Oishei Foundation; Citrus Industry of Florida; Solvay Pharmaceuticals; William G. McGowan Charitable Fund; Millard Fillmore Foundation
References
- 1.Dhindsa S, Prabhakar S, Sethi M, Bandyopadhyay A, Chaudhuri A, Dandona P. Frequent occurrence of hypogonadotropic hypogonadism in type 2 diabetes. J Clin Endocrinol Metab. 2004;89:5462–5468. doi: 10.1210/jc.2004-0804. [DOI] [PubMed] [Google Scholar]
- 2.Dandona P, Dhindsa S. Update: hypogonadotropic hypogonadism in type 2 diabetes and obesity. J Clin Endocrinol Metab. 2011;96:2643–2651. doi: 10.1210/jc.2010-2724. [DOI] [PMC free article] [PubMed] [Google Scholar]
- 3.Grossmann M, Thomas MC, Panagiotopoulos S, Sharpe K, Macisaac RJ, Clarke S, Zajac JD, Jerums G. Low testosterone levels are common and associated with insulin resistance in men with diabetes. J Clin Endocrinol Metab. 2008;93:1834–1840. doi: 10.1210/jc.2007-2177. [DOI] [PubMed] [Google Scholar]
- 4.Kapoor D, Aldred H, Clark S, Channer KS, Jones TH. Clinical and Biochemical Assessment of Hypogonadism in Men With Type 2 Diabetes: Correlations with bioavailable testosterone and visceral adiposity. Diabetes Care. 2007;30:911–917. doi: 10.2337/dc06-1426. [DOI] [PubMed] [Google Scholar]
- 5.Dandona P, Chaudhuri A, Dhindsa S. Therapy for Diabetes Mellitus and Related Disorders. 6th ed. American Diabetes Association; 2014. Hypogonadotropic hypogonadism in type 2 diabetes. pp. 966–993. [Google Scholar]
- 6.Rhoden EL, Ribeiro EP, Teloken C, Souto CA. Diabetes mellitus is associated with subnormal serum levels of free testosterone in men. BJU Int. 2005;96:867–870. doi: 10.1111/j.1464-410X.2005.05728.x. [DOI] [PubMed] [Google Scholar]
- 7.Corona G, Mannucci E, Petrone L, Ricca V, Balercia G, Mansani R, Chiarini V, Giommi R, Forti G, Maggi M. Association of hypogonadism and type II diabetes in men attending an outpatient erectile dysfunction clinic. Int J Impot Res. 2006;18:190–197. doi: 10.1038/sj.ijir.3901391. [DOI] [PubMed] [Google Scholar]
- 8.Mogri M, Dhindsa S, Quattrin T, Ghanim H, Dandona P. Testosterone concentrations in young pubertal and post-pubertal obese males. Clin Endocrinol (Oxf) 2013;78:593–599. doi: 10.1111/cen.12018. [DOI] [PMC free article] [PubMed] [Google Scholar]
- 9.Chandel A, Dhindsa S, Topiwala S, Chaudhuri A, Dandona P. Testosterone concentration in young patients with diabetes. Diabetes Care. 2008;31:2013–2017. doi: 10.2337/dc08-0851. [DOI] [PMC free article] [PubMed] [Google Scholar]
- 10.Dhindsa S, Ghanim H, Batra M, Kuhadiya ND, Abuaysheh S, Sandhu S, Green K, Makdissi A, Hejna J, Chaudhuri A, et al. Insulin Resistance and Inflammation in Hypogonadotropic Hypogonadism and Their Reduction After Testosterone Replacement in Men With Type 2 Diabetes. Diabetes Care. 2016;39:82–91. doi: 10.2337/dc15-1518. [DOI] [PMC free article] [PubMed] [Google Scholar]
- 11.Dhindsa S, Bhatia V, Dhindsa G, Chaudhuri A, Gollapudi GM, Dandona P. The effects of hypogonadism on body composition and bone mineral density in type 2 diabetic patients. Diabetes Care. 2007;30:1860–1861. doi: 10.2337/dc07-0337. [DOI] [PubMed] [Google Scholar]
- 12.Bhatia V, Chaudhuri A, Tomar R, Dhindsa S, Ghanim H, Dandona P. Low testosterone and high C-reactive protein concentrations predict low hematocrit in type 2 diabetes. Diabetes Care. 2006;29:2289–2294. doi: 10.2337/dc06-0637. [DOI] [PubMed] [Google Scholar]
- 13.Dhindsa S, Upadhyay M, Viswanathan P, Howard S, Chaudhuri A, Dandona P. Relationship of prostate-specific antigen to age and testosterone in men with type 2 diabetes mellitus. Endocr Pract. 2008;14:1000–1005. doi: 10.4158/EP.14.8.1000. [DOI] [PubMed] [Google Scholar]
- 14.Grossmann M, Panagiotopolous S, Sharpe K, MacIsaac RJ, Clarke S, Zajac JD, Jerums G, Thomas MC. Low testosterone and anaemia in men with type 2 diabetes. Clin Endocrinol (Oxf) 2009;70:547–553. doi: 10.1111/j.1365-2265.2008.03357.x. [DOI] [PubMed] [Google Scholar]
- 15.Muraleedharan V, Marsh H, Kapoor D, Channer KS, Jones TH. Testosterone deficiency is associated with increased risk of mortality and testosterone replacement improves survival in men with type 2 diabetes. Eur J Endocrinol. 2013;169:725–733. doi: 10.1530/EJE-13-0321. [DOI] [PubMed] [Google Scholar]
- 16.Du Plessis SS, Cabler S, McAlister DA, Sabanegh E, Agarwal A. The effect of obesity on sperm disorders and male infertility. Nat Rev Urol. 2010;7:153–161. doi: 10.1038/nrurol.2010.6. [DOI] [PubMed] [Google Scholar]
- 17.Sermondade N, Faure C, Fezeu L, Shayeb AG, Bonde JP, Jensen TK, Van Wely M, Cao J, Martini AC, Eskandar M, et al. BMI in relation to sperm count: an updated systematic review and collaborative meta-analysis. Hum Reprod Update. 2013;19:221–231. doi: 10.1093/humupd/dms050. [DOI] [PMC free article] [PubMed] [Google Scholar]
- 18.Ferrucci L, Maggio M, Bandinelli S, Basaria S, Lauretani F, Ble A, Valenti G, Ershler WB, Guralnik JM, Longo DL. Low testosterone levels and the risk of anemia in older men and women. Arch Intern Med. 2006;166:1380–1388. doi: 10.1001/archinte.166.13.1380. [DOI] [PMC free article] [PubMed] [Google Scholar]
- 19.Ganz T. Hepcidin and iron regulation, 10 years later. Blood. 2011;117:4425–4433. doi: 10.1182/blood-2011-01-258467. [DOI] [PMC free article] [PubMed] [Google Scholar]
- 20.Bachman E, Feng R, Travison T, Li M, Olbina G, Ostland V, Ulloor J, Zhang A, Basaria S, Ganz T, et al. Testosterone suppresses hepcidin in men: a potential mechanism for testosterone-induced erythrocytosis. J Clin Endocrinol Metab. 2010;95:4743–4747. doi: 10.1210/jc.2010-0864. [DOI] [PMC free article] [PubMed] [Google Scholar]
- 21.Bachman E, Travison TG, Basaria S, Davda MN, Guo W, Li M, Connor Westfall J, Bae H, Gordeuk V, Bhasin S. Testosterone induces erythrocytosis via increased erythropoietin and suppressed hepcidin: evidence for a new erythropoietin/hemoglobin set point. J Gerontol A Biol Sci Med Sci. 2014;69:725–735. doi: 10.1093/gerona/glt154. [DOI] [PMC free article] [PubMed] [Google Scholar]
- 22.Beggs LA, Yarrow JF, Conover CF, Meuleman JR, Beck DT, Morrow M, Zou B, Shuster JJ, Borst SE. Testosterone alters iron metabolism and stimulates red blood cell production independently of dihydrotestosterone. Am J Physiol Endocrinol Metab. 2014;307:E456–461. doi: 10.1152/ajpendo.00184.2014. [DOI] [PMC free article] [PubMed] [Google Scholar]
- 23.Dhindsa S, Miller MG, McWhirter CL, Mager DE, Ghanim H, Chaudhuri A, Dandona P. Testosterone concentrations in diabetic and nondiabetic obese men. Diabetes Care. 2010;33:1186–1192. doi: 10.2337/dc09-1649. [DOI] [PMC free article] [PubMed] [Google Scholar]
- 24.Antonio L, Wu FC, O'Neill TW, Pye SR, Ahern TB, Laurent MR, Huhtaniemi IT, Lean ME, Keevil BG, Rastrelli G, et al. Low Free Testosterone is Associated with Hypogonadal Signs and Symptoms in Men with Normal Total Testosterone. J Clin Endocrinol Metab. 2016:jc20154106. doi: 10.1210/jc.2015-4106. [DOI] [PubMed] [Google Scholar]
- 25.Salameh WA, Redor-Goldman MM, Clarke NJ, Reitz RE, Caulfield MP. Validation of a total testosterone assay using high-turbulence liquid chromatography tandem mass spectrometry: total and free testosterone reference ranges. Steroids. 2010;75:169–175. doi: 10.1016/j.steroids.2009.11.004. [DOI] [PubMed] [Google Scholar]
- 26.Dhindsa S, Furlanetto R, Vora M, Ghanim H, Chaudhuri A, Dandona P. Low estradiol concentrations in men with subnormal testosterone concentrations and type 2 diabetes. Diabetes Care. 2011;34:1854–1859. doi: 10.2337/dc11-0208. [DOI] [PMC free article] [PubMed] [Google Scholar]
- 27.Sodergard R, Backstrom T, Shanbhag V, Carstensen H. Calculation of free and bound fractions of testosterone and estradiol-17 beta to human plasma proteins at body temperature. J Steroid Biochem. 1982;16:801–810. doi: 10.1016/0022-4731(82)90038-3. [DOI] [PubMed] [Google Scholar]
- 28.Vermeulen A, Verdonck L, Kaufman JM. A critical evaluation of simple methods for the estimation of free testosterone in serum. J Clin Endocrinol Metab. 1999;84:3666–3672. doi: 10.1210/jcem.84.10.6079. [DOI] [PubMed] [Google Scholar]
- 29.Shahidi NT. Androgens and erythropoiesis. N Engl J Med. 1973;289:72–80. doi: 10.1056/NEJM197307122890205. [DOI] [PubMed] [Google Scholar]
- 30.Bhasin S, Cunningham GR, Hayes FJ, Matsumoto AM, Snyder PJ, Swerdloff RS, Montori VM. Testosterone therapy in men with androgen deficiency syndromes: an Endocrine Society clinical practice guideline. J Clin Endocrinol Metab. 2010;95:2536–2559. doi: 10.1210/jc.2009-2354. [DOI] [PubMed] [Google Scholar]
- 31.Shahani S, Braga-Basaria M, Maggio M, Basaria S. Androgens and erythropoiesis: past and present. J Endocrinol Invest. 2009;32:704–716. doi: 10.1007/BF03345745. [DOI] [PubMed] [Google Scholar]
- 32.Fernandez-Balsells MM, Murad MH, Lane M, Lampropulos JF, Albuquerque F, Mullan RJ, Agrwal N, Elamin MB, Gallegos-Orozco JF, Wang AT, et al. Clinical review 1: Adverse effects of testosterone therapy in adult men: a systematic review and meta-analysis. J Clin Endocrinol Metab. 2010;95:2560–2575. doi: 10.1210/jc.2009-2575. [DOI] [PubMed] [Google Scholar]
- 33.Coviello AD, Kaplan B, Lakshman KM, Chen T, Singh AB, Bhasin S. Effects of graded doses of testosterone on erythropoiesis in healthy young and older men. J Clin Endocrinol Metab. 2008;93:914–919. doi: 10.1210/jc.2007-1692. [DOI] [PMC free article] [PubMed] [Google Scholar]
- 34.Guo W, Bachman E, Li M, Roy CN, Blusztajn J, Wong S, Chan SY, Serra C, Jasuja R, Travison TG, et al. Testosterone administration inhibits hepcidin transcription and is associated with increased iron incorporation into red blood cells. Aging Cell. 2013;12:280–291. doi: 10.1111/acel.12052. [DOI] [PMC free article] [PubMed] [Google Scholar]
- 35.Fried W, Gurney CW. The erythropoietic-stimulating effects of androgens. Ann N Y Acad Sci. 1968;149:356–365. doi: 10.1111/j.1749-6632.1968.tb15169.x. [DOI] [PubMed] [Google Scholar]
- 36.Ip FF, di Pierro I, Brown R, Cunningham I, Handelsman DJ, Liu PY. Trough serum testosterone predicts the development of polycythemia in hypogonadal men treated for up to 21 years with subcutaneous testosterone pellets. Eur J Endocrinol. 2010;162:385–390. doi: 10.1530/EJE-09-0717. [DOI] [PubMed] [Google Scholar]