Abstract
Purpose
The inhibition of the rate of evaporation (Revap) by surface lipids is relevant to reservoirs and dry eye. Our aim was to test the idea that lipid surface films inhibit Revap.
Methods
Revap were determined gravimetrically. Hydrocarbon chain conformation and structure were measured using a Raman microscope. Six 1-hydroxyl hydrocarbons (11–24 carbons in length) and human meibum were studied. Reflex tears were obtained from a 62-year-old male.
Results
The Raman scattering intensity of the lipid film deviated by about 7 % for hydroxyl lipids and varied by 21 % for meibum films across the entire film at a resolution of 5 µm2. All of the surface lipids were ordered. Revap of the shorter chain hydroxyl lipids were slightly (7%) but significantly lower compared with the longer chain hydroxyl lipids. Revap of both groups was essentially similar to that of buffer. A hydroxyl lipid film did not influence Revap over an estimated average thickness range of 0.69 to >6.9 µm. Revap of human tears and buffer with and without human meibum (34.4 µm thick) was not significantly different. Revap of human tears was not significantly different from buffer.
Conclusions
Human meibum and hydroxyl lipids, regardless of their fluidity, chain length, or thickness did not inhibit Revap of buffer or tears even though they completely covered the surface. It is unlikely that hydroxyl lipids can be used to inhibit Revap of reservoirs. Our data do not support the widely accepted (yet unconfirmed) idea that the tear film lipid layer inhibits Revap of tears.
Keywords: dry eye, meibum, hydroxyl lipids, tear evaporation, tear film lipid layer
I. INTRODUCTION
The inhibition of the rate of evaporation of water (Revap) by surface lipids is relevant to reservoirs and dry eye. Evaporation occurs when a water molecule obtains enough energy to break water-water bonds and move from liquid water into the air. Numerous formulas have been developed to model basic evaporation theory.1–3 Factors such as temperature, humidity, and wind speed contribute to Revap. The evaporation through duplex films4 and evaporation-driven instability of the precorneal tear film5 has been reviewed and some of the studies are highlighted below.
A. Revap of Large Reservoirs and Lipid Film In Vitro
Much of what we know about the evaporation of water through lipid films comes from studies focused on inhibiting Revap of large reservoirs.6 Reservoirs can lose up to 8 feet of water a year due to evaporation.6 Controlling evaporation is critical for reservoirs in arid regions. The idea that a monolayer of lipid could inhibit Revap came from a seminal paper published about 90 years ago.7 Twenty-five years later, a study showed that hydrocarbon chain length and inhibition of Revap were directly correlated.8 Most of the studies related to the role of lipid films and evaporation prior to 1986 9 and recently4 have been reviewed. A novel thermogravimetric method allowed for a more careful study of the evaporation rate through films.10 Theoretical studies suggested that the passage of water molecules through a monolayer occurred through ‘sufficiently large holes which form spontaneously in the monolayer.11 Efforts to optimize the conditions for evaporation controlled by monolayers12 involved the study of soluble surfactants,13 mixed monolayers of octacecanol and cholesterol,14 cetyl alcohol and poly(vinyl stearate) mixtures,15 and octadecanol and cetyl alcohol.16 It was suggested that cetyl alcohol dissolved in turpentine could be used to slow the evaporation of water in reservoirs by 0–65% when the total amount applied forms a layer with an average estimated thickness of 0.14 to 0.6 µm. 6,17
B. The Tear Film Lipid Layer and Revap of Tears In Vivo
Revap of tears is relevant to dry eye disease, which has been classified as aqueous production-deficient and evaporative.18 The latter is associated with meibomian gland dysfunction (MGD).18 Both mechanisms of development of dry eye share the common feature of instability of the tear film with rapid tear film break-up time (TFBUT) and higher osmolarity. Dry eye affects over six million people in the United States alone.19 About half the cases of dry eye have been classified as purely evaporative or mixed evaporative and MGD.20 Tears evaporate at the same rate as buffer, and it was calculated that a wisp of dry air could evaporate the tears on the surface of the eye in 3 s.21
A thin 0.1 µm thick tear film lipid layer (TFLL) covers the surface of tears.22,23 It has been suggested that one of the functions of the TFLL is to inhibit Revap of the 3 µm aqueous layer of tears below it.24 Support for this idea comes from rabbit studies done over 50 years ago showing that adding lipids to lipid depleted eyes decreased Revap by over 75%.25,26 Furthermore, wax ester films about as thick as the TFLL were found to inhibit evaporation (30 to 50%) when they were within 2% of their melting temperature,27 a temperature where fluid and ordered phases co-exist.28 The wax ester, ethyl stearate, had a specific resistance (to evaporation) between that of 1-octadecanol and steric acid.16
In vivo studies show that “where the human lipid layer is absent, or is not confluent, and the tear film is unstable, tear evaporation is increased four-fold. However, where there is a stable intact lipid layer, regardless of lipid thickness, tear evaporation is retarded.”29 Thermographic images are remarkably similar to fluorescein breakup images, implying that localized breakup is caused by localized high evaporation.30–33 The most likely cause of local high evaporation is that the lipid layer has a poor evaporation resistance in that region (compared to higher resistance in surrounding regions. Indeed, TFBUT,29 but not tear production,34 were inversely correlated with evaporation rates. Similarly, the temperature variation factor and evaporation rates were related.35 The dynamics and function of the tear film in relation to the blink cycle has been reviewed and the authors favor the idea that the changes in the rate of evaporation through the lipid layer plays a role in tear film instability and dry eye.36
Based on the studies above, it would be informative to determine how meibum composition, structure and the rate of evaporation are related using carefully controlled conditions in vitro. Surprisingly, three studies showed that a film of human4,37,38 and bovine39 meibum does not inhibit the evaporation of buffer in vitro, as the rheology of meibum on artificial tears is different than for meibum on buffer.39
In the current study, we tested the idea that components in human tears, such as proteins, interact with human meibum placed on the surface of human reflex tears and together they inhibit Revap. We repeated earlier studies involving the inhibition of evaporation of water in reservoirs by cetyl and other alcohols but under controlled conditions in the laboratory. Raman spectroscopy was used to measure the conformation of human meibum and synthetic lipids on the surface of tears and physiologically balanced saline in vitro and to confirm the formation of a uniform film. Raman spectroscopy has been used to study the conformation, saturation and composition of meibum ex-situ40 and in-situ,41 and to study drugs, bacteria, and viruses in tears.42–47 Raman spectroscopy measures vibronic transitions that are useful for quantifying composition and structure; is non-invasive and the instrument we used could measure composition and structure on regions as small as 5 µm3 (about the size of a cell). This is ideal for measuring composition/structure relationships in small samples of tear lipids. Measurement of lipid molecular (conformation) and macromolecular (clustering/uniform spreading) structure on an aqueous surface by Raman spectroscopy has rarely been applied to study lipids and has never been applied to study tear lipids.
II. MATERIALS AND METHODS
A. Materials
All 1-hydroxyl hydrocarbons and physiological buffered saline (PBS) were purchased from Sigma Chemical Company (St. Louis, MO).
B. Collection of Meibum Lipids and Tears
Reflex human tears were obtained by exposing a 62-year-old Caucasian male, with no signs or symptoms of dry eye, to the lachrymatory factor in the vapor of freshly cut onions for about three minute intervals.48 Stimulated tears, such as those investigated here, have been reported to have a viscosity/shear rate comparable with those in unstimulated tears. 49,50
Normal meibum lipid was obtained from living subjects without dry eye symptoms using a platinum spatula. About 0.5 mg of meibum was collected per individual for direct spectroscopic study. Written informed consent was obtained from all donors, and protocols and procedures were approved by the University of Louisville Institutional Review Board; procedures were in accordance with the Declaration of Helsinki. Raman spectra were measured without any additions or perturbations to the sample, as described below. Samples were stored in the dark under argon at −30°C for one day to a week before Raman spectra were measured.
C. Evaporation Rate Studies
Evaporation rates were measured gravimetrically as reported previously21,51 but with the following changes. PBS (0.750 mL) was placed into a plastic container 0.8 cm deep with an inside diameter of 1.5 cm as previously reported.21,51 Lipid was placed on the surface of the PBS and its weight recorded to 5 decimal places using a Mettler-Toledo AT261 analytical balance (Columbus, OH). The balance was calibrated and certified by a Mettler technician. To ensure the dispersion of the wax on the surface, the sample was then sonicated for 10 s using a microprobe Sonifier® cell disrupter 185 (Branson, Ultrasonics Co., Danbury CT). After a 1- minute delay the sample was sonicated again for 15 s.
To measure Revap, the sample weight was measured to 5 decimal places every 10 minutes for 1 hour using a Mettler-Toledo AT261 analytical balance (Columbus, OH). Revap was calculated from the slope of the fitted line obtained by least squares linear regression analysis. The Revap for PBS with no lipid was always measured with every sample as a control. In the Revap calculations, a density of 1 mg/mL was assumed for PBS. Average lipid layer thickness was estimated using a density of 0.82 g/cm3, assuming a uniform lipid layer.
D. Collection and Processing of Raman Spectra
Raman spectra were measured using a laser Raman microscope (Renishaw, Gloucestershire, UK). The sample was placed on a temperature controlled sample stage kept at 33°C for meibum and 25°C for the hydroxyl lipids and coherent light from a He-Ne laser with a power of 2 mW and an excitation wavelength of 632.8 nm was focused on the sample using a 50 × objective lens. The measurements were made with the normal mode of the system. To minimize heating, samples were illuminated 10 times for 10 s with a total exposure time of 100 s. For every acquisition, 40 spectra were obtained. Raman scattering from the sample was collected with the same lens and detected by a CCD camera. A grating of 1/1800 mm/groove for the visible region with confocal mode was chosen. Raman data analysis was performed with GRAMS/386 software (Galactic Industries, Salem, NH, USA).
Data are presented as the mean ± the standard deviation unless indicated. A P<.01 was considered statistically different when means were tested using the Student’s t-test.
III. RESULTS
A. Raman Spectroscopy of Synthetic Lipids and Meibum on Buffer and Tears In Vitro
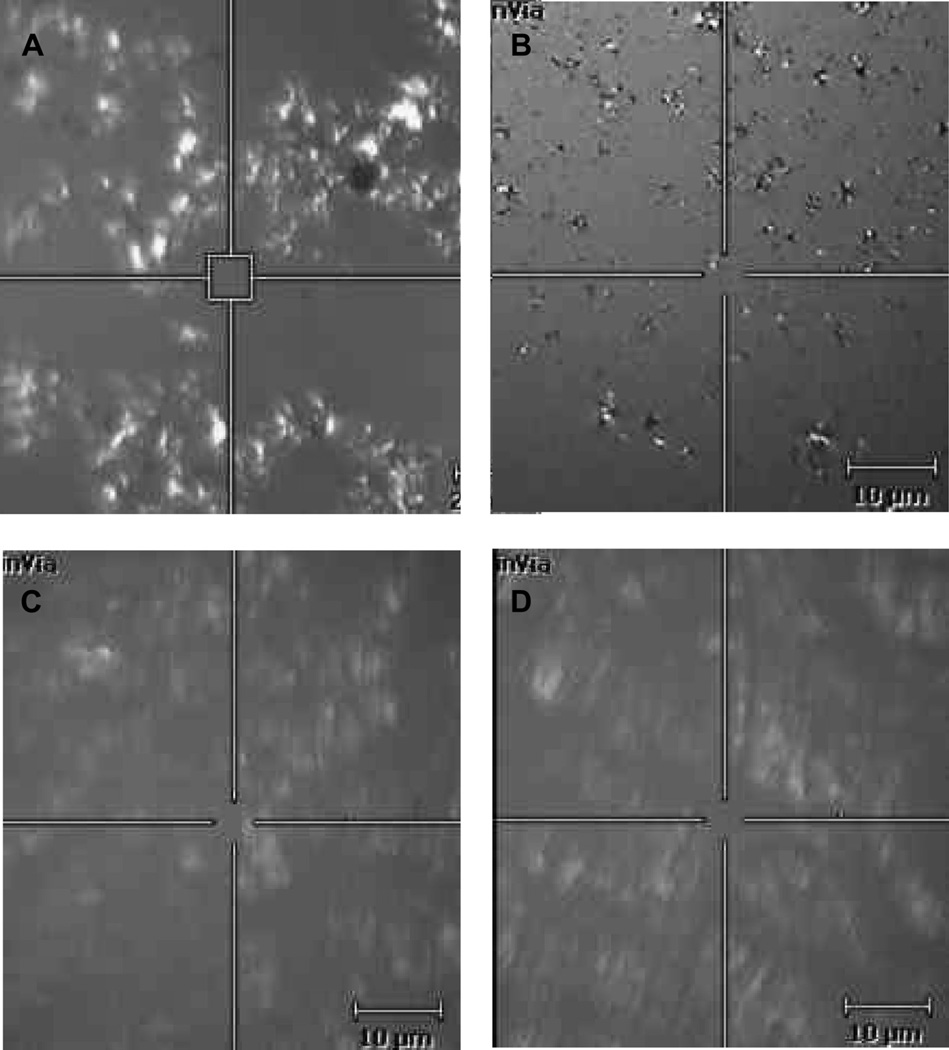
Revap of 6 1-hydroxyl hydrocarbon films was tested in this study (Table 1). Raman spectroscopy was used to test if the lipid formed a uniform film over the aqueous. We chose to investigate the spreading characteristics of two synthetic lipids, 1-undecanol and 1-tetracosanol, that encompass the extremes of the physical and structural properties of the lipids we studied. 1-undecanol has 11 carbons and is a liquid at 25°C (melting point, 11°C), whereas 1-tetracosanol is a longer chain alcohol containing 24 carbons and is solid at 25°C (melting point, 75°C, Table 1). The Raman microscope shows that both lipids form irregular crystalline looking patches on the surface of PBS (Figure 1). A density of 0.82 g/cm3 was used to estimate an average lipid layer thickness of 0.69 µm.
Table 1.
Sample parameters
| Sample | Number of carbons |
Phase transi- tion temperature (°C) |
|---|---|---|
| 1-Undecanol | 11 | 11 |
| 1-Dodecanol | 12 | 22 to 26 |
| 1-Tridecanol | 13 | 29 to 34 |
| 1-hexadecanol | 16 | 49 to 50 |
| 1-Docosanol | 22 | 65 to 72 |
| 1-Tetracosanol | 24 | 75 |
| Meibum | C61M | 29.3 ± 0.4 |
| Meibum | C21F, C19F, B39F, C61M |
28.9 ± 0.6 |
| Meibum | C4M, C4M, C6F | 34.8 ± 0.5 |
C, Caucasian; B, Black; M, male; F, female.
Numbers between the letters are the age of the donor in years.
Figure 1.
Typical pictures taken using a Raman spectrometer showing the surface of synthetic lipid alcohol films under white light on the surface of physiologically buffered saline. The 5 µm2 box is the area sampled by the Raman laser. Lipids on the surface were in motion and slowly moved in and out of the field of view. A and B: 1-tetracosanol. C and D: 1-undecanol. The estimated average thickness of the lipid layer was 0.69 µm, about 7 times thicker than the tear film lipid layer.
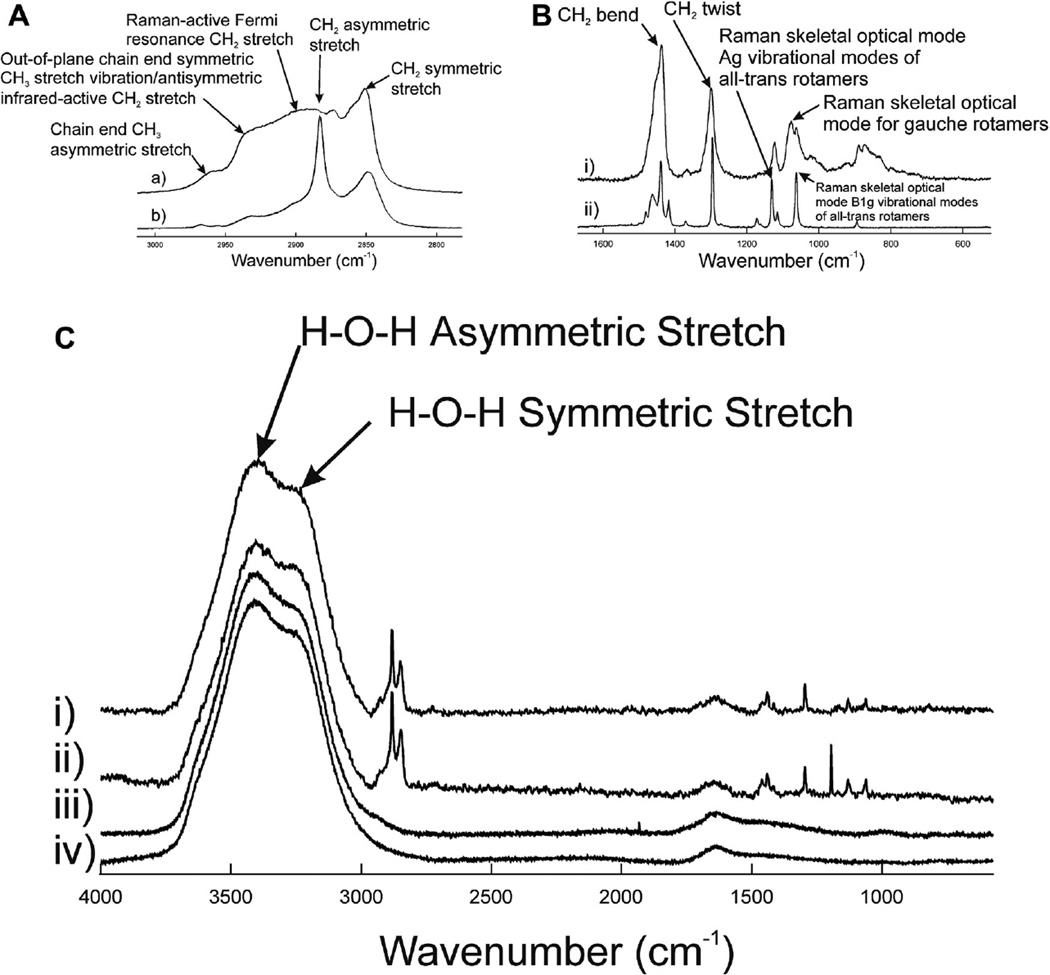
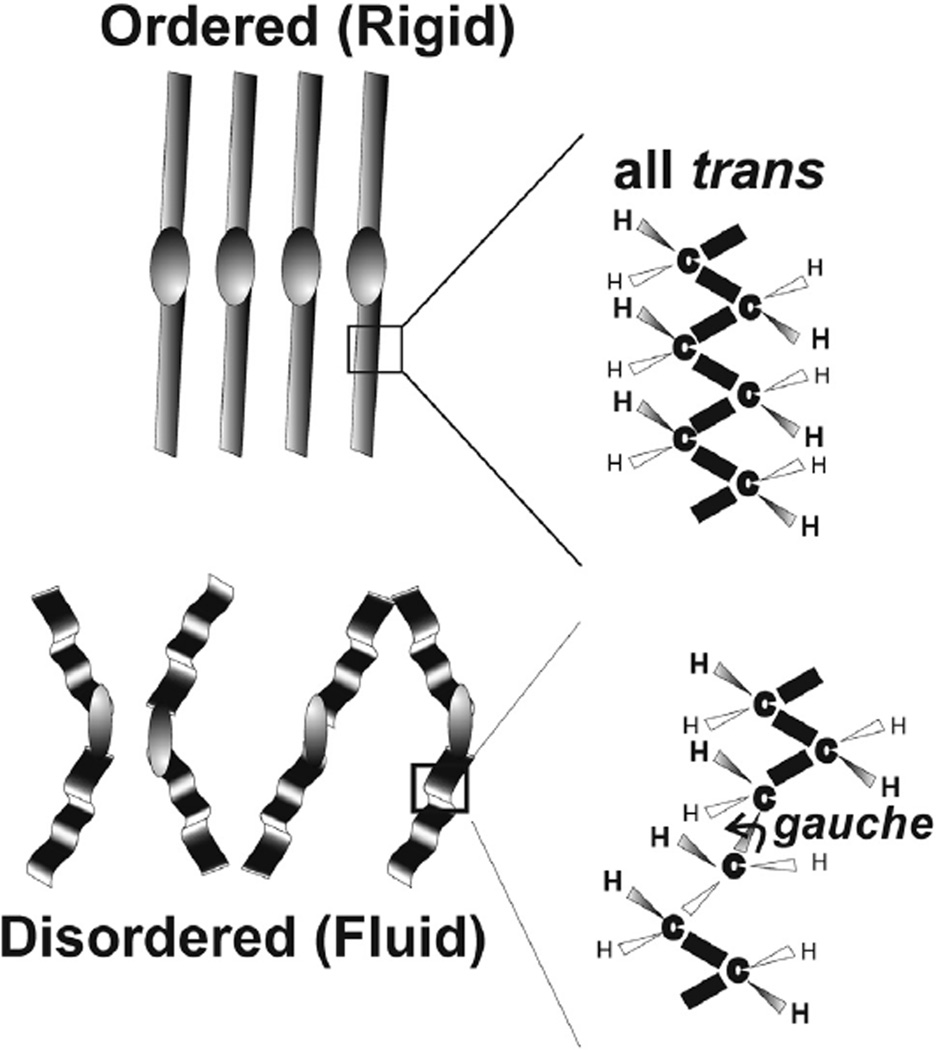
Five bands were resolved in the Raman CH stretching region for liquid 1-undecanol (Figure 2Aa) and 1-tetracosanol (Figure 2Ab). The bands were typical for hydrocarbons and the assignments for this region were made previously.52 The CH2 stretching band at 2890 cm−1 is a Fermi resonant band that is sensitive to intra- and interchain interactions and has been used to measure the structural order or fluidity of human meibum.40 About 50% of the relative intensity of this band is influenced by trans and gauche rotamer content (Figure 3). Lateral packing interactions between chains contributes to the other 50% of the intensity. When there are fewer lipid-lipid interactions, as when lipids are disordered and fluid, the intensity of the 2890 cm−1 band is less, whereas there is relatively little change in the 2850 cm−1 band. The peak height ratio I2886/I2850 was used to quantify SLATERAL, which is an order parameter that was designed to provide a quantitative estimate of the degree of lateral interaction.52,53 The peak height intensity ratio, I2886/I2850, was 0.76 for 1-undecanol and 1.95 for 1-tetracosanol. SLATERAL calculated from these ratios were 0.04 and 0.83 for 1-undecanol and 1-tetracosanol, respectively which indicates that 1-undecanol was almost completely disordered whereas 1-tetracosanol was significantly ordered. When lipid hydrocarbons are ordered as 1-tetracosanol is, the hydrocarbon chains are strait in an all trans conformation maximizing van der Waals’ interactions between chains. Bands due to trans rotamers are well resolved in the Raman spectra of 1-tetracosanol (Figure 2Bii). When lipid hydrocarbons are disordered as in liquid 1-undecanol, the hydrocarbon chains are bent, minimizing van der Waals’ interactions between chains. The bends are due to gauche rotamers in the hydrocarbon chains. The band due to gauche rotamers is well resolved in the Raman spectra of 1-undecanol (Figure 2Bi).
Figure 2.
A: Raman CH stretching region. B: Raman Fingerprint region. Typical Raman spectra of i) liquid 1-undecanol and ii) 1-tetracosanol. C: Raman spectra of aqueous samples i) 1-undecanol 0.69 µm thick on buffer, ii) 1-tetracecanol 0.69 µm thick on buffer, iii) human tears, iv) buffer.
Figure 3.
Schematic of ordered and disordered wax conformations. Lipid order is related to viscosity and indirectly related to fluidity. Gauche rotamers cause kinks in the hydrocarbon chain that disrupts tight packing. The more trans rotamers and the less gauche rotamers, the more ordered the lipid.
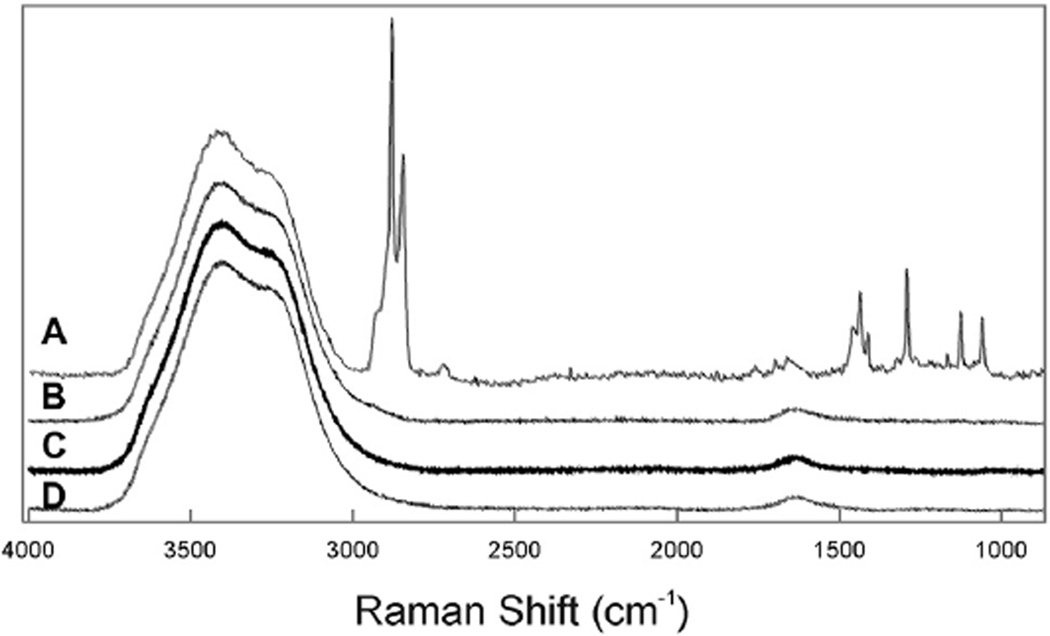
The area of the CH stretching bands can be used to estimate the amount of lipid in the 5 µm2 region sampled by the incident laser. Besides the large Raman H-O-H stretching bands from water near 3,400 cm−1,54 the CH stretching bands predominant the spectra of 1-hydroxylhydrocarbons on the surface of buffer (Figure 2C). The area of the CH stretching band was relatively uniform on the surface of the buffer and deviated by only 8 ± 5% of the average for 1-undecanol and 6 ± 5% of the average for 1-tetracosanol.
The peak height intensity ratio for 1-undecanol and SLATERAL was significantly larger (P<.0001) on the surface of buffer compared with the liquid, 1.7 ± 0.1 and 0.66 ± 0.02, respectively. This indicates that the lipid-lipid interactions associated with 1-undedcane changed from completely disordered when alone to a more ordered state when placed on the aqueous surface. The peak height intensity ratio for 1-tetracosanol and SLATERAL was not significantly different (P>.05) on the surface of buffer compared with the solid, 1.8 ± 0.1 and 0.70 ± 0.03, respectively.
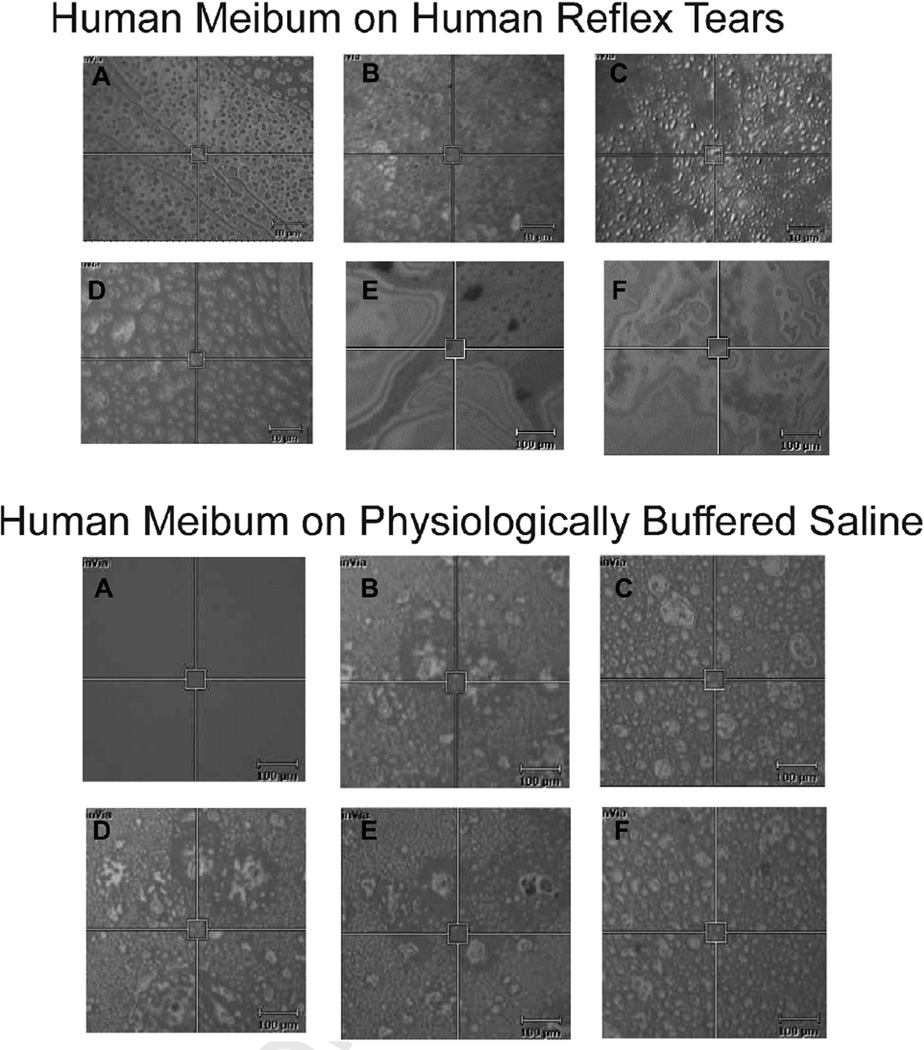
In the Raman spectrometer, the surface of reflex human tears appeared in vitro as 2 µm diameter (Figure 4A–D) and larger 10 µm diameter (Figure 4E) ‘islands’ and as no islands at all (Figure 4F). The islands were in motion and moved in and out of the field of view. Human meibum placed on the surface of reflex tears appeared more densely packed with 5 µm2 ‘islands’ occasionally visible (Figure 4 top). At a smaller magnification, occasional large dark 70 µm2 regions were visible surrounded by a colorful swirl of surface lipids (Figure 4, top, E and F), much like the rainbow swirl of motor oil in a puddle. Qualitatively, the texture or roughness of the surface of Meibum placed on buffer (Figure 4 bottom) was greater than that of meibum placed on human tears (Figure 4 top).
Figure 4.
Typical pictures taken under white light using a Raman spectrometer showing human meibum applied to the surface of (top) human reflex tears or (bottom) PBS, at a lipid thickness of 35.5 µm. The 5 µm2 box is the area sampled by the Raman laser. Scale bar is 10 µm2 in top A-D and bottom figures and 100 µm2 in top E–F. Lipids on the surface were in motion and slowly moved in and out of the field of view.
All of the regions of the surface of reflex tears, even those without islands, provided a Raman CH stretching region spectrum characteristic of lipid and water (Figure 5A). It was evident that the lipid film covered the entire surface. Raman spectra were taken from at least 5 regions of each of the samples. The intensity of the CH stretching bands varied by a relative standard deviation of 21 ± 13%.
Figure 5.
Typical Raman spectra. A: The surface of human reflex tears in vitro. B: Human reflex tears in a capillary tube. C: Physiologically buffered saline. D: Water.
To examine the Raman spectra of tears below the surface, tears were collected in a capillary tube and the Raman spectra of the tears in the tube were measured (Figure 5B). No lipid was detected in these spectra (Figure 5B) which were characteristic of buffered saline (Figure 5C) or water (Figure 5D).
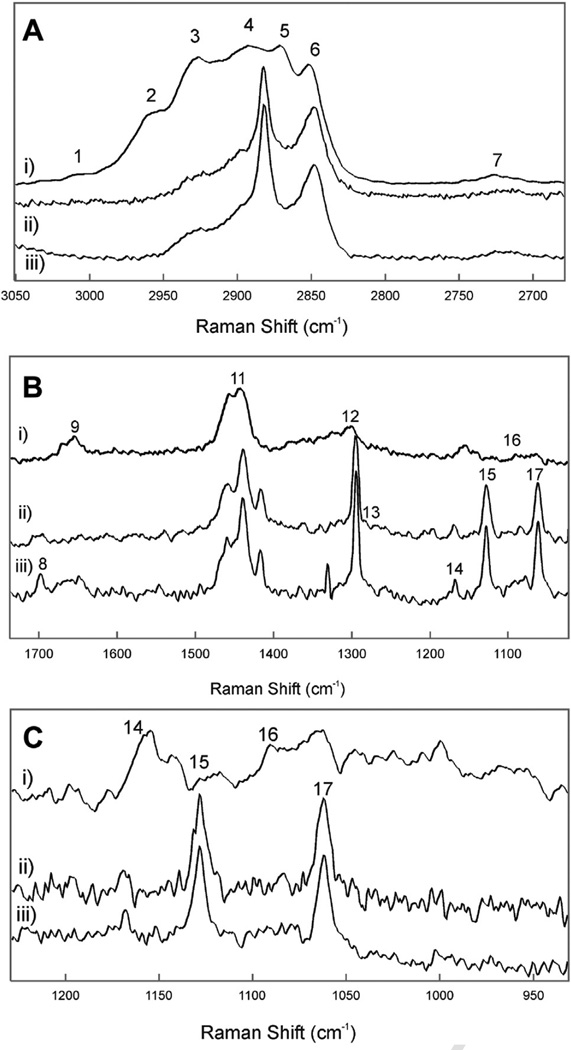
Meibum from human donors without dry eye symptoms were collected over a range of ages (Table 2). The CH stretching bands were predominant in the Raman spectra of the human Meibum samples (Figure 6Ai). The spectra were typical and similar to published Raman spectra of human meibum.40 Band assignments for this region were made previously and are listed in Table 3.40 Seven bands were resolved in the CH2 stretching region.
Table 2.
Pooled meibum and reflex tear sample demographics
| Sample number | Demographics *,‡ | Average Slateral | ||
|---|---|---|---|---|
| 1 on Tears | C61M | 1.67 ± 0.06 (n = 5) | 0.64 ± 0.04 (n = 5) | |
| 2 pooled on Tears | C21F, C19F, B39F, C61M | 1.7 ± 0.2 (n = 3) | 0.63 ± 0.11 (n = 3) | |
| 3 pooled on Tears | CM4, CM4, CF6 | 1.52 ± 0.07 (n = 12) | 0.55 ± 0.05 (n = 12) | |
| 3 pooled on buffer | CM4, CM4, CF6 | 1.5 ± 0.2 (n = 12) | 0.54 ± 0.11 (n = 5) | |
| Reflex Tears | C61M (3 collections) | 1.7 ± 0.1 (n = 8) | 0.66 ± 0.07 (n = 8) | |
| Meibum | Samples 1, 2 and 3 | 1.14 ± 0.04 (n = 3)† | 0.30 ± 0.01 (n = 3)†; |
A, Asian; C, Caucasian; B, Black; M, male; F, Female. Number is age in years.
Significantly different from all of the other samples, P<.001.
Samples were not pooled unless indicated.
Figure 6.
Typical Raman spectra of i) meibum; ii) human reflex tear surface; iii) human reflex tears plus meibum. A: The CH stretching region. B: The ‘fingerprint’ region. C: C-C acoustic mode region. Numbers correspond with the band assignments in Table 3.
Table 3.
Raman band assignments
| Band number in Figures |
Frequency (cm−1) | Assignment |
|---|---|---|
| 1 | 3010 | Unsaturated =CH stretch |
| 2 | 2958 | Chain end CH3 asymmetric stretch |
| 3 | 2935/2928 | Out-of-plane chain end symmetric CH3 stretch vibration/antisymmetric infrared- active CH2 stretch |
| 4 | 2894–2884 | Raman-active Fermi resonance CH2 stretch |
| 5 | 2870 | Chain end CH3 symmetric stretch |
| 6 | 2846 | CH2 symmetric stretch band |
| 7 | 2725 | C-H stretch |
| 8 | 1740 | C=O |
| 9 | 1650 | C=C, Amide I |
| 10 | 1516 | Coupled and conjugated C=C in-plane stretch |
| 11 | 1439 | CH2 bend |
| 12 | 1300 | CH2 twist |
| 13 | 1260 | =C-H in-plane deformation, unconjugated |
| 14 | 1156 | C-C stretch in conjugated C=C molecules |
| 15 | 1133 | Raman skeletal optical mode Ag vibrational modes of all-trans rotamers |
| 16 | Raman skeletal optical mode for gauche rotamers | |
| 17 | 1064 | Raman skeletal optical mode B1g vibrational modes of all-trans rotamers |
| 18 | 720 | C-C twist |
Native tear film lipid on the surface of reflex collected tears was significantly (P=.005) larger with a peak height intensity ratio, I2886/I2850 and SLATERAL, compared with human meibum alone (Table 2). This means that the native tear lipid was much more ordered than human meibum alone. Similarly, when placed on the surface of tears in vitro, the hydrocarbon chains of meibum became significantly (P<.01) more ordered as the ratio I2886/I2850 and SLATERAL were significantly (P<.01) higher compared with human meibum alone (Table 2). There was no significant difference (P>.44) between the ratios I2886/I2850, or SLATERAL, of meibum placed on the tears compared with native tear lipids or compared with meibum placed on buffer.
The Raman skeletal optical mode region for meibum lipids is shown in Figure 6Ci. Bands at 1064 and 1133 cm−1 are assigned to the B1g and Ag vibrational modes of all-trans-, ordered- chain segments and a band near 1080 cm−1 is due to gauche rotations that lead to disordered hydrocarbon chains.40 The intensity of the two bands due to trans rotamers are smaller and the gauche rotamer band is much larger in the spectrum of human meibum compared (Figure 7Ci) with the spectrum of meibum on tears (Figure 6Cii) and native tear lipids (Figure 6Ciii). The Raman skeletal optical mode region confirms the results inferred from the CH2 stretching band intensity measurements; when meibum was placed on the surface of tears in vitro, the hydrocarbon chains became more ordered and that native lipids on the surface of tears are very ordered containing trans rotamers.
Figure 7.
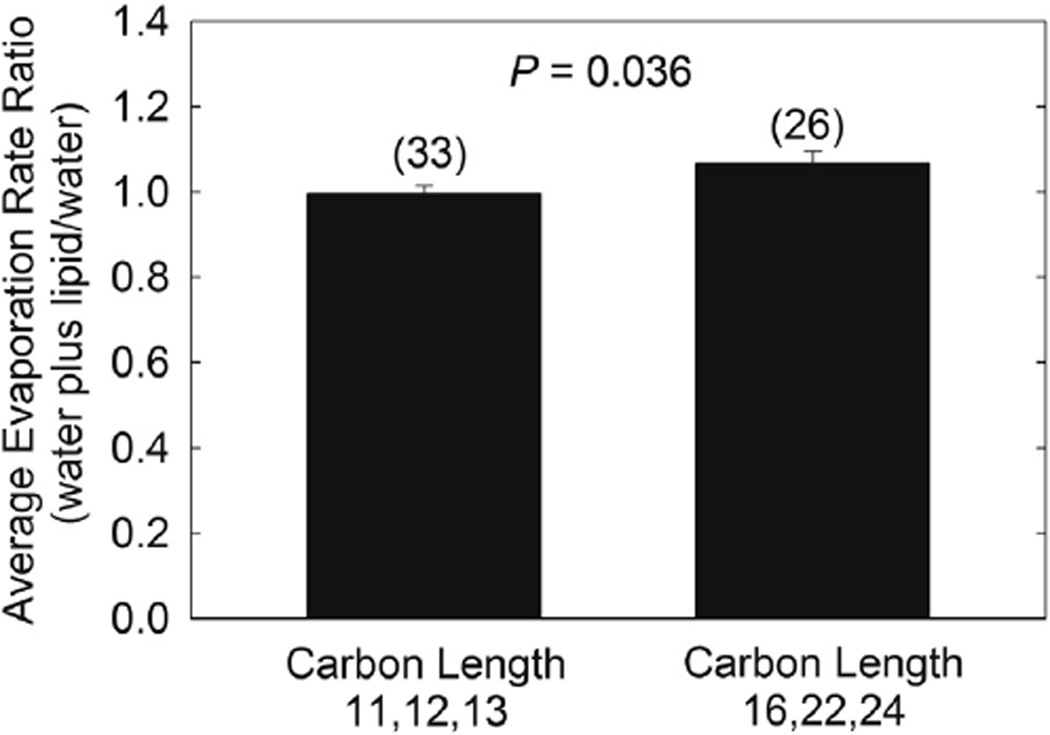
The relative rate of evaporation of buffer at 22°C with 0.69 µm thick 1-hydroxyl n-hydrocarbons films on the surface. There was no difference in Revap of the shorter chain alcohols (11–13 carbons) or between the longer chain alcohols (16–24 carbons), P>.05, so the shorter chain alcohols and the longer chain alcohols were averaged separately. The evaporation rate ratio, buffer plus lipid/buffer, of the shorter chain alcohols was 00.99 ± 0.10 slightly but significantly lower compared with the longer chain alcohols 1.07 ± 0.15, P=.04. Values in parenthesis are the number of trials.
B. Rate of Evaporation of Lipid Films on Buffer and Human Reflex Tears
Revap of buffer was linear over a 138 hour period r = 0.99 ± 0.01 and 0.993 ± 0.009 for 12 samples without and with an estimated 0.69 µm thick film of 1-hexadecanol, respectively. Revap of samples with lipid were linear when measured over a 100 minute period with an average correlation coefficient of 0.998 ± 0.001, so we measured Revap of all of the lipids in Table 1 over a 100-minute period. The average Revap of buffer at 22°C and a relative humidity of 55% was 3.8 ± 0.6 µm/min.
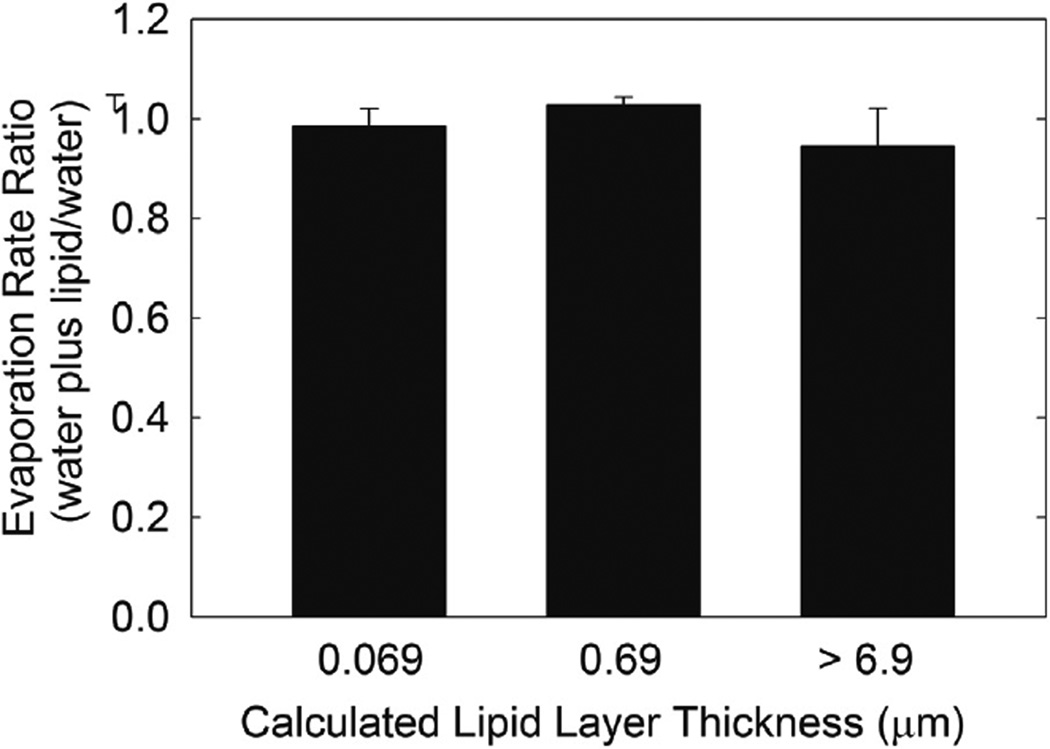
At an estimated film thickness of 0.69 µm, there was no difference in Revap of the shorter chain alcohols (11–13 carbons) or the longer chain alcohols (16–24 carbons), P>.05, so the shorter chain alcohols and the longer chain alcohols were averaged separately. Revap ratio, buffer plus lipid/buffer, of the shorter chain alcohols was 0.99 ± 0.10, slightly but significantly lower compared with the longer chain alcohols of 1.07 ± 0.15, P=.04 (Figure 7). Revap of both samples was essentially similar to that of buffer. The thickness of the lipid film did not influence the Revap ratio (P>.05) over a range of 0.69 to >6.9 µm, with a respective Revap ratio range of 1.01 ± 0.06 to 0.94 ± 0.24 µm/min (Figure 8). The estimated thickness range of the samples included in the bar labeled >6.9 µm was 6.9 to 34 µm and the bar had the greatest standard deviation since lipid was applied directly to the buffer and the amount varied.
Figure 8.
The relative rate of evaporation of buffer at 22°C with the synthetic lipids listed in Table 1 on the surface. Hydrocarbon chain length had a minimal influence of Revap so data from all the lipids for each estimated thickness were averaged. The thickness of the lipid film did not influence the evaporation rate ratio (P>.05). Values in parenthesis are the number of trials.
Over a 138 hour period, Revap of 1-hexadecanol was the same as that of buffer, P=.26. Sonication did not change Revap, P>.06.
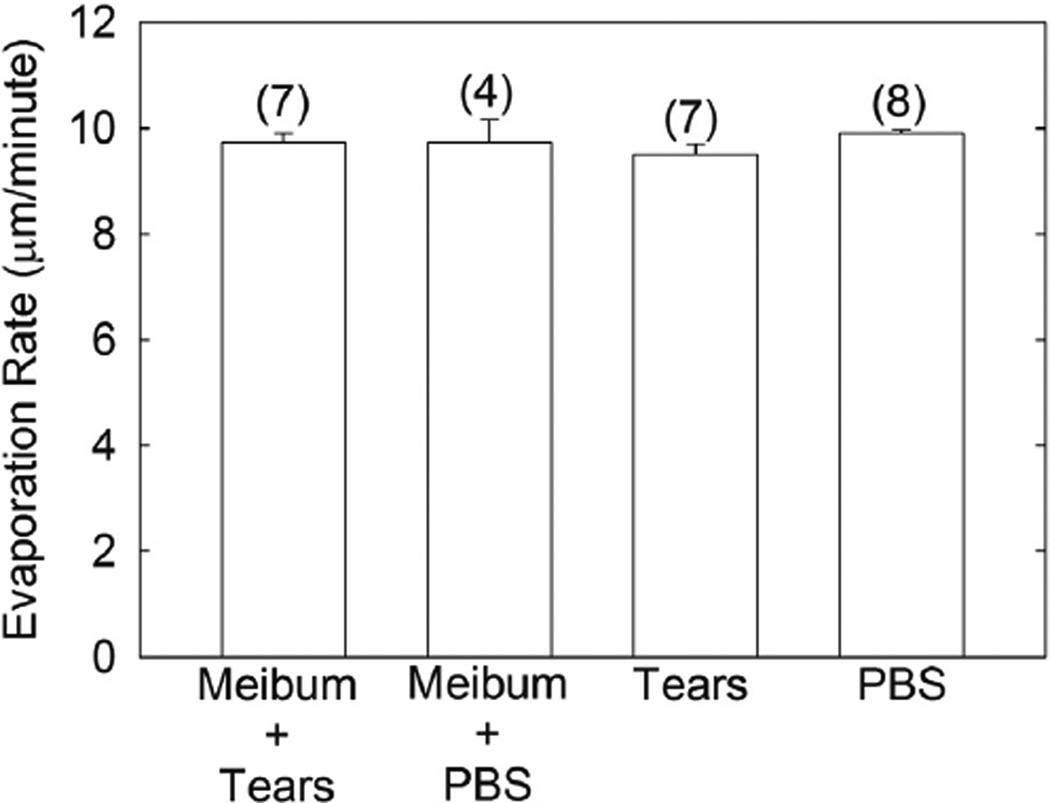
Revap of buffer and human tears with a film of human meibum 34.4 µm thick was measured at 34°C. Revap of human tears and buffer with and without human meibum was not significantly different, P>.05 (Figure 9). Revap of human tears was not significantly different P>.05 (Figure 9) from buffer at an estimated thickness of 34 µm.
Figure 9.
The evaporation rates of buffer and human tears with a film of human meibum 34.4 µm thick was measured at 34°C. The evaporation rate of human tears and buffer with and without human meibum was not significantly different, P>.05. Results from the three pools of meibum in Table 1 were averaged. Bars are ± standard error of the mean. Values in parenthesis are the number of trials.
IV. DISCUSSION
As stated in the Introduction, the idea that a lipid layer on an aqueous surface inhibits Revap of the underlying aqueous is not only intuitively logical, but is also supported by many studies. Studies involving lamellar lipids in the stratum corneum suggest that these lipids inhibit the Revap of skin.55 The idea is so widely accepted that often studies that are not in agreement with the widely accepted idea are overlooked. Some of the studies that indicate that a surface lipid layer does not inhibit evaporation are presented in the following discussion.
A. 1-Hydroxylhydrocarbons and Revap
Intuitively, one would expect that a hydrophobic uniform layer of lipid on an aqueous surface would inhibit Revap of water. As stated in the Introduction, studies done over 60 years ago suggest that lipids on the aqueous surface offer resistance to evaporation7,8 and perhaps could be used to slow the evaporation of water in reservoirs.17 In the current study, we repeated earlier studies involving the inhibition of evaporation by 1-undecanol and other alcohols.6 Raman spectroscopy was used to measure the conformation of human meibum and synthetic lipids on the surface of tears and PBS in vitro, and to visualize the film.
In our study, long chain alcohols did not attenuate Revap of buffer, even when they were an estimated 345 µm thick. This is in agreement with four trials with control and experimental reservoirs (Capella study) of equal size and one of three trials using the unequally sized reservoirs at Derenbandi that showed that cetyl alcohol did not inhibit Revap,6 leading one to wonder if a thin monolayer on the surface of a reservoir is sufficient to reduce Revap. If careful layering of lipid on the surface of buffer in the laboratory did not inhibit evaporation, it is unlikely that simply placing lipid on a pond with the wind, rain, lipid degradation and impurities will have much of an effect on the rate of evaporation.
Chain length had a significant but minimal effect on Revap, but the change was opposite to a study that calculated the resistance to evaporation increased with hydrocarbon chain length.8 The attenuation of Revap by lipids was minimal in our study, and fluid long-chain alcohols such as 1-undecanol and very ordered long chain alcohols such as 1-tetradecane did not reduce Revap by more than a few percent. We found that the amount of lipid on the surface (estimated to be 0.7 to over 7 µm thick) did not affect Revap in agreement with in vivo studies (Section IV.B.1.).22,56–60 Our results indicate that when a water molecule achieves sufficient energy to escape the surface, it escapes whether the interface is a layer of lipid or air. The water molecules find their way into the lipid layer and eventually make their way to escape as a gas into the air. So although the lipid layer could slow the movement of water through the lipid,8 Revap is unaffected by lipid.
Unexpectedly, the conformation of fluid 1-undecaol became more ordered when layered on the surface of buffer. We noticed a similar ordering when human meibum was placed on the surface of human reflex tears (discussed below).
B. Meibum and Revap
Meibum must be fluid enough to exit the meibomian gland and ridged enough to withstand shear forces and delay breakup time on the tear film surface. Remarkably, that is what our data supported. Meibum, when placed on the surface of tears or buffer, forms a continuous layer of lipid and the conformation of the hydrocarbon chains change from a disordered, conformation with mostly gauche rotamers to an ordered hydrocarbon chain conformation with mostly trans rotamers. Lipid order and viscosity are related. With more trans rotamers, the lipid hydrocarbon chains are able to pack more closely together and Van der Waal’s interactions are maximal so the lipids are less free to move and are more viscous.
What causes the change in lipid order is perplexing. The aqueous layer somehow causes the meibum on the TF surface to rearrange to a less energetic, more ordered phase. The ordering is not due to the presence of protein or a component in human tears since the ordering occurs with a buffer sub-phase. Fluorescence studies confirm our results and have shown that human tears increased the anisotropy (lowered the mobility and wobble) of meibum at the water-lipid interface.61 It was technically impossible for us to map the Raman intensity of the entire film so Raman spectra were taken as a snapshot of a small area of the film. Although the snapshots were all similar, we may have missed small regions of ‘islands with imperfections’ or regions with structural defects different than that of the bulk film. It should also be noted that the magnitude of Raman bands depends on the optical quality of the film (scattering, transmission) and the structure of the film, so it is difficult to determine exactly the thickness of the film from Raman band intensities.
The visible appearance of the TFLL was smoother and more uniform when the sub-phase was human tears rather than buffer. The TFLL images we recorded looked very similar to those measured in vivo using high resolution microscopy.62 In vitro, physiological saline evaporates at a rate of 8.0 ± 0.5 µm/min,19 similar to the Revap for tears (9.3 ± 0.9 µm/min),19 and similar to Revap measured in vivo for contact lens wearers (6.97 µm/min).63 So there is nothing unusual about the Revap of tears measured in vitro or in vivo. It has been suggested that “…although evaporation seems to be an important factor in tear film break-up, it is too slow to offer a complete explanation of tear film thinning.”63
Almost every review article suggests that one of the functions of the TFLL is to attenuate Revap of tears. Such a conclusion is strong if only the studies supporting the conclusion are considered as in the Introduction. Often, some of the studies with dissenting views are ignored. In vitro, it took about 200 times more lipid (wax, squalene and cholesteryl ester found in meibum) than is on the surface of the eye to show a significant decrease (9–20%) in Revap.21,51 Yet, experiments done 60 years ago showed that three wax esters, ethyl palmitate, ethyl linoleate and ethyl elaidate do not attenuate evaporation (ethyl stearate does).16 Wax esters are the major lipid of the TFLL. More recently, a pool of lipids resembling the TFLL did not inhibit Revap and a layer of olive oil 2,000 times the thickness of the TFLL only decreased Revap by 53%. 64
Some in vitro and in vivo studies do not corroborate the idea that the TFLL inhibits the Revap. In vitro when bovine39 or human meibum37,38 was layered on top of saline, it did not inhibit Revap or inhibited it much less (6–8%)4 than conventionally attributed to the TFLL. One may speculate that the reason for lack of evaporative resistance by lipids in some studies is that the films did not spread across the entire surface leaving exposed regions for water to evaporate. There is no experimental evidence to support this idea. In the current study, Raman scattering intensity of the lipid film deviated by only about 7% for hydroxyl lipids and varied by 21% for meibum films across the entire film suggesting that lipids in the center of the sample were distributed similarly to those in the periphery. Our microscopic observation confirms this. Furthermore, all of the lipids were structurally ordered so lipid-lipid interactions were maximal. For this to occur, lipids have to pack linearly and tightly together.
In another study, steps were taken to ensure that the meibum films spread uniformly and completely over the aqueous phase as evident from color interference patterns, yet the meibum film only inhibited the rate of evaporation by 7%.4 X-ray diffraction studies of meibum films showed that above a surface pressure greater than 18 mNm−1 , which is the case for the evaporation experiments, stacked monolayers 3–8 layers thick form with no single monolayers present.65 Brewster angle microscopy,66 fluorescence spectroscopy and high resolution color microscopy67 also showed that at physiological temperature and higher surface pressures, meibum spontaneously spreads covering the entire surface with the presence of ‘islands’ of lipid similar to those observed in vivo.62 Thus, the meibum in the evaporation studies form multilamellar duplex film containing a 5 nm thick monolayer probably composed of surfactants and a superficial multilamellar collecting layer containing islands of lipids.67 The multilamellar sheets are likely to be joined by interdigitated lipid hydrocarbon chains. One would expect that large ‘islands’ of tightly packed lipids, 70 times thicker than the TFLL, might decrease the rate of evaporation as it has been estimated that “…in some areas where the meibum is thicker, it acts as a better barrier to evaporation,”39 although the total rate of evaporation was unchanged with meibum.
Concurrent with other studies,4,6,16,21,37,38,51,63 we found that lipids did not inhibit the rate of evaporation. In the current study, experiments were repeated over 60 times by eight different investigators. Perhaps as water evaporates, it travels around the islands of lipids and through the thin monolayer between islands. The difficulty for lipids to inhibit Revap is evident from a bilayer study that stated “…even if 99.8% of the surface is occupied by bilayer, the presence of only 0.2% of the surface as monolayer is sufficient to reduce the specific resistance of a bilayer surface film…”68
One possibility for why meibum did not inhibit Revap is that in previous studies,4,37,38 buffer instead of human tears was used as a sub-phase. The rheology of meibum on artificial tears is different for meibum on buffer.39 The interaction of meibum with tears results in the exclusion of water at the TFLL-aqueous tear interface and it was suggested this interaction could inhibit Revap.61 In this study we tested the idea that components in human tears such as proteins interact with human meibum placed on the surface of human reflex tears and together they inhibit Revap. Whether buffer or tears were used as a sub phase, Revap was not inhibited by meibum.
1. Meibum Thickness and Evaporation
The six most recent studies published in the last 10 years related to TFLL thickness in vivo show that TFLL thickness is not related to increased TFBUTor a decreased thinning rate attributed mostly to evaporation.22,56–60 In fact, patients with seasonal allergic conjunctivitis had a TFLL that was actually thicker than controls, yet the stability of their tear film and breakup time decreased, opposite of what one would expect.56 For 29 young57 and 86 older59 normal subjects, and 110 patients with dry eye,58 there was no correlation between TFLL thickness and non-invasive tear break-up time. Thinning rate and Revap are related. The correlation between thinning rate and lipid thickness, although significant, was nevertheless rather low (r about 0.3).22 Most people have a tear film thickness between 30 to 150 nm and it has been shown that in this range of TFLL thickness, Revap does not change.22,29 One needs the absence of a TFLL (which rarely occurs) to observe an increase in Revap.29
2. Local Lipid Structural Changes and Evaporation
Some studies suggest that local changes in evaporation could influence tear breakup, and tear breakup occurred where the TFLL was either relatively thin or relatively thick, suggesting that “the lipid was a poor barrier to evaporation, perhaps because of deficiency in composition and/or structure.”62 Indeed, as pointed out in the Introduction, thermographic images are remarkably similar to fluorescein breakup images, implying that localized breakup is caused by localized high evaporation.30–36 The most likely cause of local high evaporation is that the lipid layer has a poor evaporation resistance in that region compared to higher resistance in surrounding regions. However, as pointed out, many subjects exhibited ocular surface cooling without fluorescein tear thinning and breakup and some showed no evidence of ocular surface cooling or fluorescein tear thinning and breakup.30 Some or all of the local cooling in the TFLL breakup areas could result from the breaking of strong hydrophobic Van der Waal’s lipid-lipid interactions and not evaporation. Thermographic in vivo studies are associated with large standard deviations, 0.5–0.8°C, relative to the difference in temperature 0.04 to 0.44°C, between subjects with dry eye and those without.33,69 Also, one should not overlook the studies that showed no correlation between TFBUT and ocular surface temperature in normal subjects57 and surface temperature differences in subjects with dry eye.70 Furthermore, one should consider that subjects with dry eye had the same33 surface temperatures compared with normal subjects.
Based on the studies discussed above, it would be prudent to at least consider that the widespread idea that the TFLL inhibits Revap of tears could be incorrect. Given the difficulty in forming an effective evaporation barrier in vitro, it seems improbable, but still possible, that meibum forms an effective barrier in vivo in the 10 s between blinks and tear breakup. Meibum lipids could serve functions other than to prevent the evaporation of tears,71 such as to: dam the tear film, lubricate, stabilize, allow for proper refraction, degrade mucinic clots, be antibacterial, supress UV rays, 24 and to form viscoelastic films capable of opposing dilation of the air-tear interface. 69,71
V. CONCLUSION
We found that long chain alcohols, regardless of their fluidity, chain length, or thickness and human meibum do not inhibit Revap of buffer or tears in vitro even though they form a relatively tightly packed layer on the surface.
Acknowledgments
This work was supported by the National Institute of Health grant R01 EYO 26180 (DB), the Kentucky Lions Eye Foundation and an unrestricted grant from Research to Prevent Blindness Inc. Dylan Gerlach’s and Emily K. Dennis’s fellowships were funded by the National Institute of Health, Kentucky Biomedical Research Infrastructure Network grants. Alexander Oliver’s and Samiyyah Sledge’s research fellowships were funded by the National Institute of Health Summer Cardiovascular Physiology Research Program Minority Grant to the University of Louisville. Heidi Michael’s fellowship was funded by the Institute of Molecular Diversity and Drug Design (IMD3), University of Louisville, KY. The Raman instrument at the University of Louisville’s Conn Center, was made available through a grant from the National Science Foundations Experimental Program to Stimulate Competitive Research (EPSCoR).
Footnotes
None of the authors had a conflict of interest.
The authors have no commercial or proprietary interest in any concept or product discussed in this article.
REFERENCES
- 1.Penman HL. Natural evaporation from open water, bare soil and grass. Proc R Soc Lond A Math Phys Sci. 1948;A193:120–146. doi: 10.1098/rspa.1948.0037. [DOI] [PubMed] [Google Scholar]
- 2.Howell TA, Dunsek DA. Comparison of vapour-presure deficit calculation methods- Southern High Plains. J Irrig Drain Eng ASCE. 1995;121:191–198. [Google Scholar]
- 3.Lakshmann G. An aerodynamic formula to compute evaporation from open water surfaces. J Hydrology. 1972;15:209–225. [Google Scholar]
- 4.Cerretani CF, Ho NH, Radke CJ. Water-evaporation reduction by duplex films: application to the human tear film. Adv Colloid Interface Sci. 2013;197–198:33–57. doi: 10.1016/j.cis.2013.03.007. [DOI] [PubMed] [Google Scholar]
- 5.Peng CC, Cerretani C, Braun RJ, Radke CJ. Evaporation-driven instability of the precorneal tear film. Adv Colloid Interface Sci. 2014;206:250–264. doi: 10.1016/j.cis.2013.06.001. [DOI] [PubMed] [Google Scholar]
- 6.Craig I, Green A, Scobie GM, Schmidt E. Controlling evaporation loss from water storages. National Centre for Engineering in Agriculture. 2005:1000580/1:1–1000580/1:121. [Google Scholar]
- 7.Rideal EK. The influence of thin surface films on the evaporation of water. J Phys Chem. 1924;29:1585–1588. [Google Scholar]
- 8.Archer RJ, La Mer VK. The rate of evaporation of water through fatty acid monolayers. J Phys Chem. 1954;59:200–208. [Google Scholar]
- 9.Barnes GT. The effects of monolayers on the evaporation of liquids. J Colloid Interface Sci. 1986;25:89–200. [Google Scholar]
- 10.Rusdi M, Moroi Y. Study on water evaporation through 1-alkanol monolayers by thermogravitry method. J Colloid Interface Sci. 2004;272:472–479. doi: 10.1016/j.jcis.2004.01.014. [DOI] [PubMed] [Google Scholar]
- 11.Barnes GT, Quickenden TL, Saylor JE. A statistical calculation of monolayer permeation by water. J Colloid Interface Sci. 1970;33:236–243. [Google Scholar]
- 12.Barnes GT. Optimum conditions for evaporation control by monolayers. J Hydrology. 1993;145:165–173. [Google Scholar]
- 13.Lunkenheimer K, Zembala M. Attempts to study water evaporation retardation by soluble surfactants. J Colloid Interface Sci. 1997;188:363–371. [Google Scholar]
- 14.McNamee CE, Barnes GT, Gentle IR, Peng JB, Steitz R, Probert R. The evaporation resistance of mixed monolayers of octadecanol and cholesterol. J Colloid Interface Sci. 1998;207:258–263. doi: 10.1006/jcis.1998.5756. [DOI] [PubMed] [Google Scholar]
- 15.Machida S, Mineta S, Fujimori A, Nakahara H. Retardation of water evaporation by less-defective mixed monolayers spead from bulk solids onto water surface. J Colloid Interface Sci. 2003;260:135–141. doi: 10.1016/s0021-9797(02)00222-9. [DOI] [PubMed] [Google Scholar]
- 16.Rosano HL, La Mer VK. The rate of evaporation of water through monolayers of esters, acids and alcohols. J Phys Chem. 1955;60:348–353. [Google Scholar]
- 17.Grundy F. The use of cetyl alchohol to reduce reservoir evaporation. Inst Water Engineers J. 1957;2:429–437. [Google Scholar]
- 18.Research in dry eye: report of the Research Subcommittee of the International Dry Eye WorkShop (2007) Ocul Surf. 2007;5:179–193. doi: 10.1016/s1542-0124(12)70086-1. (No authors listed) [DOI] [PubMed] [Google Scholar]
- 19.Nichols K, Schaumberg D, Schein O. The epidemiology of dry eye disease: report of the epidemiology subcommittee of the international dry eye workshop. Ocular Surface. 2007;5:93–107. doi: 10.1016/s1542-0124(12)70082-4. [DOI] [PubMed] [Google Scholar]
- 20.Lemp MA, Crews LA, Bron AJ, et al. Distribution of aqueous-deficient and evaporative dry eye in a clinic-based patient cohort: a retrospective study. Cornea. 2012;31:472–478. doi: 10.1097/ICO.0b013e318225415a. [DOI] [PubMed] [Google Scholar]
- 21.Borchman D, Foulks GN, Yappert MC, et al. Factors affecting evaporation rates of tear film components measured in vitro. Eye Contact Lens. 2009;35:32–37. doi: 10.1097/ICL.0b013e318193f4fc. [DOI] [PubMed] [Google Scholar]
- 22.King-Smith PE, Hinel EA, Nichols JJ. Application of a novel interferometric method to investigate the relation between lipid layer thickness and tear film thinning. Invest Ophthalmol Vis Sci. 2010;51:2418–2423. doi: 10.1167/iovs.09-4387. [DOI] [PMC free article] [PubMed] [Google Scholar]
- 23.King-Smith PE, Fink BA, Fogt N, et al. The thickness of the human precorneal tear film: evidence from reflection spectra. Invest Ophthalmol Vis Sci. 2000;41:3348–3359. [PubMed] [Google Scholar]
- 24.Murube J. The origin of tears. III. The lipid component in the XIX and XX centuries. Ocul Surf. 2012;10:200–209. doi: 10.1016/j.jtos.2012.08.001. [DOI] [PubMed] [Google Scholar]
- 25.Mishima S, Maurice DM. The oily layer of the tear film and evaporation from the corneal surface. Exp Eye Res. 1961;1:39–45. doi: 10.1016/s0014-4835(61)80006-7. [DOI] [PubMed] [Google Scholar]
- 26.Iwata S, Lemp MA, Holly FJ, Dohlman CH. Evaporation rate of water from the precorneal tear film and cornea in the rabbit. Invest Ophthalmol Vis Sci. 1969;8:613–619. [PubMed] [Google Scholar]
- 27.Rantamäki AH, Wiedmer SK, Holopainen JM. Melting points—the key to the anti-evaporative effect of the tear film wax esters. Invest Ophthalmol Vis Sci. 2013;54:5211–5217. doi: 10.1167/iovs.13-12408. [DOI] [PubMed] [Google Scholar]
- 28.Paananen RO, Rantamäki AH, Holopainen JM. Antievaporative mechanism of wax esters: implications for the function of tear fluid. Langmuir. 2014;30:5897–5902. doi: 10.1021/la501678t. [DOI] [PubMed] [Google Scholar]
- 29.Craig JP, Tomlinson A. Importance of the lipid layer in human tear film stability and evaporation. Optom Vis Sci. 1997;74:8–13. doi: 10.1097/00006324-199701000-00014. [DOI] [PubMed] [Google Scholar]
- 30.Li W, Graham AD, Selvin S, Lin MC. Ocular surface cooling corresponds to tear film thinning and breakup. Optom Vis Sci. 2015;92:e248–e256. doi: 10.1097/OPX.0000000000000672. [DOI] [PubMed] [Google Scholar]
- 31.Su T, Chang S, Yang C, Chiang HK. Direct observation and validation of fluorescein tear film break-up patterns by using a dual thermal-fluorescent imaging system. Biomed Opt Express. 2014;5:2614–2619. doi: 10.1364/BOE.5.002614. [DOI] [PMC free article] [PubMed] [Google Scholar]
- 32.Purslow C, Wolffsohn J. The relation between physical properties of the anterior eye and ocular surface temperature. Optom Vis Sci. 2007;84:197–201. doi: 10.1097/OPX.0b013e3180339f6e. [DOI] [PubMed] [Google Scholar]
- 33.Kamao T, Yamaguchi M, Kawasaki S, et al. Screening for dry eye with newly developed ocular surface thermographer. Am J Ophthalmol. 2011;151:782–791. doi: 10.1016/j.ajo.2010.10.033. [DOI] [PubMed] [Google Scholar]
- 34.Tomlinson A, Trees GR, Occhipiniti JR. Tear production and evaporation in the normal eye. Ophthalmic Physiol Opt. 1991;11:44–47. [PubMed] [Google Scholar]
- 35.Craig JP, Singh I, Tomlinson A, Morgan PB. The role of tear physiology in ocular surface temperature. Eye (Lond) 2000;14:635–641. doi: 10.1038/eye.2000.156. [DOI] [PubMed] [Google Scholar]
- 36.Braun RJ, King-Smith PE, Begley CG, et al. Dynamics and function of the tear film in relation to the blink cycle. Prog Retin Eye Res. 2015;45:132–164. doi: 10.1016/j.preteyeres.2014.11.001. [DOI] [PMC free article] [PubMed] [Google Scholar]
- 37.Herok GH, Mudgil P, Millar TJ. The effect of meibomian lipids and tear proteins on evaporation rate under controlled in vitro conditions. Curr Eye Res. 2009;34:589–597. doi: 10.1080/02713680902972366. [DOI] [PubMed] [Google Scholar]
- 38.Brown SI, Dervichian DG. The oils of the meibomian glands: physical and surface characteristics. Arch Ophthalmol. 1969;82:537–540. doi: 10.1001/archopht.1969.00990020539019. [DOI] [PubMed] [Google Scholar]
- 39.Bhamla MS, Chai C, Rabiah NI, et al. Instability and breakup of model tear films. Invest Ophthalmol Vis Sci. 2016;57:949–958. doi: 10.1167/iovs.15-18064. [DOI] [PubMed] [Google Scholar]
- 40.Oshima Y, Sato H, Zaghloul A, et al. Characterization of human meibum lipid using Raman spectroscopy. Curr Eye Res. 2009;34:824–835. doi: 10.3109/02713680903122029. [DOI] [PubMed] [Google Scholar]
- 41.Lin CY, Suhalim JL, Nien CL, et al. Picosecond spectral coherent anti-Stokes Raman scattering imaging with principal component analysis of meibomian glands. J Biomed Opt. 2011;16:021104. doi: 10.1117/1.3533716. [DOI] [PMC free article] [PubMed] [Google Scholar]
- 42.Suhalim JL, Parfitt GJ, Xie Y, et al. Effect of desiccating stress on mouse meibomian gland function. Ocul Surf. 2014;12:59–68. doi: 10.1016/j.jtos.2013.08.002. [DOI] [PMC free article] [PubMed] [Google Scholar]
- 43.Kuo MT, Lin CC, Liu HY, et al. Differentiation between infectious and non-infectious ulcerative keratitis by Raman spectra of human teardrops: A pilot study. Invest Ophthalmol Vis Sci. 2012;53:1436–1444. doi: 10.1167/iovs.11-7923. [DOI] [PubMed] [Google Scholar]
- 44.Elshout M, Erckens RJ, Webers CA, et al. Detection of Raman spectra in ocular drugs for potential in vivo application of Raman spectroscopy. J Ocul Pharmacol Ther. 2011;27:445–451. doi: 10.1089/jop.2011.0018. [DOI] [PubMed] [Google Scholar]
- 45.Kuo MT, Lin CC, Liu HY, Chang HC. Tear analytical model based on Raman microspectroscopy for investigation of infectious diseases of the ocular surface. Invest Ophthalmol Vis Sci. 2011;52:4942–4950. doi: 10.1167/iovs.10-7062. [DOI] [PubMed] [Google Scholar]
- 46.Reyes-Goddard JM, Barr H, Stone N. Surface enhanced Raman scattering of herpes simplex virus in tear film. Photodiagnosis Photodyn Ther. 2008;5:42–49. doi: 10.1016/j.pdpdt.2008.01.002. [DOI] [PubMed] [Google Scholar]
- 47.Filik J, Stone N. Analysis of human tear fluid by Raman spectroscopy. Anal Chim Acta. 2008;616:177–184. doi: 10.1016/j.aca.2008.04.036. [DOI] [PubMed] [Google Scholar]
- 48.Imai S, Tsuge N, Tomotake M, et al. Plant biochemistry: An onion enzyme that makes the eyes water. Nature. 2002;419:685. doi: 10.1038/419685a. [DOI] [PubMed] [Google Scholar]
- 49.Frey WH, DeSota-Johnson D, Hoffman C, et al. Effect of stimulus on the chemical composition of human tears. Am J Ophthalmol. 1981;92:559–567. doi: 10.1016/0002-9394(81)90651-6. [DOI] [PubMed] [Google Scholar]
- 50.Tiffany JM, Marsden RG. The influence of composition on physical properties of meibomian secretion. In: Holly FJ, editor. The Preocular Tear Film in Health, Disease and Contact Lens Wear. Lubbock, TX: Dry Eye Institute; 1986. pp. 597–608. [Google Scholar]
- 51.Borchman D, Yappert MC, Milliner S, et al. 13C and 1H NMR ester region resonance assignments and the composition of human infant and child meibum. Exp Eye Res. 2013;112:151–159. doi: 10.1016/j.exer.2013.04.017. [DOI] [PubMed] [Google Scholar]
- 52.Lippert JL, Peticolas WL. Raman active vibrations in long chain fatty acids and phospholipid sonicates. Biochim Biophys Acta. 1972;282:8–17. doi: 10.1016/0005-2736(72)90306-9. [DOI] [PubMed] [Google Scholar]
- 53.Gaber BP, Peticolas WL. On the quantitative interpretation of biomembrane structure by Raman spectroscopy. Biochim Biophys Acta. 1977;465:260–274. doi: 10.1016/0005-2736(77)90078-5. [DOI] [PubMed] [Google Scholar]
- 54.Walrafen GE, Pugh E. Raman combinations and stretching overtones from water, heavy water and NaCl in water at shifts to ca 7000 cm−1. J Solution Chem. 2004;33:81–97. [Google Scholar]
- 55.Elias PM, Menon G. Structural and lipid biochemical correlates of the epidermal permeability barrier. Adv Lipid Res. 1991;24:1–26. doi: 10.1016/b978-0-12-024924-4.50005-5. [DOI] [PubMed] [Google Scholar]
- 56.Suzuki S, Goto E, Dogru M, et al. Tear film lipid layer alterations in allergic conjunctivitis. Cornea. 2006;25:277–280. doi: 10.1097/01.ico.0000178277.29010.bc. [DOI] [PubMed] [Google Scholar]
- 57.Giraldez MJ, Naroo SA, Resua CG. A preliminary investigation into the relationship between ocular surface temperature and lipid layer thickness. Cont Lens Anterior Eye. 2009;32:177–180. doi: 10.1016/j.clae.2009.06.004. [DOI] [PubMed] [Google Scholar]
- 58.Finis D, Pischel N, Schrader S, Geerling G. Evaluation of lipid layer thickness measurement of the tear film as a diagnostic tool for Meibomian gland dysfunction. Cornea. 2013;32:1549–1553. doi: 10.1097/ICO.0b013e3182a7f3e1. [DOI] [PubMed] [Google Scholar]
- 59.Fenner BJ, Tong L. More to stable tears than thickness of the tear film lipid layer. Invest Ophthalmol Vis Sci. 2015;56:1601. doi: 10.1167/iovs.15-16490. [DOI] [PubMed] [Google Scholar]
- 60.King-Smith PE, Reuter KS, Braun RJ, et al. Tear film breakup and structure studied by simultaneous video recording of fluorescence and tear film lipid layer images. Invest Ophthalmol Vis Sci. 2013;54:4900–4909. doi: 10.1167/iovs.13-11878. [DOI] [PMC free article] [PubMed] [Google Scholar]
- 61.Borchman D, Foulks GN, Yappert MC, et al. Spectroscopic evaluation of human tear lipids. Chem Phys Lipids. 2007;147:87–102. doi: 10.1016/j.chemphyslip.2007.04.001. [DOI] [PubMed] [Google Scholar]
- 62.King-Smith PE, Nichols JJ, Braun RJ, Nichols KK. High resolution microscopy of the lipid layer of the tear film. Ocul Surf. 2011;9:197–211. doi: 10.1016/s1542-0124(11)70033-7. [DOI] [PMC free article] [PubMed] [Google Scholar]
- 63.Nichols JJ, Mitchell GL, King-Smith PE. Thinning rate of the precorneal and prelens tear films. Invest Ophthalmol Vis Sci. 2005;46:2353–2361. doi: 10.1167/iovs.05-0094. [DOI] [PubMed] [Google Scholar]
- 64.Rantamäki AH, Javanainen M, Vattulainen I, Holopainen JM. Do lipids retard the evaporation of the tear fluid? Invest Ophthalmol Vis Sci. 2012;53:6442–6447. doi: 10.1167/iovs.12-10487. [DOI] [PubMed] [Google Scholar]
- 65.Leiske DL, Miller CE, Rosenfeld L, et al. Molecular structure of interfacial human meibum films. Langmuir. 2012;28:11858–11865. doi: 10.1021/la301321r. [DOI] [PubMed] [Google Scholar]
- 66.Georgiev GA, Yokoi N, Ivanova S, et al. Surface relaxations as a tool to distinguish the dynamic interfacial properties of films formed by normal and diseased meibomian lipids. Soft Matter. 2014;10:5579–5588. doi: 10.1039/c4sm00758a. [DOI] [PubMed] [Google Scholar]
- 67.Millar TJ, King-Smith PE. Analysis of comparison of human meibomian lipid films and mixtures with cholesteryl esters in vitro films using high resolution color microscopy. Invest Ophthalmol Vis Sci. 2012;53:4710–4719. doi: 10.1167/iovs.12-10022. [DOI] [PMC free article] [PubMed] [Google Scholar]
- 68.Ginsberg L, Gershfeld L. Phospholipid surface bilayers at the air—water interface. II. Water permeability of dimyristoylphosphatidylcholine surface bilayers. Biophys J. 1985;47:211–215. doi: 10.1016/s0006-3495(85)83893-5. [DOI] [PMC free article] [PubMed] [Google Scholar]
- 69.Morgan PB, Tullo AB, Efron N. Infrared thermography of the tear film in dry eye. Eye (Lond) 1995;9:615–618. doi: 10.1038/eye.1995.149. [DOI] [PubMed] [Google Scholar]
- 70.Su TY, Ho WT, Lu CY, et al. Correlations among ocular surface temperature difference value, the tear meniscus height, Schirmer’s test and fluorescein tear film break up time. Br J Ophthalmol. 2015;99:482–487. doi: 10.1136/bjophthalmol-2014-305183. [DOI] [PubMed] [Google Scholar]
- 71.Millar TJ, Schuett BS. The real reason for having a meibomian lipid layer covering the outer surface of the tear film - A review. Exp Eye Res. 2015;137:125–138. doi: 10.1016/j.exer.2015.05.002. [DOI] [PubMed] [Google Scholar]


