Abstract
Plants, being sessile, have developed intricate signaling network to specifically respond to the diverse environmental stress. The plant-specific WRKY TFs form one of the largest TF family and are involved in diverse plant processes, involving growth, development and stress signaling through auto and cross regulation with different genes and TFs. Here, we report the functional characterization of a salicylic acid -inducible JcWRKY TF. The JcWRKY overexpression confers salinity tolerance in transgenic tobacco, as was evident by increased chlorophyll content and seed germination potential. The transgenic plants showed increased soluble sugar, membrane stability, reduced electrolyte leakage and generation of reactive oxygen species (H2O2 and ) as compared to the wild type. Furthermore, the low SA treatment along with salinity improved the tolerance potential of the transgenics by maintaining ROS homeostasis and high K+/Na+ ratio. The transcript expression of SA biosynthetic gene ICS1 and antioxidative enzymes (CAT and SOD) showed upregulation during stress. Thus, the present study reflects that JcWRKY is working in co-ordination with SA signaling to orchestrate the different biochemical and molecular pathways to maneuvre salt stress tolerance of the transgenic plants.
Keywords: Jatropha, JcWRKY, phytohormones, ROS homeostasis, salicylic acid, salinity, transcription factor(s), transgenic
Introduction
Plants with their sessile and autotrophic lifestyle are exposed to multiple stresses simultaneously such as drought, light, temperature, insects, and microbes. These factors are the major constraints/challenge to agriculture productivity. The potential of the sessile plants to survive, adapt and reproduce/multiply, while being exposed to the various environmental challenges is a fascinating process involving a complex array of physiological and biochemical mechanisms. The complex network of stress-responsive signal transduction pathways, converge and diverge in co-ordination toward alleviating and providing abiotic and biotic stress tolerance (Fujita et al., 2006). Transcription factors (TFs) are important for providing specificity toward stress responses (Vaahtera and Brosche, 2011) and conferring multiple stress tolerance via inducing and/or repressing the expressions of an array of downstream genes (Agarwal and Jha, 2010; Pardo, 2010; Shukla et al., 2015). The stress-related TFs such as NAC, MYB, DREB, and WRKYs have been isolated from different plant species and overexpressed in homologous and heterologous systems to genetically engineer stress tolerance (Agarwal et al., 2013). The genome-wide analysis of Arabidopsis genome show the presence of 1,510–1,581 (20%) TF genes, of them 45% are plant specific (Iida et al., 2005). Accordingly, the rice genome contain 1,611 TFs (Xiong et al., 2005). Interestingly, the genome of single-celled yeast Saccharomyces cerevisiae contains only 12% of TFs (Mewes et al., 1997), indicating the expansion of TFs in plants probably due to significant variability and complexity of plant metabolism, as compared with other organisms (Shiu et al., 2005).
The WRKY family of TFs play an intricate role in regulating the stress signaling pathways by autoregulation or may be by cross regulation through interaction with other proteins like MAP kinases, MAP kinase kinases, Calmodulin, histone deacetylases, etc. for carrying out diverse plant functions (Rushton et al., 2010). WRKY proteins have been implicated in the regulation of different developmental processes such as trichome, seed development and leaf senescence (Johnson et al., 2002; Luo et al., 2005) but their major role is studied and identified during abiotic and biotic stresses (Pandey and Somssich, 2009). Although, WRKY TFs are considered to be plant specific, however, their presence have been reported from unicellular algae, slime mold, and gymnosperms. The WRKY TFs have been reported from Arabidopsis, rice (74, 102 Baranwal et al., 2016), soybean (197, Schmutz et al., 2010), papaya, poplar, sorghum, Physcomitrella patens (66, 104, 68, 38, respectively, Pandey and Somssich, 2009) and Jatropha (58, Xiong et al., 2013). The WRKY family is acquires its name from the highly conserved 60 amino acid stretched WRKY domain, consisting of the highly conserved WRKYGQK at N-terminus and a novel metal chelating zinc finger signature at C-terminus. Eulgem et al. (2000) classified the WRKY TFs into three major groups depending on the number of WRKY domains and the pattern of their zinc finger motifs. The group I WRKY’s exhibit two WRKY domains, whereas, the groups II and III WRKY’s contain only a single domain. However, groups I and II have a C2H2-type zinc finger motif (C–X4-5–C–X22-23–H–X–H) with only the C-terminal domain participating in DNA binding activity. The group III differs from I and II in its C2HC zinc finger motif (C–X7–C–X23–H–X–C). Most of the WRKY’s possess a basic nuclear localization signal. The WRKY proteins bind specifically to the W-box cis-element TTGAC(C/T) found in the promoters of a large number of plant defense-related genes (Eulgem et al., 2000), including WRKY itself.
The WRKY TFs possess, integrate and cross-talk with a number of signal transduction pathways, and are being studied and characterized for providing multiple stress tolerance. The genome wide analysis of WRKY TF from Jatropha have shown that 47 genes are regulated by abiotic stress (Xiong et al., 2013). In our earlier work (Agarwal et al., 2014) we have isolated WRKY TF from Jatropha curcas (JcWRKY) closely related to group II, an important biofuel crop growing in the wastelands of India. The JcWRKY transcript showed upregulation in response to multiple stresses, furthermore, the JcWRKY recombinant protein showed binding to W-box element of pathogenesis related-1 (PR-1), and iso1 (encoding isoamylase1) promoters. In present study, we show that overexpression of JcWRKY in tobacco leads to enhanced salinity stress tolerance, and resistance toward salinity is mediated via SA-induced ROS homeostasis in transgenic plants.
Materials and Methods
Construction of Plant Transformation Vector and Tobacco Transformation
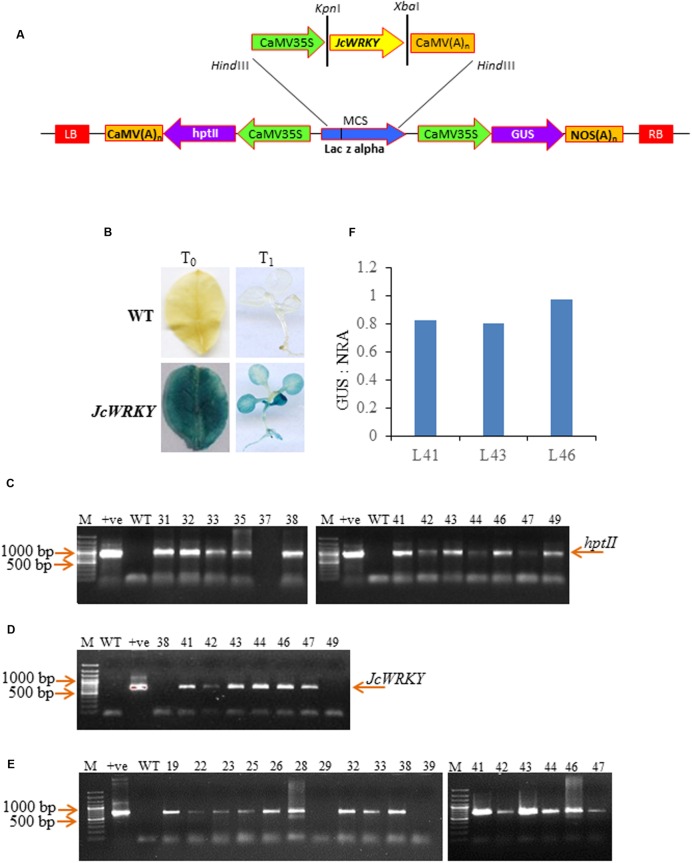
For tobacco transformation, the cDNA of JcWRKY (Agarwal et al., 2014, NCBI acc no KC191643), was PCR amplified using JcWRKYTF and JcWRKYTR primers (Supplementary Table S1) containing KpnI and XbaI restriction sites, respectively, and the digested fragment was cloned in KpnI/XbaI sites of pRT101 vector (Topfer et al., 1987). Thereafter, the entire expression cassette containing 35S: JcWRKY: Poly A was cloned in the pCAMBIA 1301 at the HindIII site and mobilized into the Agrobacterium strain LBA4404. The Agrobacterium cells, harboring binary plasmid (Figure 1A), were used to transform Nicotiana tabacum L. cv. Petit Havana leaf disks according to Horsch et al. (1985). The Murashige and Skoog (1962) medium supplemented with 5 μM BAP (6-benzylaminopurine), 1 μM IAA (indole-3-aceticacid), hygromycin (20 mg/l) and cefotaxime (300 mg/l) was used for regeneration. The multiples shoots were separated and subcultured on MS medium supplemented with 2 μM BAP for 4-weeks. The rooting was carried out on MS basal medium and subsequently hardened to be transferred in green house.
FIGURE 1.
Characterization of JcWRKY transgenic tobacco plants. (A) Schematic representation of the pCAMBIA1301 – 35S: JcWRKY construct used for Nicotiana tabacum transformation. (B) GUS assay of T0 leaf and T1 seedlings showing positive expression in the transgenic lines and negative expression in WT plants. PCR confirmation of transgenic lines (lane number denote transgenic line number) with (C) hptII (964 bp) and (D) JcWRKY (693 bp) primers. (E) Reverse transcriptase PCR of WT and JcWRKY transgenics. Amplification was observed with some transgenics, while no amplification with WT. Actin gene was used as an internal control. M refers to 100 bp plus ladder (MBI Fermentas). (F) GUS: NRA ratio for determination of copy number of transgene in tobacco plants.
Histochemical GUS Staining
The Glucuronidase gene (GUS) activity was studied in leaf tissue at T0 and T1 stage with β-glucuronidase reporter gene staining kit using manufacturer’s protocol (Sigma, USA).
Confirmation of Gene Integration and Transcript Expression in Tobacco Transgenics
Genomic DNA was isolated from different T0 lines by CTAB buffer (Doyle and Doyle, 1987) and used for confirming transgene integration by PCR with hygromycin phosphotransferase (hptII), GUS and gene-specific primers (Supplementary Table S1).
Total RNA from WT and transgenics was extracted using Tris-SDS buffer (Agarwal et al., 2015) and quantified with Epoch spectrophotometer (Biotek, India). DNase I (MBI Fermentas) treatment was used for removing genomic DNA contamination. Five microgram of total RNA was used for first strand cDNA synthesis following manufacturer’s protocol (Thermo Scientific). The reverse transcriptase PCR was carried out using 150 ng JcWRKYTF and JcWRKYTR primers or 150 ng actin primers in a 50 μl reaction with the following conditions: 94°C for 5 min, one cycle; 94°C for 1 min, 55°C for 1 min, 72°C for 1 min, 30 cycles; 72°C for 7 min, one cycle. The PCR products were analyzed via agarose gel electrophoresis. The copy number of the transgene was determined by Real-time quantitative PCR using GUS and NRA gene primers as reported earlier in Agarwal et al. (2016a).
Plant Stress Treatments
To study the germination potential of transgenics (L41, L43, and L46) the T1 seeds were subjected to different stress treatments; (a) NaCl: MS medium supplemented with NaCl (0, 100, 150, and 200 mM), (b) salicylic acid (SA): MS medium supplemented with SA (50, 100, 150, and 200 μM). The germination percentage was scored 15 days after seed inoculation.
To study the stress tolerance of JcWRKY overexpressing tobacco plants, 15-days-old WT and hygromycin positive T1 transgenic seedlings were transferred to plastic cups containing mixture of black soil: red soil: farmyard manure in 1:2:1 ratio, for 30 days. The uniform sized plants were subjected to 200 mM NaCl, 150 μM SA and combined stress of NaCl + SA (200 mM + 150 μM) for a period of 15 days. Since, tobacco is a low level SA plant, therefore low concentration of SA (0.1–0.5 mM) is considered optimal for eliciting stress response (Miura and Tada, 2014). In the present study, 150 μM SA treatment was provided. Thereafter, membrane stability index (MSI), electrolyte leakage (EL) and ion content (ICP), and biochemical parameters [total soluble sugar (TSS), super oxide (), hydrogen peroxide (H2O2) quantification, superoxide dismutase (SOD) and catalase (CAT)] were recorded.
Extraction and Quantification of Salicylic Acid from Tobacco Leaves
The plant growth regulators (PGRs) were isolated according to Pan et al. (2010) from tobacco leaf tissue exposed to different treatments and from their corresponding control seedlings. The plant tissue was ground with liquid nitrogen and 50 mg of powdered tissue was transferred into 2 ml Eppendorf tube. The samples for SA determination were prepared in triplicates. DHB (2, 5- dihydroxybenzoic acid) was used as internal standards (1 μg/sample) for SA (Agarwal et al., 2016b). SA was extracted with 500 μl extraction buffer containing 2-propanol, concentrated HCl and water (2:0.002:1) at 4°C for 30 min (Pan et al., 2010). The HPLC analysis was carried out as in Agarwal et al. (2016b).
Analysis of Physiological and Biochemical Parameters of Transgenics in Response to Stress
The MSI, EL, TSS, , and H2O2 quantification, antioxidative enzymatic analysis of CAT, SOD and ion content were measured. The MSI, EL, TSS were carried out as per Shukla et al. (2012).
Quantification of and H2O2 Content
content was determined according to Shukla et al. (2012). Leaf tissue was extracted in 10 ml of 65 mM potassium phosphate buffer (pH 7.8) and centrifuged at 5,000 × g for 10 min. The reaction mixture containing 0.9 ml of 65 mM phosphate buffer (pH 7.8), 0.1 ml of 10 mM hydroxylamine hydrochloride, and 1 ml of the extract was incubated at 25°C for 20 min. Then 17 mM sulfanilamide and 7 mM α-naphthylamine were added, further, incubated at 25°C for 20 min and the absorbance was read at 530 nm. A standard curve (10–200 nmol) was prepared with NaNO2 to calculate the production rate of .
The H2O2 content in leaf samples was measured as described by Shukla et al. (2012). Leaf tissue was extracted with cold acetone to determine the H2O2 levels. 2 ml of the extract was mixed with 0.5 ml of 0.1% titanium dioxide in 20% (v:v) H2SO4 and the mixture was then centrifuged at 6,000 × g for 15 min. The intensity of yellow color of the supernatant was measured at 415 nm and the concentration of H2O2 was calculated against the standard curve.
Determination of Enzyme Activities
Leaf tissue of 1–2 gm from WT and transgenics was homogenized in 15 ml of 50 mM phosphate buffer, pH 7.0, containing 1% polyvinylpyrrolidone. The homogenate was centrifuged at 15, 000 × g for 10 min and the supernatant obtained was used as enzyme extract.
Superoxide Dismutase (EC1.15.1.1)
Superoxide dismutase activity was measured as reported in Dhindsa et al. (1981) with minor modification, based on the potential to inhibit the photoreduction of nitro blue tetrazolium (NBT). The 3 ml reaction mixture contained 100 mM phosphate buffer, pH 7.5, 200 mM methionine, 2.25 mM NBT, 60 μM riboflavin, 3.0 mM EDTA, and 50 μl enzyme extract. The reaction was carried out at room temperature for 15 min under bright light (2 × 15 W fluorescent lamps), and absorbance was recorded at 560 nm. The log A560 was plotted as a function of the volume of enzyme extract (Giannopolitis and Ries, 1977), and the volume of enzyme extract corresponding to 50% inhibition of the reaction was considered as one enzyme unit (Beauchamp and Fridovich, 1971).
Catalase (EC1.11.1.6)
Catalase assay was carried out by measuring the initial rate of disappearance of H2O2 as reported by Dhindsa et al. (1981). The 3 ml reaction mixture contained 100 mM phosphate buffer, pH 7.5, 75 mM H2O2, and 50 μl enzyme extract. The decrease in H2O2 was observed as a decline in A240 using Epoch spectrophotometer (Biotek, India) and activity was expressed in units (1 unit defines the conversion of one mole of H2O2/minute).
Analysis of Ion Content
The ion content was studied using inductively coupled plasma optical emission spectrometer (Optima 2000DV, Perkin Elmer, Germany) as in Shukla et al. (2012).
Real-Time PCR Analysis of Downstream Genes
The quantitative expression of downstream genes (Table 1) was studied by real-time PCR. The cDNA was synthesized from the stress-treated and control WT and T1 transgenic plants as previously mentioned. The cDNA was used as a template for qPCR analysis. Actin (NtActin F and NtActin R primers) was used as an internal control gene. Real-time PCR was performed with SYBR green jumpstart Taq ready mix (Sigma-Aldrich) with following PCR condition: 94°C, 2 min for one cycle; 94°C, 60 s, 55°C, 60 s and 72°C, 60 s for 45 cycles. The specificity of PCR amplification was checked by melt curve analysis at the end of the PCR cycles. Each reaction was replicated three times and the relative-fold expression was determined using Livak method (Livak and Schmittgen, 2001).
Table 1.
List of selected genes studied by real time PCR for transcript regulation in tobacco transgenics.
| S. no. | Target gene name/accession number | Primer sequence (5′→3′) | Functions |
|---|---|---|---|
| 1 | NtSOD/ AF443178 | F:TGCAGCTCCACCACCAGAAGCATCATCAGAC R:GGCTCACCACCACCCTCGCGGACA |
Antioxidative enzyme |
| 2 | NtCAT/HF564632 | F:AGGTACCGCTCATTCACACC R:AAGCAAGCTTTTGACCCAGA |
Antioxidative enzyme |
| 3 | NtICS/EU257505 | F:CAGTTCTGTTTGCAACCTCC R:GAGTAGGGTGAATGGACGAC |
SA biosynthetic gene |
Statistical Analyses
Each experiment was repeated thrice and the mean values and standard deviations were calculated. Analysis of variance was calculated using Fishers least significant difference (LSD) by Infostat software at P ≤ 0.05 to determine the significance of difference between the means of control and different stress treatments. Mean values of treatments that were significantly different from each other were indicated by different alphabets. Correlation coefficient between physio-biochemical parameters was determined using PAST (Palaeontological STatistics, ver. 1.89) as reported by Sarkar et al. (2016).
Results
Overexpression of JcWRKY Confer Enhanced Stress Tolerance
Analysis of T0 Transgenic Lines
To study the role of JcWRKY toward stress tolerance, transgenic tobacco overexpressing JcWRKY were generated. Among 58 hygromycin resistant plants, 35 showed histochemical GUS staining (Figure 1B). Some plants showed proper blue color in leaves while others showed scattered blue spots. The GUS positive plants showed the presence of JcWRKY and hygromycin genes (Figures 1C,D). Transgenic lines showed expression of the JcWRKY gene by reverse transcriptase PCR, but the corresponding band was not observed in WT plants (Figure 1E). The presence of a single transcript indicated that transcription initiation and termination of JcWRKY mRNA occurred as expected. The transgenic plants (T0) showed no morphological difference in the vegetative and floral tissues, as compared to WT plants. The transgenic lines (L41, L43, L46) with high transcript expression of the gene were selected for functional validation toward stress tolerance by physio-biochemical and molecular analyses.
Seeds from T0 plants were analyzed for Mendelian principle of segregation. Transgenic lines followed Mendelian segregation ratio of 3:1 Hygr/Hygs (Table 2). The real-time PCR showed the presence of single copy of the transgene in transgenics L41, L43, and L46 with GUS:NRA ratio of 0.826, 0.802, 0.975, respectively (Figure 1F). The ratio 0.5–1.0 indicate the presence of the single transgene.
Table 2.
Segregation ratio of transgenics.
| Transgenic lines | No. of seeds inoculated | No. of seeds germinated | Ratio HYGr: HYGs |
|---|---|---|---|
| L41 | 344 | 109 | 3.155 |
| L43 | 342 | 111 | 3.081 |
| L46 | 310 | 99 | 3.131 |
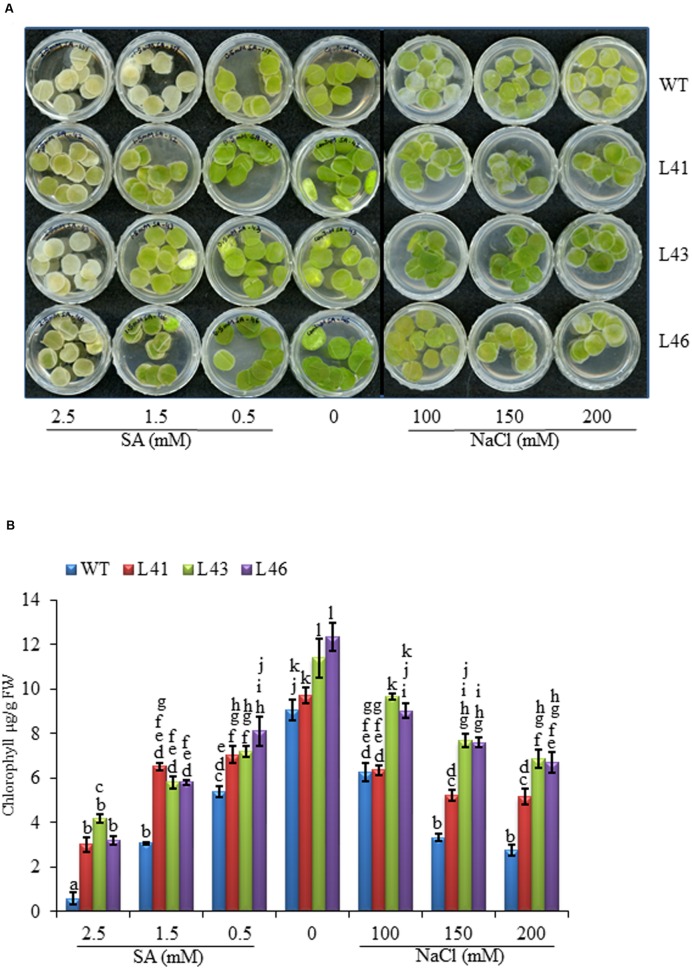
Leaf disk of uniform size from WT, L41, L43, and L46 were inoculated in the solution of NaCl (100, 200, and 300 mM), SA (0.5, 1.5, 2.5 mM) and water (control). After 7 days, WT leaf disks started turning pale in the presence of NaCl and SA, in contrast, leaf disk from transgenics remained green (Figure 2A). The chlorophyll content in transgenic leaf disks were significantly higher in all the concentrations of NaCl and SA as compared to WT. The 2.5 mM SA showed highly reduced chlorophyll content both in transgenics and WT, although the reduction was more pronounced with WT (Figure 2B).
FIGURE 2.
(A) Leaf disk assay of WT and T0 transgenic lines (L41, L43, and L46) at different concentrations of NaCl (0, 100, 150, 200 mM) and SA (0.5, 1.5, 2.5 mM). (B) Chlorophyll analysis at different SA and NaCl concentrations. Values are represented as mean ± SD (n = 3) and marked with different alphabets to indicate significant difference at P ≤ 0.05 probability.
Analysis of T1 Transgenic Lines
The T1 transgenic progeny was studied to establish the stress tolerance potential of tobacco transgenics overexpressing JcWRKY gene.
Seed germination
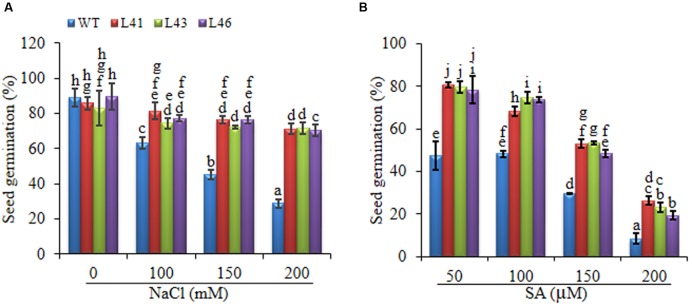
To study the effect of salt stress on germination, the WT and T1 (L41, L43, and L46) seeds were germinated on MS medium supplemented with NaCl (0, 50, 100, 200 mM). At 0 mM concentration the germination of WT and transgenic lines was similar, however, with salt stress, the transgenic seeds showed earlier and higher percent germination as compared to WT seeds. The percent of seed germination reduced with increasing concentration of NaCl in both WT and transgenics (Figure 3A), at 150 mM NaCl the WT showed 45% germination whereas, the transgenics showed 72–76% germination, further at 200 mM NaCl, germination percentage was reduced to 29% and 70–71% in WT and transgenics, respectively. On 300 mM NaCl, the transgenics showed very weak germination and the WT failed to germinate till 15-day of seed inoculation.
FIGURE 3.
Percentage seed germination at on different concentrations of (A) NaCl (0, 100, 150, 200 mM) and (B) SA (50, 100, 150, 200 μM). Values are represented as mean ± SD (n = 3) and marked with different alphabets to indicate significant difference at P ≤ 0.05 probability.
With SA treatment, the transgenics showed better germination as compared to WT. The germination in WT was 47% at 50 μM SA which decreased to 8% on 200 μM SA, whereas, the transgenics showed 78–80% and 19–26% on 50 and 200 μM SA, respectively. On 250 μM SA both WT and transgenics showed no germination (Figure 3B).
Physiological and Biochemical Response of JcWRKY Transgenics in Response to Stress
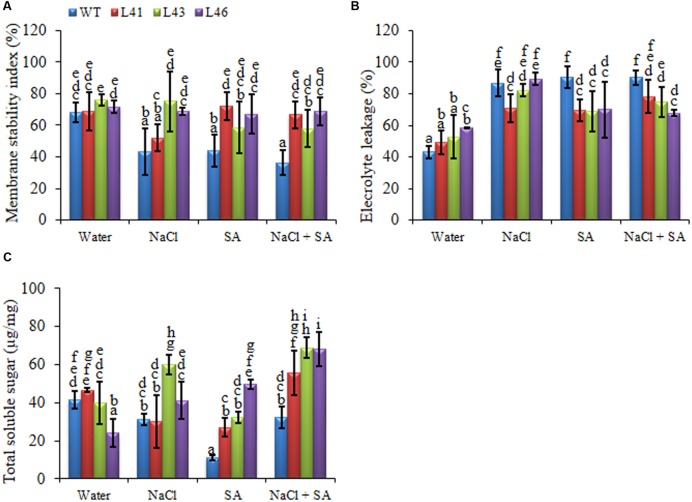
The 15-days-old WT and T1 transgenic seedlings were transferred to plastic cups containing soil for 30 days. The uniform sized plants were subjected to 0 mM, 200 mM NaCl, 150 μM SA and a combined stress of 200 mM NaCl + 150 μM SA for a period of 15 days. Transgenic lines exhibited better osmotic adjustment and physiological status as compared to WT plants. The MSI of transgenics was significantly higher than WT, indicating better membrane stability, transgenics exhibited an average of 1.5 -fold higher MSI with NaCl and SA stress, whereas the combined treatment showed to 1.7 -fold higher MSI (Figure 4A). Maximum reduction of EL was observed in L46 (24.7%) on combined stress treatment (Figure 4B). Accumulation of TSS was higher in trangenics to facilitate osmoregulation, the average accumulation of 1.4, 3.2, 2.0-fold was observed with NaCl, SA and combined stress, respectively (Figure 4C).
FIGURE 4.
Biochemical changes in WT and JcWRKY transgenic plants grown in the presence of 0, 200 mM NaCl, 150 μM SA, and combined NaCl + SA stress. (A) Membrane stability index, (B) Electrolyte leakage and (C) Total soluble sugar content. Values are represented as mean ± SD (n = 3) and marked with different alphabets to indicate significant difference at P ≤ 0.05 probability.
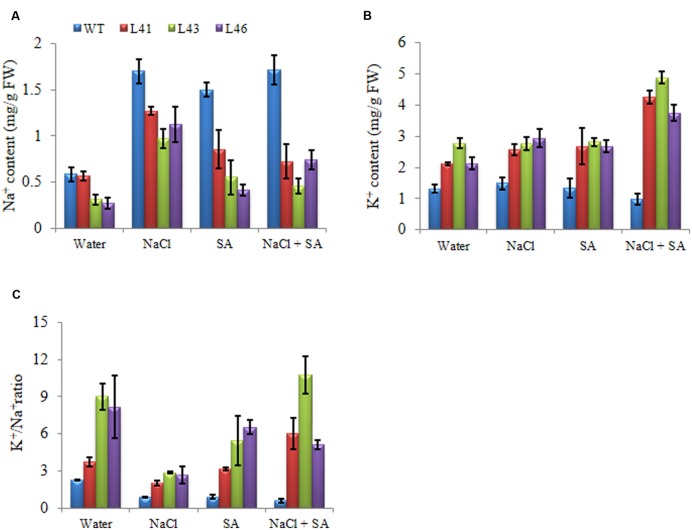
Accumulation of different ions was analyzed in WT and transgenics in response to different stresses. At 0 mM NaCl, Na+ content was less in WT as compared to transgenics. In the presence of NaCl or SA, all plants showed enhanced accumulation of Na+ ions, however the transgenics accumulated significantly lower Na+ content than WT (Figure 5A). The K+ content was higher in transgenic lines when exposed NaCl or SA and was further increased by combinatorial stress (Figure 5B) and thus helped to maintain higher K+/Na+ (Figure 5C).
FIGURE 5.
Analysis of ion content in leaves of WT and JcWRKY transgenic tobacco plants with NaCl, SA and combinatorial stress. (A) Na+ content, (B) K+ content, (C) K+/Na+. Values are represented as mean ± SD (n = 3).
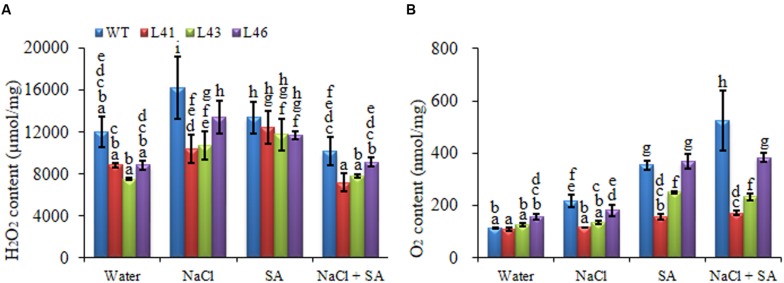
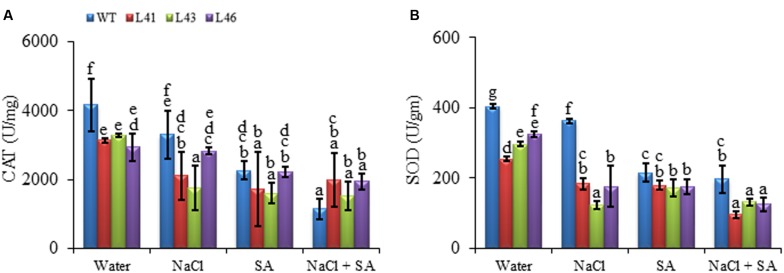
During abiotic stress conditions, ROS get accumulated in plant tissues leading to oxidative damage. The and H2O2 content of WT was significantly higher with all the treatments as compared to the transgenics. The NaCl treatment resulted in higher H2O2 content in both WT (16208 nmol/mg FW) and transgenics (L41, L43, L46; 10376, 10752, 13457 nmol/mg FW, respectively), however, the content was significantly lower in the transgenics (Figure 6A). Interestingly, the combined stress treatment resulted in highest accumulation of in WT (526.08 nmol/mg FW), however, the transgenics showed significantly reduced almost similar accumulation (ranging from 159 to 353 nmol/mg FW) with SA only and combined stress (Figure 6B). The ROS-scavenging enzymes, CAT and SOD, activity declined in both WT and transgenics on exposure to stress treatments (Figures 7A,B). The SOD content of WT showed a decline of 10, 46 and 51%, whereas, the transgenics showed an average decline of 44, 39, and 60% with NaCl, SA and combined stress, respectively. The WT showed minimum CAT activity of 1142 U/mg FW on combined stress treatments, indicating a decrease of 73% activity compared to control conditions, whereas, the transgenics showed significantly higher activity with combined stress.
FIGURE 6.
Quantification of (A) H2O2 and (B) in leaves of WT and transgenic lines in the presence of 0, 200 mM NaCl, 150 μM SA, and combined NaCl + SA stress. Values are represented as mean ± SD (n = 3) and marked with different alphabets to indicate significant difference at P ≤ 0.05 probability.
FIGURE 7.
Activity of (A) CAT and (B) SOD in WT and JcWRKY transgenic lines (L41, L43, and L46) at different NaCl, SA and combined stress treatments. Values are represented as mean ± SD (n = 3) and marked with different alphabets to indicate significant difference at P ≤ 0.05 probability.
SA Phytohormone Analysis in JcWRKY Transgenics
The SA phytohormone was quantified in WT and transgenics, and it was observed that the transgenics show increased SA content (81–99 nmoles/mg FW) as compared to WT (70 nmoles/mg FW)with SA treatment only, whereas with other treatments WT shows higher SA content. The WT showed maximum SA accumulation (133.9 nmoles/mg FW) on combined stress treatment, whereas, the transgenics showed accumulation in the range of 58–90 nmoles/mg FW (Figure 8).
FIGURE 8.
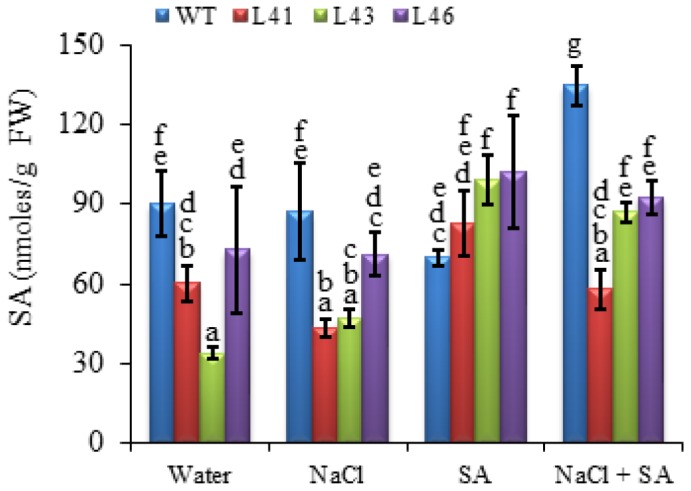
The SA concentration in WT and JcWRKY transgenic lines (L41, L43, and L46) at different NaCl, SA and combined stress treatments. Values are represented as means ± SD (n = 3) and marked with different alphabets to indicate significant difference at P ≤ 0.05 probability.
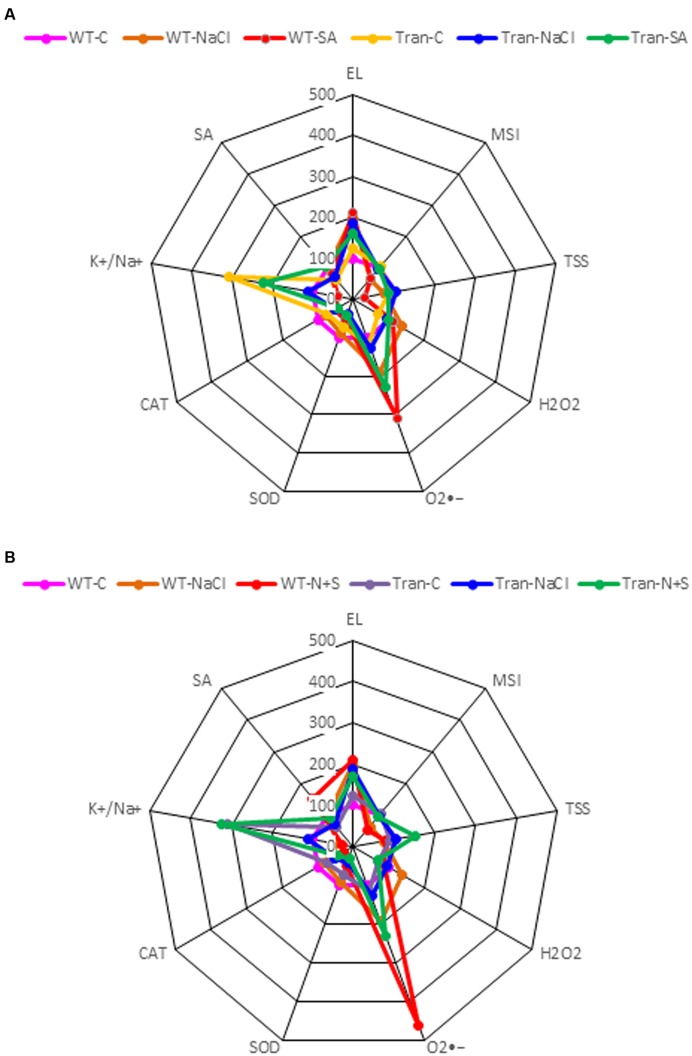
The radar diagram was built by comparing all the physio-biochemical parameters (EL, MSI, TSS, , H2O2, SOD, CAT, K+/Na+ ratio) between WT and transgenic plants under control, salinity and SA (Figure 9A) treatment and also with control, salinity and combinatorial treatment (Figure 9B). The H2O2 content was higher in WT with NaCl treatment as compared to transgenics, and was further reduced in transgenics on combinatorial stress. The highest accumulation of is observed in WT with SA and combinatorial stress, also the WT show a low K+/Na+ ratio as compared to transgenics.
FIGURE 9.
The radar diagram built by comparing all the physio-biochemical parameters between WT and transgenic plants (average of three transgenic lines) (A) NaCl, SA and control, (B) NaCl, combinatorial (NaCl + SA) stress and control.
Differential Regulation of Downstream Genes in JcWRKY Transgenics
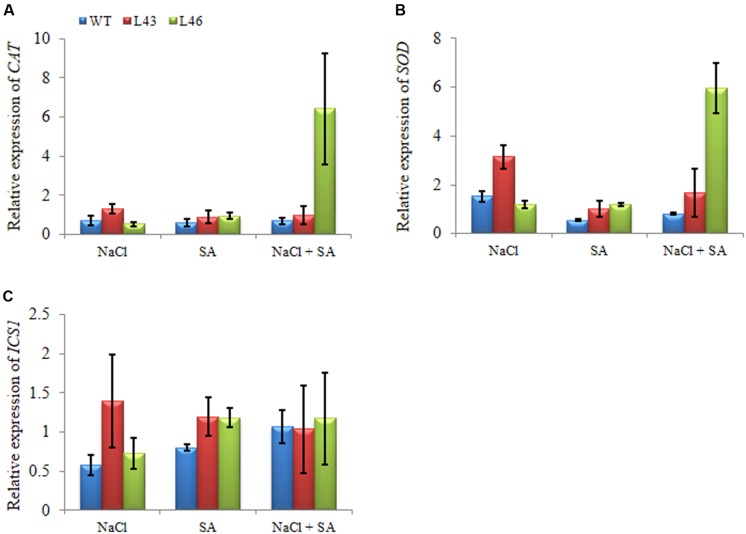
To study putative molecular mechanisms of JcWRKY overexpression for enhanced stress tolerance, expression of CAT and SOD genes and SA biosynthetic gene, isochorismate synthase 1 (ICS1) were studied. Under all three treatments, the CAT gene showed higher accumulation of transcript in transgenic lines (L43, L46) than WT. During salt treatment, the slight upregulation of CAT transcript was observed in transgenics, whereas with the combined stress L46 showed an expression of 6.43 fold (Figure 10A). Similar trend of relative expression was observed with SOD transcript. With combined stress L46 showed maximum SOD transcript expression of 6 fold (Figure 10B). Thus, L46 line showed maximum accumulation of both CAT and SOD transcript during combined stress.
FIGURE 10.
Relative-fold expression of downstream genes in JcWRKY transgenics under different stress by real-time PCR; (A) CAT, (B) SOD, and (C) ICS1. Values are represented as mean ± SE (n = 3).
The ICS1 transcript showed higher accumulation in transgenic lines as compared to WT under all the treatments, however, with combined stress similar transcript was observed in WT and transgenics (1.0–1.17-fold,Figure 10C).
Evaluation of Physio-Biochemical Parameters under Stress Conditions
The correlation coefficient between different physio-biochemical parameters in WT and transgenics exposed to salinity (Table 3), SA (Table 4) and combinatorial stress (Table 5) was analyzed. With salinity stress, the EL showed positive correlation with (0.56) and MSI was positively correlated with TSS (0.57), K+/Na+ ratio (0.71). TSS also showed positive correlation with K+/Na+ ratio (0.56). With SA treatment, the antioxidative enzymes, SOD and CAT showed positive correlation with EL (0.64) and H2O2 (0.577), respectively. The combinatorial stress resulted in K+/Na+ ratio showing positive correlation with TSS and negative correlation with , H2O2, and SOD. The CAT and SOD showed negative correlation with combined stress, whereas were positively regulated on salinity stress.
Table 3.
Correlation coefficient(r) between biochemical parameters of transgenic and WT plants exposed to 200 mM NaCl stress.
| EL | MSI | TSS | H2O2 | SOD | CAT | K+/Na+ | ||
|---|---|---|---|---|---|---|---|---|
| EL | 1.00 | |||||||
| MSI | 0.20208 | 1.00 | ||||||
| TSS | -0.01803 | 0.57156∗ | 1.00 | |||||
| 0.56506∗ | -0.40219 | -0.21321 | 1.00 | |||||
| H2O2 | 0.1742 | -0.33053 | -0.04225 | 0.75379∗∗ | 1.00 | |||
| SOD | 0.16704 | -0.63757∗∗ | -0.51527 | 0.76228∗∗ | 0.66948∗∗ | 1.00 | ||
| CAT | 0.43933 | -0.55765∗ | -0.27592 | 0.73148∗∗ | 0.45928 | 0.65534∗ | 1.00 | |
| K+/Na+ | -0.0331 | 0 0.71128∗∗ | 0.5688∗ | -0.5634∗ | -0.52176 | -0.9266∗∗ | -0.53739 | 1.00 |
For each parameter, average values of three WT and JcWRKY transgenic tobacco. Where, EL, electrolyte leakage; MSI, membrane stability index; TSS, total soluble sugar; , Superoxide radical content; H2O2, hydrogen peroxide content; SOD, superoxide dismutase; CAT, catalase; K+/Na+, ion content ratio. Where, ∗ and ∗∗ indicates significant and highly significant correlation at ∗P ≤ 0.05 and ∗∗P ≤ 0.01, respectively.
Table 4.
Correlation coefficient(r) between biochemical parameters of transgenic and WT plants exposed to 150 μM SA stress.
| EL | MSI | TSS | H2O2 | SOD | CAT | K+/Na+ | ||
|---|---|---|---|---|---|---|---|---|
| EL | 1.00 | |||||||
| MSI | -0.19704 | 1.00 | ||||||
| TSS | -0.45751 | 0.53366 | 1.00 | |||||
| 0.36511 | -0.36581 | 0.13468 | 1.00 | |||||
| H2O2 | 0.33085 | 0.029922 | -0.34809 | 0.30423 | 1.00 | |||
| SOD | 0.64186∗ | -0.71374∗∗ | -0.54695 | 0.27308 | -0.01808 | 1.00 | ||
| CAT | -0.02826 | -0.29983 | -0.09929 | 0.51824 | 0.5777∗ | 0.13499 | 1.00 | |
| K+/Na+ | -0.65956∗∗ | 0.29922 | 0.88079∗∗ | 0.07291 | -0.54204 | -0.53321 | -0.09459 | 1.00 |
For each parameter, average values of three WT and JcWRKY transgenic tobacco. Where, EL, electrolyte leakage; MSI, membrane stability index; TSS, total soluble sugar; , superoxide radical content; H2O2, hydrogen peroxide content; SOD, superoxide dismutase; CAT, catalase; K+/Na+, ion content ratio. Where, ∗ and ∗∗ indicates significant and highly significant correlation at ∗P ≤ 0.05 and ∗∗P ≤ 0.01 respectively.
Table 5.
Correlation coefficient(r) between biochemical parameters of transgenic and WT plants exposed to combinatorial (NaCl + SA) stress.
| EL | MSI | TSS | H2O2 | SOD | CAT | K+/Na+ | ||
|---|---|---|---|---|---|---|---|---|
| EL | 1.00 | |||||||
| MSI | -0.62176∗ | 1.00 | ||||||
| TSS | -0.7618∗∗ | 0.6708∗∗ | 1.00 | |||||
| 0.35273 | -0.6525∗ | -0.44079 | 1.00 | |||||
| H2O2 | 0.20019 | -0.30512 | -0.22798 | 0.6918∗∗ | 1.00 | |||
| SOD | 0.59275∗ | -0.69003∗∗ | -0.47687 | 0.65395∗ | 0.80425∗∗ | 1.00 | ||
| CAT | -0.11286 | 0.43041 | 0.27464 | -0.35295 | -0.52011 | -0.57388∗ | 1.00 | |
| K+/Na+ | -0.40287 | 0.49106 | 0.57413∗ | -0.75151∗∗ | -0.59457∗ | -0.56908∗ | 0.33074 | 1.00 |
For each parameter, average values of three WT and JcWRKY transgenic tobacco. Where, EL, electrolyte leakage; MSI, membrane stability index; TSS, total soluble sugar; , superoxide radical content; H2O2, hydrogen peroxide content; SOD, superoxide dismutase; CAT, catalase; K+/Na+, ion content ratio. Where, ∗ and ∗∗ indicates significant and highly significant correlation at ∗P ≤ 0.05 and ∗∗P ≤ 0.01 respectively.
Discussion
Transcriptional control is a major mechanism regulating the cellular processes during stress signaling. Stress sensing triggers large scale transcriptional programing for minimizing the deleterious effect of stress (Nakashima et al., 2014). Since, the plants are exposed to multiple stress simultaneously, therefore transcriptional control facilitates to regulate the complex patterns of gene expression during multiple stresses. The research on stress signaling is mainly focused on individual stress treatments, however, understanding of combinatorial stress is important for developing crop resilence toward environmental conditions (Kissoudis et al., 2014). The phytohormones, signaling molecules, TFs, ROS, ion fluxes are the major components of the regulatory network that crosstalk and converge to provide protective responses of plants against different stresses. The WRKY TFs interact with other TFs, or with WRKY themselves and also directly regulate some functional genes to impart stress tolerance (Agarwal et al., 2011). Salinity stress generates both hyperosmotic and hyperionic stress, the osmotic stress or physiological dehydration being imposed at an early phase and ionic stress at a later stage of plant growth (Shavrukov, 2013). The role of SA phytohormone is well-characterized toward regulating the plant defense responses, however, it also ameliorates toxicity induced by salinity, but the downstream mechanism involved in imparting salinity tolerance remains unclear (Wani et al., 2016). The SA functions as a universal signaling component for both abiotic and biotic stresses. The effect of exogenous SA on plant responses/processes is greatly dependent on concentration and plant species. The application of the SA in appropriate concentration, enhances stress tolerance (Miura and Tada, 2014). Usually low concentrations of SA might enhance the antioxidant capacity, however, high concentrations lead to cell death or susceptibility to abiotic stresses (Hara et al., 2012). Kang et al. (2014) reported that SA participates in abiotic stress-induced signaling by improving the antioxidant capacity of the plant.
In this study, JcWRKY transgenics showed enhanced tolerance toward salinity, which, further improved on application of low SA concentration. The detailed analysis of transgenic plants reveals the possibility that JcWRKY regulates ROS homeostasis via SA signaling for combating stress. The JcWRKY transgenics showed higher chlorophyll content and seed germination under salinity. Similarly, earlier reports revealed the involvement of WRKY in stress tolerance in different plant system. A comprehensive microarray analysis of the Arabidopsis root transcriptome showed regulation of different WRKY during salinity stress (Jiang and Deyholos, 2006). The AtWRKY25 and AtWRKY33 form a transcriptional network independent of SOS signaling and confer salt tolerance to transgenics (Jiang and Deyholos, 2009). The GmWRKY54 transgenic Arabidopsis showed salt/drought tolerance, possibly through the regulation of TF like DREB2A and STZ/Zat10 (Zhou et al., 2008). The Arabidopsis WRKY8 functions antagonistically with its interacting partner VQ9 for appropriate maintenance of WRKY8 TF signaling during salt stress (Hu et al., 2013). The overexpression of WRKY TFs is also found associated with improved systemic acquired resistance and SA signaling (Li et al., 2004; Vallad and Goodman, 2004; Agarwal et al., 2011). We observed that the SA assisted toward better control of salt stress and did not result in any detrimental effect on the transgenics, on the contrary, it facilitated better growth with improved TSS, MSI and reduced EL. Similarly, the TaWRKY2 and TaWRKY19 transgenics showed higher soluble sugar and reduced EL (Niu et al., 2012). The JcWRKY transgenics showed low levels of and H2O2, similarly tobacco transgenics overexpressing TaWRKY10 gene showed reduced levels of and H2O2 on exposure to salinity and drought stresses (Wang et al., 2013). The accumulation of showed an additive effect in WT on combined stress treatment as compared to water or NaCl treatment, whereas, in the transgenics the additive accumulation of was not observed, indicating that SA participates more efficiently in JcWRKY transgenics for regulating the ROS homeostasis through SA mediated signaling. ROS homeostasis is maintained by a balance of ROS generation and its scavenging (Apel and Hirt, 2004). ROS represent a common signal and significant point of convergence between stress signaling pathways (Fujita et al., 2006). The SA plays an equivocal role in promoting ROS accumulation (prooxidant) and also toward ROS scavenging (antioxidant) during different stress conditions (Miura and Tada, 2014). SA modulates ROS homeostasis by regulating plant antioxidant machinery and also via transcriptional regulation of genes.
The MAPK (MAP kinase) cascade also participates in SA or ROS signaling to regulate downstream genes (Rodriguez et al., 2010), furthermore certain SA or ROS activated MAKs also regulate abiotic stress response (Asai et al., 2002). The WRKY family of TFs that bind to the W-box (TTGAC(C/T) participate in SA-mediated transcriptional programming (Pandey and Somssich, 2009). The WRKY25 and WRKY33 TFs may act downstream of the MPK4-mediated signaling and contribute toward SA-dependent disease resistance response (Andreasson et al., 2005). Shen et al. (2012), reported phosphorylation of OsWRKY30 by MAPK cascade for enhanced drought tolerance in rice, WRKY TFs act downstream of various MAPKs (Asai et al., 2002; Liu et al., 2004) in regulating plant defense gene activation. We have earlier reported the presence of seven potential phosphorylation sites in JcWRKY, the binding of the SA-inducible JcWRKY TF to the W-box of PR-1 and iso1 promoter (Agarwal et al., 2014).
The JcWRKY transgenics showed low Na+ concentration in tissues, thereby maintained high K+/Na+, an important feature required for growth and tolerance during hyperionic stress. With salinity stress, the entry of Na+ ions lowers the cytosolic K+ content required for various cellular metabolic processes (Shabala, 2009). Jayakannan et al. (2013) report that SA improves salinity tolerance in Arabidopsis, pretreating roots with SA decreased K+ loss through guard cell outward-rectifying K+ channel (GORK) or by ROS-activated non-selective cation channels (NSCCs). The SA pretreatment is also reported to up-regulate the plasma membrane H+-ATPase activity (Liu et al., 2009). Thus, cross talk of SA and ROS also participates in ion transport processes during salinity stress.
Plants contain a complex antioxidative defense system, antioxidative enzymes are key components of ROS scavenging system. SOD is a major scavenger of it catalyzes the formation of H2O2 and . The H2O2 thus produced is scavenged by CAT. Upregulation of CAT and SOD genes in JcWRKY transgenics show their involvement in ROS scavenging. The W-box sequence of WRKY is also reported in the promoters of a number of superoxide inducible genes (Scarpeci et al., 2008). The SOD activity of JcWRKY transgenics is low as compared to WT, which could be due to the reduced accumulation in the transgenics. The CAT activity is reduced in both WT and transgenics on NaCl/SA application, however, with combined stress the CAT activity of transgenics improves, but its activity gets further reduced in WT, indicating the protective role of SA in the transgenics. Interestingly, on combinatorial stress the CAT and SOD showed negative correlation, whereas were positively regulated on salinity stress (Tables 3 and 5). The relationship between SA and H2O2 during stress condition is defined by a “self amplifying feedback loop” concept, wherein, H2O2 induces SA accumulation, and SA results in enhanced H2O2 concentration (Shirasu et al., 1997). The enhanced H2O2 concentration by SA is due to inhibition of CAT (Durner and Klessig, 1996).
The WRKY28 TF positively regulates the expression of ICS1 involved in SA biosynthesis pathway (van Verk et al., 2011). The transcript expression of the ICS1 was upregulated in the JcWRKY transgenics, however, interestingly, transgenics maintained the SA phytohormone level during stress conditions and the SA content of the transgenics was higher than WT only on exogenous SA treatment. It can be speculated that the SA and ROS self amplifying feedback loop, facilitated the maintenance of SA and ROS during stress. The OsWRKY13 TF activates both SA synthesis-related genes and SA-responsive genes, suggesting that OsWRKY13 activates both upstream and downstream components of SA (Qiu et al., 2007).
Conclusion
The understanding and deployment of different strategies toward developing resilient crops that maintain their vigor and productivity with diverse environmental conditions is of prime importance toward generating/facilitating economic sustainable agriculture. Developing resistance to combinatorial stress is challenging and encouraging via involvement of TFs through fine tuning of downstream targets to achieve the desired response. Approaches that result in ROS homeostasis, provide a potential strategy for engineering crop stress tolerance against multiple or combinatorial stresses. In the present study, we highlight the regulatory role of JcWRKY toward improved salinity and also oxidative stress. The tolerance of transgenics, as evident by different physiological and biochemical parameters including low Na+/ K+ ratio under salinity stress, may be due to improved SA signaling coupled with ROS homeostasis. The transgenics show better tolerance potential to individual as well as combined stresses, indicating improved SA-mediated transcriptional maintenance of ROS homeostasis. Thus, JcWRKY can be deployed to engineer stress tolerant transgenic crops for sustained growth and productivity under unfavorable conditions.
Author Contributions
PA conceived the study, performed gene cloning, data analysis. PA and PKA designed and coordinated the experiments and did manuscript writing. MD carried out tobacco transformation, KS involved in biochemical experiments, PJ involved in real-time expression of transgenics. All authors have read and approved the final manuscript.
Conflict of Interest Statement
The authors declare that the research was conducted in the absence of any commercial or financial relationships that could be construed as a potential conflict of interest.
Acknowledgments
CSIR-CSMCRI Communication No.-PRIS 104/2016. PA acknowledges the financial support from DST-WOS-A scheme. MD, KS, PJ are supported by UGC-RGNF, DST-INSPIRE, and UGC-JRF fellowship, respectively.
Footnotes
Funding. The authors are thankful to DST (Department of Science and Technology) and CSIR (Council of Scientific and Industrial Research), New Delhi, India, for financial assistance and support.
Supplementary Material
The Supplementary Material for this article can be found online at: http://journal.frontiersin.org/article/10.3389/fpls.2016.01541
References
- Agarwal P., Dabi M., Agarwal P. K. (2014). Molecular cloning and characterization of a group II WRKY transcription Factor from Jatropha curcas, an important biofuel crop. DNA Cell Biol. 33 503–551. 10.1089/dna.2014.2349 [DOI] [PMC free article] [PubMed] [Google Scholar]
- Agarwal P., Dabi M., Das M., Patel K., Agarwal P. K. (2015). An economical and efficient protocol for total RNA isolation from Jatropha curcas. Int. J. Environ. Stud. 72 624–630. 10.1080/00207233.2015.1031566 [DOI] [Google Scholar]
- Agarwal P., Dabi M., More P., Patel K., Jana K., Agarwal P. K. (2016a). Improved shoot regeneration, salinity tolerance and reduced fungal susceptibility in transgenic tobacco constitutively expressing PR-10a gene. Front. Plant Sci. 7:217 10.3389/fpls.2016.00217 [DOI] [PMC free article] [PubMed] [Google Scholar]
- Agarwal P., Patel K., Das A. K., Ghosh A., Agarwal P. K. (2016b). Insights into the role of seaweed Kappaphycus alvarezii sap towards phytohormone signalling and regulating defence responsive genes in Lycopersiconesculentum. J. Appl. Phycol. 28 2529–2537. 10.1007/s10811-015-0784-1 [DOI] [Google Scholar]
- Agarwal P., Reddy M. P., Chikara J. (2011). WRKY: its structure, evolutionary relationship, DNA-binding selectivity, role in stress tolerance and development of plants. Mol. Biol. Rep. 38 3883–3896. 10.1007/s11033-010-0504-5 [DOI] [PubMed] [Google Scholar]
- Agarwal P. K., Jha B. (2010). Transcription factors in plants and ABA dependent and independent abiotic stress signalling. Biol. Plant. 54 201–212. 10.1007/s10535-010-0038-7 [DOI] [Google Scholar]
- Agarwal P. K., Shukla P. S., Gupta K., Jha B. (2013). Bioengineering for salinity tolerance in plants: state of the art. Mol. Biotechnol. 54 102–123. 10.1007/s12033-012-9538-3 [DOI] [PubMed] [Google Scholar]
- Andreasson E., Jenkins T., Brodersen P., Thorgrimsen S., Petersen N. H. T., Zhu S., et al. (2005). The MAP kinase substrate MKS1 is a regulator of plant defense responses. EMBO J. 24 2579–2589. 10.1038/sj.emboj.7600737 [DOI] [PMC free article] [PubMed] [Google Scholar]
- Apel K., Hirt H. (2004). Reactive oxygen species: metabolism, oxidative stress, and signal transduction. Annu. Rev. Plant. Biol. 55 373–399. 10.1146/annurev.arplant.55.031903.141701 [DOI] [PubMed] [Google Scholar]
- Asai T., Tena G., Plotnikova J., Willmann M. R., Chiu W.-L., Gomez-Gomez L., et al. (2002). MAP kinase signalling cascade in Arabidopsis innate immunity. Nature 415 977–983. 10.1038/415977a [DOI] [PubMed] [Google Scholar]
- Baranwal V. K., Negi N., Khurana P. (2016). Genome-wide identification and structural, functional and evolutionary analysis of WRKY components of mulberry. Sci. Rep. 6:30794 10.1038/srep30794 [DOI] [PMC free article] [PubMed] [Google Scholar]
- Beauchamp C., Fridovich I. (1971). Superoxide dismutase: improved assays and an assay applicable to acrylamide gels. Anal. Biochem. 44 276–287. 10.1016/0003-2697(71)90370-8 [DOI] [PubMed] [Google Scholar]
- Dhindsa R. S., Plump-Dhindsa P., Thorpe T. A. (1981). Leaf senescence: correlated with increased levels of membrane permeability and lipid peroxidation, and decreased levels of superoxide dismutase and catalase. J. Exp. Bot. 32 93–101. 10.1093/jxb/32.1.93 [DOI] [Google Scholar]
- Doyle J. J., Doyle J. L. (1987). A rapid DNA isolation procedure from small quantities of fresh leaf tissues. Phytochem. Bull. 19 11–15. [Google Scholar]
- Durner J. R., Klessig D. F. (1996). Salicylic acid is a modulator of tobacco and mammalian catalases. J. Biol. Chem. 271 28492–28501. 10.1074/jbc.271.45.28492 [DOI] [PubMed] [Google Scholar]
- Eulgem T., Rushton P. J., Robatzek S., Somssich I. E. (2000). The WRKY superfamily of plant transcription factors. Trends Plant Sci. 5 199–206. 10.1016/S1360-1385(00)01600-9 [DOI] [PubMed] [Google Scholar]
- Fujita M., Fujita Y., Noutoshi Y., Takahashi F., Narusaka Y., Yamaguchi-Shinozaki K., et al. (2006). Crosstalk between abiotic and biotic stress responses: a current view from the points of convergence in the stress signalling networks. Curr. Opin. Plant Biol. 9 436–442. 10.1016/j.pbi.2006.05.014 [DOI] [PubMed] [Google Scholar]
- Giannopolitis C. N., Ries S. K. (1977). Superoxide dismutases I. occurrence in higher plants. Plant Physiol. 59 309–314. 10.1104/pp.59.2.309 [DOI] [PMC free article] [PubMed] [Google Scholar]
- Hara M., Furukawa J., Sato A., Mizoguchi T., Miura K. (2012). “Abiotic stress and role of salicylic acid in plants,” in Abiotic Stress Responses in Plants, eds Parvaizaand A., Prasad M. N. V. (NewYork NY: Springer; ), 235–251. 10.1007/978/-1-4614-0634-1_13 [DOI] [Google Scholar]
- Horsch R. B., Fry J. E., Hoffmann N. L., Eichholtz D., Rogers S. G., Fraley R. T. (1985). A simple and general method for transferring genes into plants. Science 227 1229–1231. 10.1126/science.227.4691 [DOI] [PubMed] [Google Scholar]
- Hu Y., Chen L., Wang H., Zhang L., Wang F., Yu D. (2013). Arabidopsis transcription factor WRKY8 functions antagonistically with its interacting partner VQ9 to modulate salinity stress tolerance. Plant J. 10 730–745. 10.1111/tpj.12159 [DOI] [PubMed] [Google Scholar]
- Iida K., Seki M., Sakurai T., Satou M., Akiyama K., Toyoda T., et al. (2005). RARTF: database and tools for complete sets of Arabidopsis transcription factors. DNA Res. 12 247–256. 10.1093/dnares/dsi011 [DOI] [PubMed] [Google Scholar]
- Jayakannan M., Bose J., Babourina O., Rengel Z., Shabala S. (2013). Salicylic acid improves salinity tolerance in Arabidopsis by restoring membrane potential and preventing salt-induced K+ loss via a GORK channel. J. Exp. Bot. 64 2255–2268. 10.1093/jxb/ert085 [DOI] [PMC free article] [PubMed] [Google Scholar]
- Jiang Y., Deyholos M. K. (2006). Comprehensive transcriptional profiling of NaCl-stressed Arabidopsis roots reveals novel classes of responsive genes. BMC Plant Biol. 6:25 10.1186/1471-2229-6-25 [DOI] [PMC free article] [PubMed] [Google Scholar]
- Jiang Y., Deyholos M. K. (2009). Functional characterization of Arabidopsis NaCl-inducible WRKY25 and WRKY33 transcription factors in abiotic stresses. Plant Mol. Biol. 69 91–105. 10.1007/s11103-008-9408-3 [DOI] [PubMed] [Google Scholar]
- Johnson C. S., Kolevski B., Smyth D. R. (2002). TRANSPARENTTESTAGL-ABRA2, a trichome and seed coat development gene of Arabidopsis, encodes a WRKY transcription factor. Plant Cell 14 1359–1375. 10.1105/tpc.001404 [DOI] [PMC free article] [PubMed] [Google Scholar]
- Kang G., Li G., Guo T. (2014). Molecular mechanism of salicylic acid- induced abiotic stress tolerance in higher plants. Acta. Physiol. Plant 36 2287–2297. 10.1007/s11738-014-1603-z [DOI] [Google Scholar]
- Kissoudis C., van de Wiel C., Visser R. G., van der Linden G. (2014). Enhancing crop resilience to combined abiotic and biotic stress through the dissection of physiological and molecular crosstalk. Front. Plant Sci. 5:207 10.3389/fpls.2014.00207 [DOI] [PMC free article] [PubMed] [Google Scholar]
- Li J., Brader G., Palva E. T. (2004). The WRKY70 transcription factor: a node of convergence for jasmonate-mediated and salicylate-mediated signals in plant defense. Plant Cell 16 319–331. 10.1105/tpc.016980 [DOI] [PMC free article] [PubMed] [Google Scholar]
- Liu Y., Liu H., Pan Q., Yang H., Zhan J., Huang W. (2009). The plasma membrane H+-ATPase is related to the development of salicylic acid-induced thermotolerance in pea leaves. Planta 229 1087–1098. 10.1007/s00425-009-0897-3 [DOI] [PubMed] [Google Scholar]
- Liu Y., Schiff M., Dinesh-Kumar S. P. (2004). Involvement of MEK1 MAPKK, NTF6 MAPK, WRKY/MYB transcription factors, COI1 and CTR1 in N-mediated resistance to tobacco mosaic virus. Plant J. 38 800–809. 10.1111/j.1365-313X.2004.02085.x [DOI] [PubMed] [Google Scholar]
- Livak K. J., Schmittgen T. D. (2001). Analysis of relative gene expression data using real-time quantitative PCR and the 2(-Delta DeltaC(T)) method. Methods 25 402–408. 10.1006/meth.2001.1262 [DOI] [PubMed] [Google Scholar]
- Luo M., Dennis E. S., Berger F., Peacock W. J., Chaudhury A. (2005). MINISEED3 (MINI3), a WRKY family gene, and HAIKU2 (IKU2), a leucine-rich repeat (LRR) KINASE gene, are regulators of seed size in Arabidopsis. Proc. Natl. Acad. Sci. U.S.A 102 17531–17536. 10.1073/pnas.0508418102 [DOI] [PMC free article] [PubMed] [Google Scholar]
- Mewes H. W., Albermann K., Bähr M., Frishman D., Gleissner A., Hani J., et al. (1997). Overview of the yeast genome. Nature 387 (Suppl. 6632), 7–65. 10.1038/42755 [DOI] [PubMed] [Google Scholar]
- Miura K., Tada Y. (2014). Regulation of water, salinity, and cold stress responses by salicylic acid. Front. Plant Sci. 5:4 10.3389/fpls.2014.00004 [DOI] [PMC free article] [PubMed] [Google Scholar]
- Murashige T., Skoog F. (1962). A revised medium for rapid growth and bio assays with tobacco tissue cultures. Physiol. Plant 15 473–497. 10.1111/j.1399-3054.1962.tb08052.x [DOI] [Google Scholar]
- Nakashima K., Yamaguchi-Shinozaki K., Shinozaki K. (2014). The transcriptional regulatory network in the drought response and its crosstalk in abiotic stress responses including drought, cold, and heat. Front. Plant Sci. 5:170 10.3389/fpls.2014.00170 [DOI] [PMC free article] [PubMed] [Google Scholar]
- Niu C., Wei W., Zhou Q., Tian A., Hao Y., Zhang W., et al. (2012). Wheat WRKY genes TaWRKY2 and TaWRKY19 regulate abiotic stress tolerance in transgenic Arabidopsis plants. Plant Cell Environ. 35 1156–1170. 10.1111/j.1365-3040.2012.02480.x [DOI] [PubMed] [Google Scholar]
- Pan X., Welti R., Wang X. (2010). Quantitative analysis of major plant hormones in crude plant extracts by high-performance liquid chromatography-mass spectrometry. Nat. Protoc. 5 986–992. 10.1038/nprot.2010.37 [DOI] [PubMed] [Google Scholar]
- Pandey S. P., Somssich I. E. (2009). The role of WRKY transcription factors in plant immunity. Plant Physiol. 150 1648–1655. 10.1104/pp.109.138990 [DOI] [PMC free article] [PubMed] [Google Scholar]
- Pardo J. M. (2010). Biotechnology of water and salinity stress tolerance. Curr. Opin. Biotechnol. 21 185–196. 10.1016/j.copbio.2010.02.005 [DOI] [PubMed] [Google Scholar]
- Qiu D., Xiao J., Ding X., Xiong M., Cai M., Cao Y., et al. (2007). OsWRKY13 mediates rice disease resistance by regulating defense related genes in salicylate- and jasmonate-dependent signaling. Mol. Plant Microbe Interact. 20 492–499. 10.1094/MPMI-20-5-0492 [DOI] [PubMed] [Google Scholar]
- Rodriguez M. C., Petersen M., Mundy J. (2010). Mitogen-activated protein kinase signalling in plants. Annu. Rev. Plant Biol. 61 621–649. 10.1146/annurev-arplant-042809-112252 [DOI] [PubMed] [Google Scholar]
- Rushton P. J., Somssich I. E., Ringler P., Shen Q. J. (2010). WRKY transcription factors. Trends Plant Sci. 15 247–258. 10.1016/j.tplants.2010.02.006 [DOI] [PubMed] [Google Scholar]
- Sarkar T., Thankappan R., Kumar A., Mishra G. P., Dobaria J. R. (2016). Stress inducible expression of AtDREB1A transcription factor in transgenic peanut (Arachis hypogaea L.) Conferred Tolerance to Soil-Moisture Deficit Stress. Front. Plant Sci. 7:935 10.3389/fpls.2016.00935 [DOI] [PMC free article] [PubMed] [Google Scholar]
- Scarpeci T. E., Zanor M. I., Carrillo N., Mueller-Roeber B., Valle E. M. (2008). Generation of superoxide anion in chloroplasts of Arabidopsis thaliana during active photosynthesis: a focus on rapidly induced genes. Plant Mol. Biol. 66 361–378. 10.1007/s11103-007-9274-4 [DOI] [PMC free article] [PubMed] [Google Scholar]
- Schmutz J., Cannon S. B., Schlueter J., Ma J., Mitros T., Nelson W., et al. (2010). Genome sequence of the palaeopolyploid soybean. Nature 463 178–183. 10.1038/nature08670 [DOI] [PubMed] [Google Scholar]
- Shabala S. (2009). Salinity and programmed cell death: unravelling mechanisms for ion specific signalling. J. Exp. Bot. 60 709–712. 10.1093/jxb/erp013 [DOI] [PubMed] [Google Scholar]
- Shavrukov Y. (2013). Salt stress or salt shock: which genes are we studying? J. Exp. Bot. 64 119–127. 10.1093/jxb/ers316 [DOI] [PubMed] [Google Scholar]
- Shen H., Liu C., Zhang Y., Meng X., Zhou X., Chu C., et al. (2012). OsWRKY30 is activated by MAP kinases to confer drought tolerance in rice. Plant Mol. Biol. 80 241–253. 10.1007/s11103-012-9941-y [DOI] [PubMed] [Google Scholar]
- Shirasu K., Nakajima H., Rajasekhar V. K., Dixon R. A., Lamb C. (1997). Salicylic acid potentiates an agonist-dependent gain control that amplifies pathogen signals in the activation of defense mechanisms. Plant Cell 9 261–270. 10.1105/tpc.9.2.261 [DOI] [PMC free article] [PubMed] [Google Scholar]
- Shiu S. H., Shih M. C., Li W. H. (2005). Transcription factor families have much higher expansion rates in plants than in animals. Plant Physiol. 139 18–26. 10.1104/pp.105.065110 [DOI] [PMC free article] [PubMed] [Google Scholar]
- Shukla P. S., Agarwal P. K., Jha B. (2012). Improved salinity tolerance of Arachis hypogaea (L.) by the interaction of halotolerant plant-growth-promoting Rhizobacteria. J. Plant Growth Regul. 31 195–206. 10.1007/s00344-011-9231-y [DOI] [Google Scholar]
- Shukla P. S., Gupta K., Agarwal P., Jha B., Agarwal P. K. (2015). Overexpression of a novel SbMYB15 from Salicornia brachiata confers salinity and dehydration tolerance by reduced oxidative damage and improved photosynthesis in transgenic tobacco. Planta 242 1291–1308. 10.1007/s00425 [DOI] [PubMed] [Google Scholar]
- Topfer R., Matzeit V., Gronenborn B., Schell J., Steinbiss H. H. (1987). A set of plant expression vectors for transcriptional and translational fusions. Nucleic Acids Res. 15 5890 10.1093/nar/15.14.5890 [DOI] [PMC free article] [PubMed] [Google Scholar]
- Vaahtera L., Brosche M. (2011). More than the sum of its parts. How to achieve a specific transcriptional response to abiotic stress. Plant Sci. 180 421–430. 10.1016/j.plantsci.2010.11.009 [DOI] [PubMed] [Google Scholar]
- Vallad G. E., Goodman R. M. (2004). Systemic acquired resistance and induced systemic resistance in conventional agriculture. Crop Sci. 44 1920–1934. 10.2135/cropsci2004.1920 [DOI] [Google Scholar]
- van Verk M. C., Bol J. F., Linthorst H. J. (2011). WRKY transcription factors involved in activation of SA biosynthesis genes. BMC Plant Biol. 11:89 10.1186/1471-2229-11-89 [DOI] [PMC free article] [PubMed] [Google Scholar]
- Wang C., Deng P., Chen L., Wang X., Ma H., Hu W., et al. (2013). A wheat WRKY transcription factor TaWRKY10 confers tolerance to multiple abiotic stresses in transgenic tobacco. PLoS ONE 8:e65120 10.1371/journal.pone.0065120 [DOI] [PMC free article] [PubMed] [Google Scholar]
- Wani S. H., Kumar V., Shriram V., Sah S. K. (2016). Phytohormones and their metabolic engineering for abiotic stress tolerance in crop plants. Crop J. 4 162–176. 10.1016/j.cj.2016.01.010 [DOI] [Google Scholar]
- Xiong W., Xu X., Zhang L., Wu P., Chen Y., Li M., et al. (2013). Genome-wide analysis of the WRKY gene family in physic nut (Jatropha curcas L.). Gene 524 124–132. 10.1016/j.gene.2013.04.047 [DOI] [PubMed] [Google Scholar]
- Xiong Y., Liu T., Tian C., Sun S., Li J., Chen M. (2005). Transcription factors in rice: a genome-wide comparative analysis between monocots and eudicots. Plant Mol. Biol. 59 191–203. 10.1007/s11103-005-6503-6 [DOI] [PubMed] [Google Scholar]
- Zhou Q. Y., Tian A. G., Zou H. F., Xie Z. M., Lei G., Huang J., et al. (2008). Soybean WRKY-type transcription factor genes, GmWRKY13, GmWRKY21, and GmWRKY54, confer differential tolerance to abiotic stresses in transgenic Arabidopsis plants. Plant Biotechnol. J. 6 486–503. 10.1111/j.1467-7652.2008.00336.x [DOI] [PubMed] [Google Scholar]
Associated Data
This section collects any data citations, data availability statements, or supplementary materials included in this article.


