

Neijts et al. show that a series of enhancers, some of which are Wnt-dependent, is located within a HoxA 3′ subTAD. This subTAD forms the structural basis for multiple layers of 3′-polarized features, including DNA accessibility and enhancer activation.
Keywords: Hox regulation, chromatin conformation, DNA accessibility, developmental enhancers, regulatory landscapes
Abstract
Sequential 3′-to-5′ activation of the Hox gene clusters in early embryos is a most fascinating issue in developmental biology. Neither the trigger nor the regulatory elements involved in the transcriptional initiation of the 3′-most Hox genes have been unraveled in any organism. We demonstrate that a series of enhancers, some of which are Wnt-dependent, is located within a HoxA 3′ subtopologically associated domain (subTAD). This subTAD forms the structural basis for multiple layers of 3′-polarized features, including DNA accessibility and enhancer activation. Deletion of the cassette of Wnt-dependent enhancers proves its crucial role in initial transcription of HoxA at the 3′ side of the cluster.
Correctly timed initiation of Hox transcription is fundamental to mediating the generation and patterning of nascent axial embryonic tissues (Kmita and Duboule 2003; Deschamps and van Nes 2005). Initial transcription of the earliest Hox genes in mouse embryos takes place in the posterior epiblast in precursors of the extraembryonic and embryonic mesoderm at the late primitive streak stage (embryonic day 7.2 [E7.2]) during gastrulation (Fig. 1A; Forlani et al. 2003). A striking feature is that the very first Hox gene is poised for transcription at the beginning of gastrulation, one full day before its transcription really starts (Forlani et al. 2003). Here we set out to investigate the molecular genetic interactions implementing the earliest Hox gene transcription.
Figure 1.

Transcriptional initiation of HoxA in early embryos and in epiblast stem cells (EpiSCs). (A) Early expression pattern of Hoxa1 in gastrulating embryos. (A) Anterior; (P) posterior. (B) Precocious induction of Hoxa1 expression in an E6.0 embryo by Chiron (10 h). Bar, 100 µm. (C) Parallelism between induction of Hoxa1 in embryos and Wnt-stimulated induction of Hoxa1 in EpiSCs. (IWP2) Wnt inhibitor. (D) Kinetics of induction of HoxA genes by Chiron in wild-type EpiSCs. Transcription measured by RT-qPCR is relative to the highest value of expression. Error bars indicate ±SD. (*) P < 0.05; (**) P < 0.01. (E) H3K27me3 and H3K4me3 marks along the HoxA cluster in uninduced (0 h) and Wnt-induced (12 and 72 h) Wnt3-null EpiSCs.
Results and Discussion
Wnt activates Hox in a temporally collinear way
We reasoned that the trigger for Hox activation might be a canonical Wnt signal: Wnt3 is present in the early posterior epiblast just before primitive streak formation (Rivera-Perez and Magnuson 2005), and Wnt3-null mutants do not express Hox genes (Liu et al. 1999). Pregastrulation embryos (E6.0, “prestreak,” before primitive streak appearance) do not express Hox genes, but exposure to CHIR99021 (Chiron, a Wnt agonist) for 10 h strongly induces expression of the 3′ paralogs Hoxa1 and Hoxb1 (Fig. 1B; Supplemental Fig. S1A). This observation led us to turn to a cell culture system very close to the pregastrulation epiblast: epiblast stem cells (EpiSCs) (Brons et al. 2007; Tesar et al. 2007). Activation of the Wnt pathway confers these cells a primitive streak-like identity (Kojima et al. 2014; Tsakiridis et al. 2015). We generated EpiSCs from wild-type and Wnt3-null pregastrula epiblasts and cultured them in the presence of Wnt inhibitor IWP2 (Fig. 1C). Upon Wnt stimulation by Chiron, Hox genes were induced rapidly, reminiscent of what occurs in prestreak embryos. Wnt activation induced not only the 3′-most Hox gene but the other Hox genes as well in a temporally collinear way, mimicking the in vivo situation (Fig. 1D; Supplemental Fig. S1B,C; Supplemental Table S1; Izpisua-Belmonte et al. 1991; Deschamps and van Nes 2005). We observed similar results upon inducing wild-type and Wnt3-null EpiSCs with Chiron (shown for Hoxa1 in Supplemental Fig. S1D).
We compared the Hox chromatin states prior to and after Wnt exposure in EpiSCs that never experienced Wnt signaling before. We observed a dense coverage across the entire cluster by the repressive chromatin mark H3K27me3 (deposited by Polycomb-repressive complex 2 [PRC2]) and by PRC1 component Ring1b (Fig. 1E; Supplemental Fig. S2). Wnt activation leads to the removal of these repressive decorations, starting on the 3′ side of the clusters and reaching completion ∼72 h after Chiron addition. The progressive loss of the H3K27me3 and Ring1b coverage was accompanied by the deposition of the activating marks H3K4me3 and H3K27ac, similar to what was shown for HoxD in midgestation embryos (Fig. 1E; Supplemental Fig. S2; Soshnikova and Duboule 2009).
Putative early HoxA enhancers are located in a 3′ subtopologically associated domain (subTAD)
A key component of developmental gene regulation is the interaction between promoters and their regulatory landscapes (de Laat and Duboule 2013). For in-depth analysis of early Hox regulation, we further focused on the HoxA cluster, which is located at the boundary between two TADs (Supplemental Fig. S3A, top row; Dixon et al. 2012). Circularized chromosome conformation capture (4C) combined with sequencing (4C-seq) shows that most HoxA genes interact much more frequently with regions lying in the 3′ TAD than with sequences in the 5′ TAD. Only the posterior-most Hoxa13 mainly contacts remote sequences in the 5′ TAD (Supplemental Fig. S3A). We observed that a proximal 300-kb genomic interval contains the majority of the interactions and, together with the 3′ side of the HoxA cluster, forms a 3′ subTAD (Fig. 2A; Supplemental Fig. S3A). Quantification of the interactions reveals that the more 3′ the HoxA gene, the more it contacts the 3′ subTAD, with Hoxa1 showing a majority of these interactions, in particular with the proximal part of the 3′ subTAD (Supplemental Fig. S3B). Comparison of 4C-seq profiles between embryonic stem cells (ESCs) and EpiSCs revealed that the Hoxa1 interaction domain is less restricted in ESCs (Supplemental Fig. S3C), indicating that the 3′ subTAD conformation is reinforced specifically in EpiSCs. We identified several H3K27ac peaks in the 3′ subTAD that correspond to previously identified β-catenin-binding regions (Zhang et al. 2013). Several of them overlap with 4C-seq interaction regions with Hoxa1 (Fig. 2A) and are now referred to as “HoxA developmental early side” (Ades) putative enhancers. Three Ades regions are already acetylated before Wnt exposure (Ades3-4 [part of the Halr1 long noncoding RNA locus {De Kumar et al. 2015}], Ades5, and Ades6), and two depend on Wnt exposure (Ades1 and Ades2) for their acetylation (Fig. 2A). Ades1 lies in a region that was shown to drive part of the Hoxa1 endogenous expression pattern (Frasch et al. 1995; Nolte et al. 2013). In reciprocal 4C-seq experiments, we found that the Ades sites show interactions with the 3′ part of the Hox cluster (Supplemental Fig. S4). The 3′ subTAD that we identified in EpiSCs is therefore a domain of intensive interactions between the cluster and its putative enhancers.
Figure 2.

Interactions between the HoxA locus and putative Ades enhancers. (A) Zoom in on 3′ subTAD region with 4C-seq profile from the Hoxa1 viewpoint (red dotted line) and distribution of H3K27ac in uninduced (0 h) and Chiron-induced (24 h) EpiSCs. Positions acetylated before induction (Ades3–4, Ades5, and Ades6) and positions becoming acetylated after induction (Ades1 and Ades2) are highlighted in red and blue, respectively. β-Catenin (β-cat)-binding regions (Zhang et al. 2013) are indicated. (B) 4C-seq profiles from Ades enhancers and HoxA viewpoints in uninduced (−) and Wnt-stimulated (+) conditions. The patterns of interactions define a proximal and a distal subpart of the 3′ subTAD. Wnt stimulation results in more compaction of these segments (arrows). The HoxA cluster appears to comprise three parts, indicated below. See also Supplemental Figures S5 and S6.
The HoxA landscape is segmented in several subdomains with particular interaction specificities
We investigated whether chromosome architecture changes during Hox initiation in EpiSCs. Chromosomal interactions of Hoxa1 with the Ades region within the 3′ subTAD do not change upon Wnt stimulation (Fig. 2B; Supplemental Fig. S5A), indicating a constitutively active conformation of this region. In uninduced conditions, contacts between the most proximal Ades enhancers (Ades2, Ades3–4, and Ades5) and Hox genes involve 3′ and middle Hox genes (Supplemental Figs. 4B, 5B). Chiron induction leads to a further 3′ restriction of these contacts to the 3′ subTAD (Supplemental Fig. S5B). Activation of HoxA transcription therefore leads to a further focalization of the already confined enhancer–3′Hox interactions occurring within the 3′ TAD. The situation is different for Ades6 that lies at an internal boundary of the 3′ subTAD and is less confined in its interactions, maintaining contacts with middle Hox genes on the one side and reaching the distal part of the 3′ subTAD on the other side (Fig. 2B; Supplemental Fig. S5B). The 3′ subTAD thus appears to be segmented into a proximal and a distal part (Fig. 2; Supplemental Fig. S5B). Seen from the Hox viewpoints, a relative loosening of the interactions of middle HoxA genes (Hoxa6 and Hoxa10) from their 5′ surrounding and a decrease in interactions of Hoxa13 with its 3′ surrounding are observed upon Wnt stimulation, demarcating a virtual boundary located between Hoxa10 and Hoxa13 (Fig. 2B; Supplemental Fig. S6). These data in uninduced and stimulated EpiSCs revealed that the HoxA locus and its 3′ TAD are segmented in different cis domains, which become more compact during Wnt activation. According to the preference of interactions, the HoxA cluster itself appears to be subdivided in three parts: 3′ genes (Hoxa1–4), middle HoxA genes on the overlap between the 3′ and 5′ TADs (Hoxa5–10/11), and Hoxa13 that belongs to the 5′ TAD (Fig. 2B).
Differential activation of Ades enhancers during development
The biological activity of the Ades putative enhancers was tested in vivo using lacZ reporters. Each of the five Ades regions appeared to exhibit transcription-enhancing activity that reproduces aspects of the spatiotemporal expression pattern of Hoxa1 between E6.5 and midgestation (Fig. 3A; Supplemental Fig. S7). Ades1 and Ades2 are active the earliest, perfectly mimicking the temporal and spatial features of Hoxa1 initial transcription in the posterior-most epiblast and extraembryonic mesoderm precursors of the nascent allantois (Fig. 3A, bottom row; Supplemental Fig. S7). Ades3–4 and Ades5 are active from more anterior positions of the primitive streak, excluding the posterior streak and extraembryonic mesoderm (Fig. 3A, bottom row). Ades6 drives a pattern restricted to a subset of tissues expressing endogenous Hoxa1, starting at a later time point than the other Ades regions (Fig. 3A). Thus, Ades1 and Ades2, which depend on Wnt for their activation, are the earliest active enhancers driving Hox expression.
Figure 3.

Activity and DNA accessibility of the Ades enhancers. (A, top row) Activity of Ades enhancers coupled to lacZ in E7.5 to E7.8 (head fold to early somite) embryos. (Right) Hoxa1 expression. (Bottom row) The earliest embryonic stage at which each enhancer is observed to be active (varying from E6.5 [before actual Hoxa1 expression] to E7.5). (Black curved line) Region of activity; (dotted line) boundary between embryonic (below the line) and extraembryonic (above the line) tissues. (B) ATAC-seq (assay for transposase-accessible chromatin [ATAC] with high-throughput sequencing) profile of EpiSCs (uninduced and after 48 h of Chiron activation) and in pre-Hox (E6.0), early Hox (E7.2), and later Hox (posterior tissues of E7.8) embryos in the Ades region. Bars, 100 µm.
To obtain information on the DNA accessibility of the different Ades enhancer chromatin in vivo and in EpiSCs, we performed ATAC-seq (assay for transposase-accessible chromatin [ATAC] with high-throughput sequencing) experiments (Buenrostro et al. 2013). Ades3–4, Ades5, and Ades6 are accessible in uninduced EpiSCs, whereas Ades1 and Ades2 are not yet opened in these conditions (Fig. 3B). Strikingly, Ades1 and Ades2 are accessible in Wnt-treated EpiSCs and in prestreak (E6.0) and older embryos (E7.2 and posterior part of early somite at E7.8) (Fig. 3B). Comparing the kinetics of chromatin opening of the strictly Wnt-dependent Ades1 and Ades2 enhancers in EpiSCs and embryos suggests that uninduced EpiSCs represent the naïve state of the Hox neighborhood (“preprimed” Hox state) and that the prestreak embryos, which already accumulated Wnt3 in their posterior region (Rivera-Perez and Magnuson 2005), are in a primed Hox state. These prestreak embryos have their HoxA cluster open already (Supplemental Fig. S8A, left panel). In embryos and EpiSCs that have started Hox expression, all Ades enhancers (Fig. 3B) and HoxA genes (Supplemental Fig. S8A) are accessible. Interestingly, the 5′ Hox TAD in E7.8 embryos displays accessible positions corresponding to limb-specific enhancers (Supplemental Fig. 8A, right panel; Berlivet et al. 2013; Lonfat et al. 2014). These 5′ regulatory regions never become open or acetylated upon Wnt exposure in EpiSCs, showing that the Wnt response is restricted to the 3′ side of the HoxA locus and that the gradual transcriptional activation is independent of the 5′ neighborhood (Supplemental Fig. S8B).
A proximal region in the 3′ subTAD is required for Wnt-induced Hox initiation
Our results obtained by H3K27ac ChIP-seq (chromatin immunoprecipitation [ChIP] combined with high-throughput sequencing) and ATAC-seq reveal that the HoxA 3′ subTAD contains Wnt-responsive enhancers. The developmentally early active enhancers Ades1 and Ades2 that depend on Wnt for their activation are located in the proximal part of the Ades region, whereas the enhancers already acetylated before Wnt exposure reside more distally. To directly test the functional significance of the proximal Wnt-dependent region for Hox gene activation, we engineered its CRISPR/Cas9-directed deletion. We excised a 39.8-kb region proximal to Hoxa1 in ESCs (Fig. 4; Supplemental Fig. S9A). After differentiation of the ESCs into EpiSCs and subsequent Wnt activation (Supplemental Fig. S9B), we measured transcript levels of Hoxa1 and its paralog, Hoxb1 (Fig. 4). We observed that deletion of the Wnt-dependent genomic interval leads to severely reduced Wnt responsiveness of Hoxa1 transcription. The proximal part of the HoxA 3′ subTAD therefore is crucial for the transcriptional response of the 3′ end of the HoxA cluster to incoming Wnt signals. Deletion of this region also caused a decrease in Wnt response of Hoxa5, whereas more 5′ genes Hoxa7 and Hoxa9 remain highly inducible (Supplemental Fig. S9C). Deletion of the Ades1–2 region thus compromises transcriptional activation of Hoxa1 and affects the sensitivity of more 5′ HoxA genes for Wnt signals. Some of the effects of the deletion on the expression of 5′ Hox genes may result from the reduction in the distance between these genes and distal Ades enhancers.
Figure 4.
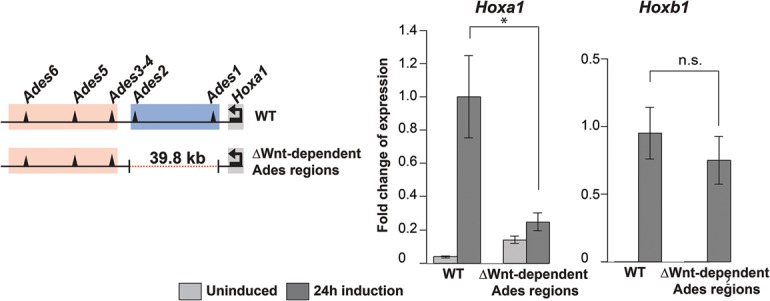
The most proximal region of the 3′ subTAD is required to activate Hoxa1. Deletion of the Wnt-dependent Ades1 and Ades2 region reduces Hoxa1 transcriptional response to Chiron (24 h); Hoxb1 is unaffected. Transcription measured by RT-qPCR is relative to the highest value of expression. Errors bars indicate ±SD. (*) P < 0.05.
In summary, we identified several layers of regulatory events that modify and activate the HoxA cluster neighborhood on its 3′ side (Fig. 5). On top of a tropism of interactions of the earliest HoxA genes with their segmented 3′ regulatory landscape, we found a bipartite activating regulatory module. A Wnt-dependent proximal cassette of enhancers (Ades1 and Ades2) responds to incoming Wnt signals in the posterior primitive streak region and initiates 3′ HoxA transcription. A more distal cassette (Ades3–4 to Ades6) consolidates gene expression via enhancers that are activated slightly later in development. These activating modules and early Wnt dependence are exclusively located at the 3′ side of the HoxA locus. We propose that it is the 3′ restriction of consecutive chromatin opening and enhancer activation in this 3′ HoxA region that dictates the first Hox transcription on the early side of the cluster in response to the earliest Wnt signal in the gastrulating embryo. Our data elucidate the molecular genetics underlying one of the most intriguing and evolutionarily conserved developmental systems: the spatiotemporally controlled turning on of the Hox genes when the body plan is laid down during early embryogenesis.
Figure 5.

Model summarizing the findings of distinct steps leading to transcriptional initiation of HoxA genes. Three successive phases of 3′-oriented epigenetic events culminate in 3′ Hox gene transcription. (1) Tropism of contacts between 3′ HoxA and the 3′ surrounding in ESCs (Hox ground state) and its compaction to the 3′ subTAD in EpiSCs (preprimed Hox state). (2) Accessibility of Wnt-dependent proximal elements (open triangles) in the proximal 3′ subTAD appears between uninduced EpiSCs and E6.0 embryos. (3) Acetylation of these enhancers and 3′ HoxA transcription arise at E7.2. At that stage, all enhancers are acetylated. More 5′ HoxA genes are subsequently expressed (E7.8).
Material and methods
Animals
All mice used were in the C57Bl6j/CBA mixed background. Heterozygous Wnt3 mutants were generated by intercross of a Wnt3 conditional strain (Barrow et al. 2003) with Sox2Cre mice (Hayashi et al. 2002). Ear clip DNA was used for genotyping (primers in Supplemental Table S2). All animal experiments were performed in accordance with institutional and national regulations under control of the Central Animal Experiments Committee.
Embryo culture
E6.0 embryos were isolated in M2 medium (Sigma Aldrich) and cultured in four-well plates (Nunc, ThermoFisher Scientific) for 10 h in medium containing 75% knockout serum replacement (KOSR), 25% DMEM/F12, 1% nonessential amino acids (NEAAs), and 2 mM L-glutamine (all ThermoFisher) in the presence of 20 µM CHIR99021 (“Chiron”; Cell Guidance Systems) in DMSO or DMSO only.
In situ hybridization (ISH)
ISH was performed as described elsewhere (Young et al. 2009). A Hoxa1 probe was generated from a 1.2-kb insert transcribed by T7 polymerase (Promega). The Hoxb1 probe was described elsewhere (Marshall et al. 1994). For each experiment, n > 3 embryos were used.
EpiSC culture and Hox induction
E6.0 embryos were isolated in M2 medium; extraembryonic tissue and primitive endoderm were removed. Explants were cultured on mitotically inactivated mouse embryonic fibroblasts (MEFs) in medium containing 20% KOSR, 77% DMEM/F12, 100 U/mL 1× penicillin/streptomycin (pen/strep), 2 mM L-glutamine, 1× NEAAs, 0.01% β-mercaptoethanol (β-ME), 12 ng/mL Fgf basic (ThermoFisher), 20 ng/mL Activin A (R&D Systems), and 2 µM Wnt inhibitor IWP2 (Sigma Aldrich) in DMSO. Wnt3-null EpiSCs were genotyped once cultured free of MEFs. MEF-free culture took place on a surface coated by fibronectin (ThermoFisher) in medium containing 48% DMEM/F12, 48% neurobasal medium, 1% B27 supplement, 0.5% N2 supplement B (all ThermoFisher), 1× pen/strep, 12 ng/mL Fgf basic, 20 ng/mL Activin A, 2 µM IWP2, and 0.01% β-ME. Medium was refreshed on a daily basis. Cells were tested for mycoplasma contamination. Wnt stimulation was performed after at least two passages of feeder-free culturing by withdrawal of IWP2 and addition of 3 µM Chiron.
RT-qPCR
RNA was isolated by combining Trizol (ThermoFisher) extraction followed by on-column (RNAeasy purification kit, Qiagen) DNase I (Promega) treatment. One microgram of total RNA was used for reverse transcription by SuperScript II (ThermoFisher) using oligo dTs (Promega). qPCR was performed on 1:10 (Hox genes) or 1:100 (reference gene Ppia) cDNA dilutions. Primer sequences are in Supplemental Table S3. The reference gene was verified to be expressed constantly and to not respond to Wnt. Two microliters or 3 µL of diluted cDNA, 50 nM primers, and SYBR Green master mix (Bio-Rad) were used in 20-µL reactions. Measurements were done on a CFX Connect real-time PCR detection system (Bio-Rad). Two to three biological and three technical replicates were used. For analysis, the 2−ΔΔCt method (Livak and Schmittgen 2001) was used. Comparison between samples was performed using Student's t-test.
ChIP-seq
ChIP was performed on 10 million feeder-free EpiSCs. Cells were cross-linked (1% formaldehyde) for 10 min. Cross-linking was stopped by glycine (125 mM end concentration). Nuclei were isolated in lysis buffer 1 (50 mM HEPES, 140 mM NaCl, 1 mM EDTA, 10% glycerol, 0.5% IGEPAL [Sigma Aldrich], 0.25% Triton X-100 [Sigma Aldrich], 1 mM PMSF, 1× PIC [Roche]) for 10 min on ice. Nuclei were lysed with lysis buffer 2 (1% SDS, 50 mM Tris at pH 8.0, 10 mM EDTA, 1 mM PMSF, 1× PIC) on ice. Samples were sonicated on a Diagenode Bioruptor twice for 20 cycles (30 sec on/off at high power) at 4°C. Samples were rotated overnight at 4°C with 5 µg of the appropriate antibody: H3K4me3 (Abcam, ab8580), H3K27ac (Abcam, ab4729), H3K27me3 (Millipore, 17-622), or Ring1b (ActiveMotif, 39663). The next day, prewashed Dynabeads protein G beads (ThermoFisher) were added. After 4 h, beads were washed with HEPES buffer (20 mM HEPES, 1 mM EDTA, 0.5% IGEPAL, 150 mM NaCl, 1 mM PMSF, 1× PIC), LiCl buffer (250 mM LiCl, 1% IGEPAL, 1% sodium deoxycholate, 1 mM EDTA, 10 mM Tris at pH 8.0, 1 mM PMSF, 1× PIC), and TE containing 1 mM PMSF and 1× PIC at 4°C. The bound complexes were eluted in elution buffer (1% SDS, 100 mM NaHCO3) and decross-linked overnight. The next day, RNase A (30 min at 37°C) and Proteinase K (3 h at 55°C) treatments followed. DNA was extracted by phenol/chloroform. Concentration and quality were checked by Qubit (ThermoFisher) and Bioanalyzer (Agilent), respectively. Ten nanograms of DNA was used for the TruSeq DNA sample preparation kit (Illumina). Samples were run by the Massachusetts Institute of Technology BioMicro Center (Cambridge, MA) or the Utrecht Sequencing Facility (USF; Utrecht, the Netherlands) on an Illumina HiSeq2000.
4C-seq
4C-seq was performed on 5 million to 10 million feeder-fee EpiSCs or ESCs according to published protocols (Splinter et al. 2012). A first digest was performed with DpnII (New England Biolabs); a second digest was performed with Csp6I (ThermoFisher). PCR primers were designed using guidelines described previously (Splinter et al. 2012) and are listed in Supplemental Table S4. Samples were run by the USF on an Illumina NextSeq500. After mapping on a reduced mm9 genome (van de Werken et al. 2012), the highest covered fragment was removed, and the data set was normalized to 1 million intrachromosomal reads.
LacZ reporter assays
Ades enhancers were cloned upstream of a minimal Hsp68 promoter (Pennacchio et al. 2006). Primers are in Supplemental Table S5. The vector was linearized for microinjection. DNA concentration was filtered on a 0.45-µm column (Millipore), diluted to 2 ng/µL, and refiltered on a 0.22-µm column (Millipore) (Ittner and Gotz 2007). Embryos were harvested between E6.5 and E9.5 and fixed in 1% formaldehyde and 0.2% glutaraldehyde. Staining took place in PBS containing 1 mg/mL X-gal (ThermoFisher), 5 mM C6N6FeK3, 5 mM C6N6FeK4, 2 mM MgCl2, and 0.02% IGEPAL. For each construct, n > 5 positively stained embryos were analyzed. Embryos were genotyped by the primers listed in Supplemental Table S2.
CRISPR/Cas9-directed genomic deletion
Mouse ESCs (129/Ola-derived IB10) were cultured on MEFs in G-MEM containing 10% FCS, 1× glutamax, 1 mM sodium pyruvate, 1× NEAAs, 0.01% β-ME (all ThermoFisher), and 10 ng/mL LIF (Millipore). Synthetic guide RNA (sgRNA) sequences were designed using http://crispr.mit.edu (see Supplemental Table S6) and cloned into pX330 (Cong et al. 2013). A puromycin resistance vector was cotransfected with the pX330 plasmids using Lipofectamine 3000 (ThermoFisher). Transfection took place in feeder-free conditions in medium conditioned on buffalo rat liver (BRL) cells (60%) and supplemented with LIF and β-ME. Cells were selected for 48 h with 2 µg/mL puromycin. ESCs were replated, and, after 3–4 d, at least 24 colonies were picked. Cells were passaged, frozen, and genotyped. Primers are in Supplemental Table S2. Positive clones were cultured and differentiated to EpiSCs by culturing them in EpiSC medium (including IWP2) for 3 wk on MEFs.
ATAC-seq
ATAC-seq was performed according to the standard protocol (Buenrostro et al. 2013) on 50,000 EpiSCs and on embryos (E6.0, E7.2, posterior parts of E7.8). Embryos were treated with collagenase for 30 min at 37°C, and cells were suspended by mild pipetting. The numbers of embryos used per assay were as follows: 25 for E6.0, five for E7.2, and seven posterior parts for E7.8. Nuclei were lysed and subjected to Tn5 transposase (Illumina), and DNA was isolated by MinElute columns (Qiagen). After PCR (maximum of nine cycles), tagmented DNA was purified using 1.6× vol AmpureBeads (Betancourt). Concentration and quality were checked by Qubit and Bioanalyzer, respectively. Samples were paired-end-sequenced (Illumina, NextSeq500) by the USF.
All sequencing data are available under Gene Expression Omnibus accession number GSE81203.
Supplementary Material
Acknowledgments
We thank S. van den Brink for help with ESCs, and J. Korving for microinjection. We are thankful to C. Vermeulen, G. Geeven, and A. Melquiond (laboratory of W.d.L.) for their help on 4C-seq. We are grateful to M. Vermunt and C. Wiggers (laboratory of M.P.C.) for their advice on ChIP-seq and ATAC-seq. T. Young generated the Hoxa1 probe. We thank D. Duboule and J. Zakany for providing the pX330 vector. We thank S. Simmini for reading the manuscript. This work was supported by the Netherlands Institute for Regenerative Medicine (NIRM; grant FES0908). J.D. and R.N. conceived the study. R.N., S.A., and C.v.R. performed experiments. S.T. performed analyses on ChIP-seq and ATAC-seq. M.P.C. and W.d.L. provided expert advice on parts of the experiments. R.N. and J.D. wrote the manuscript.
Footnotes
Supplemental material is available for this article.
Article published online ahead of print. Article and publication date are online at http://www.genesdev.org/cgi/doi/10.1101/gad.285767.116.
Freely available online through the Genes & Development Open Access option.
References
- Barrow JR, Thomas KR, Boussadia-Zahui O, Moore R, Kemler R, Capecchi MR, McMahon AP. 2003. Ectodermal Wnt3/β-catenin signaling is required for the establishment and maintenance of the apical ectodermal ridge. Genes Dev 17: 394–409. [DOI] [PMC free article] [PubMed] [Google Scholar]
- Berlivet S, Paquette D, Dumouchel A, Langlais D, Dostie J, Kmita M. 2013. Clustering of tissue-specific sub-TADs accompanies the regulation of HoxA genes in developing limbs. PLoS Genet 9: e1004018. [DOI] [PMC free article] [PubMed] [Google Scholar]
- Brons IG, Smithers LE, Trotter MW, Rugg-Gunn P, Sun B, Chuva de Sousa Lopes SM, Howlett SK, Clarkson A, Ahrlund-Richter L, Pedersen RA, et al. 2007. Derivation of pluripotent epiblast stem cells from mammalian embryos. Nature 448: 191–195. [DOI] [PubMed] [Google Scholar]
- Buenrostro JD, Giresi PG, Zaba LC, Chang HY, Greenleaf WJ. 2013. Transposition of native chromatin for fast and sensitive epigenomic profiling of open chromatin, DNA-binding proteins and nucleosome position. Nat Methods 10: 1213–1218. [DOI] [PMC free article] [PubMed] [Google Scholar]
- Cong L, Ran FA, Cox D, Lin S, Barretto R, Habib N, Hsu PD, Wu X, Jiang W, Marraffini LA, et al. 2013. Multiplex genome engineering using CRISPR/Cas systems. Science 339: 819–823. [DOI] [PMC free article] [PubMed] [Google Scholar]
- De Kumar B, Parrish ME, Slaughter BD, Unruh JR, Gogol M, Seidel C, Paulson A, Li H, Gaudenz K, Peak A, et al. 2015. Analysis of dynamic changes in retinoid-induced transcription and epigenetic profiles of murine Hox clusters in ES cells. Genome Res 25: 1229–1243. [DOI] [PMC free article] [PubMed] [Google Scholar]
- de Laat W, Duboule D. 2013. Topology of mammalian developmental enhancers and their regulatory landscapes. Nature 502: 499–506. [DOI] [PubMed] [Google Scholar]
- Deschamps J, van Nes J. 2005. Developmental regulation of the Hox genes during axial morphogenesis in the mouse. Development 132: 2931–2942. [DOI] [PubMed] [Google Scholar]
- Dixon JR, Selvaraj S, Yue F, Kim A, Li Y, Shen Y, Hu M, Liu JS, Ren B. 2012. Topological domains in mammalian genomes identified by analysis of chromatin interactions. Nature 485: 376–380. [DOI] [PMC free article] [PubMed] [Google Scholar]
- Forlani S, Lawson KA, Deschamps J. 2003. Acquisition of Hox codes during gastrulation and axial elongation in the mouse embryo. Development 130: 3807–3819. [DOI] [PubMed] [Google Scholar]
- Frasch M, Chen X, Lufkin T. 1995. Evolutionary-conserved enhancers direct region-specific expression of the murine Hoxa-1 and Hoxa-2 loci in both mice and Drosophila. Development 121: 957–974. [DOI] [PubMed] [Google Scholar]
- Hayashi S, Lewis P, Pevny L, McMahon AP. 2002. Efficient gene modulation in mouse epiblast using a Sox2Cre transgenic mouse strain. Mech Dev 119: S97–S101. [DOI] [PubMed] [Google Scholar]
- Ittner LM, Gotz J. 2007. Pronuclear injection for the production of transgenic mice. Nat Protoc 2: 1206–1215. [DOI] [PubMed] [Google Scholar]
- Izpisua-Belmonte JC, Falkenstein H, Dolle P, Renucci A, Duboule D. 1991. Murine genes related to the Drosophila AbdB homeotic genes are sequentially expressed during development of the posterior part of the body. EMBO J 10: 2279–2289. [DOI] [PMC free article] [PubMed] [Google Scholar]
- Kmita M, Duboule D. 2003. Organizing axes in time and space; 25 years of colinear tinkering. Science 301: 331–333. [DOI] [PubMed] [Google Scholar]
- Kojima Y, Kaufman-Francis K, Studdert JB, Steiner KA, Power MD, Loebel DA, Jones V, Hor A, de Alencastro G, Logan GJ, et al. 2014. The transcriptional and functional properties of mouse epiblast stem cells resemble the anterior primitive streak. Cell Stem Cell 14: 107–120. [DOI] [PubMed] [Google Scholar]
- Liu P, Wakamiya M, Shea MJ, Albrecht U, Behringer RR, Bradley A. 1999. Requirement for Wnt3 in vertebrate axis formation. Nat Genet 22: 361–365. [DOI] [PubMed] [Google Scholar]
- Livak KJ, Schmittgen TD. 2001. Analysis of relative gene expression data using real-time quantitative PCR and the 2−ΔΔCT method. Methods 25: 402–408. [DOI] [PubMed] [Google Scholar]
- Lonfat N, Montavon T, Darbellay F, Gitto S, Duboule D. 2014. Convergent evolution of complex regulatory landscapes and pleiotropy at Hox loci. Science 346: 1004–1006. [DOI] [PubMed] [Google Scholar]
- Marshall H, Studer M, Popperl H, Aparicio S, Kuroiwa A, Brenner S, Krumlauf R. 1994. A conserved retinoic acid response element required for early expression of the homeobox gene Hoxb-1. Nature 370: 567–571. [DOI] [PubMed] [Google Scholar]
- Nolte C, Jinks T, Wang X, Martinez Pastor MT, Krumlauf R. 2013. Shadow enhancers flanking the HoxB cluster direct dynamic Hox expression in early heart and endoderm development. Dev Biol 383: 158–173. [DOI] [PubMed] [Google Scholar]
- Pennacchio LA, Ahituv N, Moses AM, Prabhakar S, Nobrega MA, Shoukry M, Minovitsky S, Dubchak I, Holt A, Lewis KD, et al. 2006. In vivo enhancer analysis of human conserved non-coding sequences. Nature 444: 499–502. [DOI] [PubMed] [Google Scholar]
- Rivera-Perez JA, Magnuson T. 2005. Primitive streak formation in mice is preceded by localized activation of Brachyury and Wnt3. Dev Biol 288: 363–371. [DOI] [PubMed] [Google Scholar]
- Soshnikova N, Duboule D. 2009. Epigenetic temporal control of mouse Hox genes in vivo. Science 324: 1320–1323. [DOI] [PubMed] [Google Scholar]
- Splinter E, de Wit E, van de Werken HJ, Klous P, de Laat W. 2012. Determining long-range chromatin interactions for selected genomic sites using 4C-seq technology: from fixation to computation. Methods 58: 221–230. [DOI] [PubMed] [Google Scholar]
- Tesar PJ, Chenoweth JG, Brook FA, Davies TJ, Evans EP, Mack DL, Gardner RL, McKay RD. 2007. New cell lines from mouse epiblast share defining features with human embryonic stem cells. Nature 448: 196–199. [DOI] [PubMed] [Google Scholar]
- Tsakiridis A, Huang Y, Blin G, Skylaki S, Wymeersch F, Osorno R, Economou C, Karagianni E, Zhao S, Lowell S, et al. 2015. Distinct Wnt-driven primitive streak-like populations reflect in vivo lineage precursors. Development 142: 809. [DOI] [PMC free article] [PubMed] [Google Scholar]
- van de Werken HJ, Landan G, Holwerda SJ, Hoichman M, Klous P, Chachik R, Splinter E, Valdes-Quezada C, Oz Y, Bouwman BA, et al. 2012. Robust 4C-seq data analysis to screen for regulatory DNA interactions. Nat Methods 9: 969–972. [DOI] [PubMed] [Google Scholar]
- Young T, Rowland JE, van de Ven C, Bialecka M, Novoa A, Carapuco M, van Nes J, de Graaff W, Duluc I, Freund JN, et al. 2009. Cdx and Hox genes differentially regulate posterior axial growth in mammalian embryos. Dev Cell 17: 516–526. [DOI] [PubMed] [Google Scholar]
- Zhang X, Peterson KA, Liu XS, McMahon AP, Ohba S. 2013. Gene regulatory networks mediating canonical Wnt signal-directed control of pluripotency and differentiation in embryo stem cells. Stem Cells 31: 2667–2679. [DOI] [PMC free article] [PubMed] [Google Scholar]
Associated Data
This section collects any data citations, data availability statements, or supplementary materials included in this article.