Abstract
Studies on aortic arch calcification (AAC) and mortality risk in maintenance dialysis patients have yielded conflicting findings. We conducted this meta-analysis to investigate the association between the presence of AAC and cardiovascular or all-cause and mortality risk in maintenance dialysis patients. Observational studies evaluating baseline AAC and cardiovascular or all-cause mortality risk in maintenance dialysis patients were searched through the PubMed and Embase, CNKI, VIP and Wanfang databases until January 2016. A total of 8 studies with 3,256 dialysis patients were identified. Compared with patients without AAC, the presence of AAC was associated with greater risk of cardiovascular mortality (hazard risk [HR] 2.30; 95% confidence intervals [CI] 1.78–2.97) and all-cause mortality (HR 1.44; 95% CI 1.19–1.75). Subgroup analyses indicated that the pooled HR for cardiovascular and all-cause mortality was 2.31 (95% CI 1.57–3.40) and 1.45 (95% CI 1.08–1.96) for the grade 2/3 AAC. Peritoneal dialysis patients with AAC had greater cardiovascular (HR 3.93 vs. HR 2.10) and all-cause mortality (HR 2.36 vs. HR 1.33) than hemodialysis patients. The AAC appears to be independently associated with excessive cardiovascular and all-cause mortality in maintenance dialysis patients. Regular follow-up AAC might be helpful to stratify mortality risk in dialysis patients.
Cardiovascular disease is the most common causes of death in patients with end-stage kidney disease who are undergoing maintenance dialysis. Vascular calcification is very frequent finding in the dialysis patients1,2. Vascular calcification in the aorta and coronary arteries have been recognized as an important risk factor for adverse outcomes in dialysis patients1.
Chest radiography is a routine screening test performing on dialysis patients. Aortic arch calcification (AAC) measurement by the chest radiography was strongly associated with cardiovascular events in the general population2,3. AAC predicted the renal function decline in patients with stage 3 to 5 chronic kidney diseases4. In dialysis patients, the presence of AAC was significantly associated with increased risk of mortality5,6,7,8. However, data derived from chest radiography analysis on the presence or grade of AAC and cardiovascular or all-cause mortality in dialysis patients remain controversial5,6,7,9,10. In addition, the magnitude of risk estimates varied obviously across studies. The discrepancy may be correlated with differences in patient characteristics and calcification.
We therefore conducted a meta-analysis of the available observational studies to determine the presence and severity of AAC and cardiovascular or all-cause mortality in dialysis patients.
Results
Selected studies and characteristics
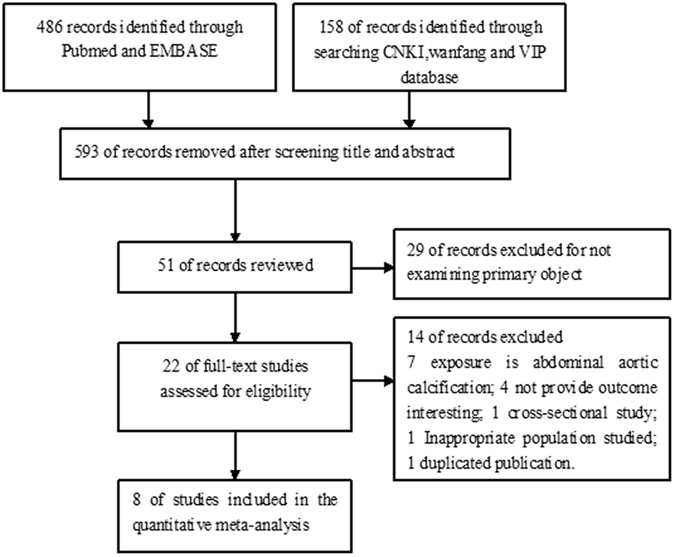
We initially retrieved 644 studies through electronic searches. After scanning the title and abstract, 593 articles were removed mainly because they were reviews, meeting abstract or not relevant outcomes reported. After applying our predefined inclusion criteria, 43 studies were removed mainly due to they did not provide outcome interesting or exposures were abdominal aortic calcification. Finally, eight studies5,6,7,8,9,10,11,12 satisfied the inclusion criteria, providing data on 3,256 dialysis patients. Flow chart of study selection process is detailed in Fig. 1.
Figure 1. Flow chart of the study selection process.

Table 1 summarizes the baseline characteristics of the included studies. The included studies were published from 2010 to 2015. The follow-up duration ranged from 1.8 to 10 years. Five studies5,6,8,9,11 were prospective design and three studies7,10,12 were retrospective design. Among the 8 studies, 2 articles10,12 were conducted in America and 6 articles5,6,7,8,9,11 in Asia. All the studies determined the AAC using plain chest X-rays image. The prevalence of AAC in dialysis patients varied from 40.7% to 58%. All the included studies reported all-cause mortality as the outcome and six studies reported cardiovascular mortality. On the basis of NOS for cohort studies, the NOS scores of the included studies ranged from 5 to 8 stars.
Table 1. Baseline characteristics of the included studies.
| Study/year | Region | Design | Patients (%women) | Age (years) | Detection Methods | Prevalence of AAC | Comparison of AAC | Events NumberRR or HR (95% CI) | Follow-up (years) | Adjustment for Covariates | NOS |
|---|---|---|---|---|---|---|---|---|---|---|---|
| Ogawa et al.9 | Japan | Prospective study | HD 401 (32.7) | 58 ± 13 (CAC); 65 ± 11 (no CAC) | Plain chest radiography | 50.6% | Presence vs. absence | Cardiovascular death (41) 2.56 (1.01–6.49) Total death (72) 0.67(0.39–1.16) | 4 | Age, DB, BMI, DBP, hemoglobin, serum albumin, Kt/V level, and creatinine | 5 |
| Lee et al.8 | Korea | Prospective study | PD 415 (43.7) | 55.8 ± 13.8 | Posterior- anterior plain chest X-rays | 40.7% | Presence vs. absence | Cardiovascular death (39) 3.58 (1.58–8.13) Total death (90) 2.18(1.34–3.56) | 2.85 | Age, DB, previous CVD, lipid-lowering medication, calcium phosphorus products, Hs-CRP and albumin | 7 |
| Liu et al.11 | China | Prospective study | HD 333 (46.5) | 52 ± 14 | Plain chest radiography | Not provided | Presence vs. absence | Cardiovascular death (59) 2.14(1.15–3.98) Total death (105) 1.28(1.11–1.47) | 4.2 | Age, gender, dialytic vintage, dialysis modality, DB, blood pressure, hemoglobin, ferritin, CRP and LVMI. | 6 |
| Abdelmalek et al.12 | USA | Retrospective study | HD 93 (3) | 66 ± 11(CAC); 63 ± 10 (no CAC) | Frontal and lateral chest radiograph | 58%, | Presence vs. absence | Total death (26) 6.23(1.64–23.66) | 1.8 | Age, CAD, pre-dialysis creatinine, phosphorus, DB, hyperlipidemia and CAC. | 6 |
| Bohn et al.10 | Canada | Retrospective cohort study | HD 824(46) | 59.7 | Postero-anterior X-ray | 46% | Gr. vs. absence | Total death (152) 1.52(0.99–2.34) Gr. 1 1.22(0.72–2.05) Gr. 2 2.49(1.28–4.82) Gr. 3 | 3 | Age at x-ray, race, sex, duration of dialysis, DB, history of heart failure, IHD, serum phosphate and creatinine at initiation of dialysis. | 6 |
| Komatsu et al.6 | Japan | Prospective study | HD 301 (34) | 63.8 ± 12.2 | Chest X-rays | 41.9% | Gr. vs. absence | Cardiovascular death (43) 1.73 (0.62–5.62) Gr. 1 2.63 (1.46–5.12) Gr. 2 + 3 Total death (65) 1.23(0.56–2.85) Gr. 1 1.70(1.05–2.68) Gr. 2 + 3 | 3 | Age, DB, serum albumin, non-HDL TC, hypertension, prescription of active vitamin D3 | 7 |
| Lee et al.5 | Taiwan | Prospective study | HD 712 (57.0) | 55.6 ± 14.3 | X-ray films | 57% | Gr. vs. absence | Cardiovascular death (87) 1.75(0.88–3.49) Gr. 1 1.44 (0.68–3.03) Gr. 2 2.50(1.24–5.04) Gr. 3 Total death (231) 1.17(0.78–1.78) Gr. 1 0.94(0.60–1.46) Gr. 2 1.60(1.06–2.43) Gr. 3 | 10 | Age, DB, cardiothoracic ratio, albumin, creatinine, non-fasting glucose, phosphorus, calcium phosphorus product, TC, intact parathyroid hormone, alkaline phosphatase | 8 |
| Hong et al.7 | China | Retrospective cohort study | HD 177 (41.8) | 62.86 ± 14.33 | Chest X-rays | 37.29% | Gr. vs. absence | Cardiovascular death (18) 3.86 (0.74–20.2) Gr. 1 5.64 (1.17–27.07) Gr. 2 + 3 Total death (25) 2.26(0.63–8.14) Gr. 1 3.78(1.18–12.09) Gr. 2 + 3 | 2 | Age, BMI, albumin, hemoglobin, HDL,LDL, serum phosphate, serum calcium, calcium phosphorus products, and residual renal function | 5 |
Abbreviations: AAC, aortic arch calcification; DB, diabetes; RR, risk ratio; HR, hazard ratio; Gr, grade; NOS, Newcastle–Ottawa Scale; PD, peritoneal dialysis; BMI, body mass index; CAC, coronary artery calcification; CVD, cardiovascular disease; CAD, coronary artery disease; TC,total cholesterol; CRP,C-reactive protein; LVMI, left ventricular mass index; HDL, high-density lipoprotein; DBP, diastolic blood pressure; Hs-CRP, high sensitivity C-reactive protein.
All-cause and cardiovascular mortality
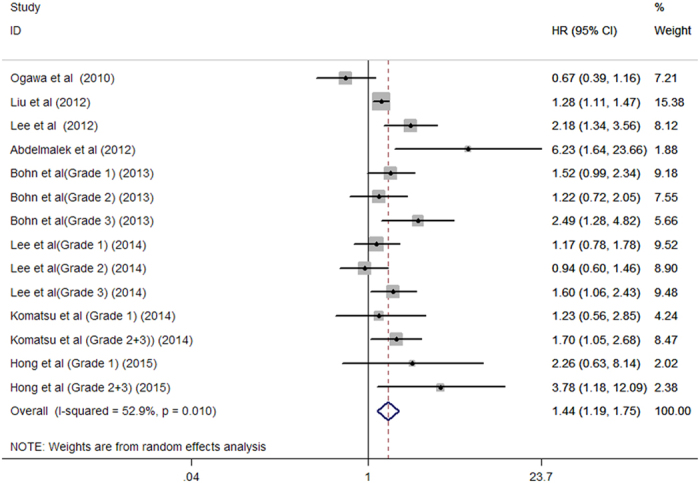
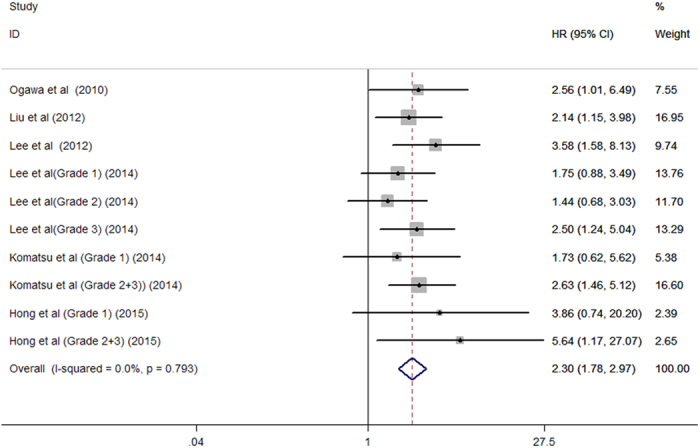
A total of 766 all-cause mortality cases were reported in eight studies5,6,7,8,9,10,11,12 among 3,256 dialysis patients. As shown in Fig. 2, the presence of AAC was associated with 44% greater risk of all-cause mortality (HR 1.44; 95% CI 1.19–1.75; I2 = 52.9%; P = 0.010) in a random effect model. A total of 287 cardiovascular mortality cases were reported in six studies5,6,7,8,9,11 among 2,339 dialysis patients. As shown in Fig. 3, the presence of AAC was associated with 1.30 folds greater risk of cardiovascular mortality (HR 2.30; 95% CI 1.78–2.97; I2 = 0.0%; P = 0.793) in a fixed-effect model.
Figure 2. Forest plots showing HR and 95% CI of all-cause mortality compared with and without aortic arch calcification in a random effect model.

Figure 3. Forest plots showing HR and 95% CI of cardiovascular mortality compared with and without aortic arch calcification in a fixed-effect model.

Subgroup analyses and sensitivity analyses
Subgroup analyses based on study design, region, patient population sample sizes, grade of AAC, and follow-up duration showed similar results across all the analyses (Table 2). Sensitivity analyses by excluding any single study at each turn indicated that there were no changes in the direction of pooling risk estimate of all-cause mortality (pooled HR ranges from 1.39 to 1.57) and cardiovascular mortality (pooled HR ranges from 2.19 to 2.63).
Table 2. Subgroup analyses of all-cause and cardiovascular mortality.
| Subgroups | Number of studies | Pooled hazard risk | 95% confidence interval | Heterogeneity between studies |
|---|---|---|---|---|
| 1. All-cause mortality | ||||
| Study design | ||||
| Prospective study | 5 | 1.29 | 1.05 to 1.59 | P = 0.042; I2 = 51.8% |
| Retrospective study | 3 | 1.99 | 1.33 to 2.99 | P = 0.125; I2 = 42.1% |
| Region | ||||
| Asia | 6 | 1.35 | 1.09 to 1.67 | P = 0.030; I2 = 51.4% |
| America | 2 | 1.85 | 1.15 to 2.98 | P = 0.082; I2 = 55.2% |
| Patient population | ||||
| Hemodialysis | 6 | 1.33 | 1.10 to 1.62 | P = 0.031; I2 = 49.5% |
| Peritoneal dialysis | 2 | 2.36 | 1.54 to 3.60 | P = 0.692; I2 = 0.0% |
| Sample sizes | ||||
| >500 | 2 | 1.36 | 1.08 to 1.72 | P = 0.195; I2 = 32.1% |
| <500 | 6 | 1.59 | 1.13 to 2.26 | P = 0.005; I2 = 65.4% |
| Follow-up duration | ||||
| ≥4 years | 3 | 1.23 | 1.09 to 1.38 | P = 0.088; I2 = 50.5% |
| <4 years | 5 | 1.78 | 1.45 to 2.19 | P = 0.256; I2 = 21.0% |
| Grade of AAC | ||||
| Grade 1 | 4 | 1.35 | 1.03 to 1.77 | P = 0.669; I2 = 0.0% |
| Grade 2 + 3 | 4 | 1.55 | 1.13 to 2.12 | P = 0.079; I2 = 49.3% |
| 2. Cardiovascular mortality | ||||
| Study design | ||||
| Prospective study | 5 | 2.22 | 1.70 to 2.88 | P = 0.809; I2 = 0.0% |
| Retrospective study | 1 | 4.71 | 1.51 to 14.71 | P = 0.744; I2 = 0.0% |
| Region | ||||
| Asia | 4 | 2.25 | 1.66 to 3.06 | P = 0.550; I2 = 0.0% |
| America | 2 | 2.42 | 1.51 to 3.87 | P = 0.803; I2 = 0.0% |
| Patient population | ||||
| Hemodialysis | 4 | 2.10 | 1.59 to 2.77 | P = 0.893; I2 = 0.0% |
| Peritoneal dialysis | 2 | 3.93 | 2.02 to 7.64 | P = 0.881; I2 = 0.0% |
| Sample sizes | ||||
| >500 | 1 | 1.86 | 1.24 to 2.81 | P = 0.559; I2 = 0.0% |
| <500 | 5 | 2.63 | 1.90 to 3.65 | P = 0.853; I2 = 0.0% |
| Follow-up duration | ||||
| ≥4 years | 3 | 2.01 | 1.46 to 2.77 | P = 0.8105; I2 = 0.0% |
| <4 years | 3 | 2.91 | 1.91 to 4.43 | P = 0.814; I2 = 0.0% |
| Grade of AAC | ||||
| Grade 1 | 3 | 1.91 | 1.10 to 3.30 | P = 0.674; I2 = 0.0% |
| Grade 2 + 3 | 3 | 2.31 | 1.57 to 3.40 | P = 0.393; I2 = 0.0% |
AAC, aortic arch calcification.
Publication bias
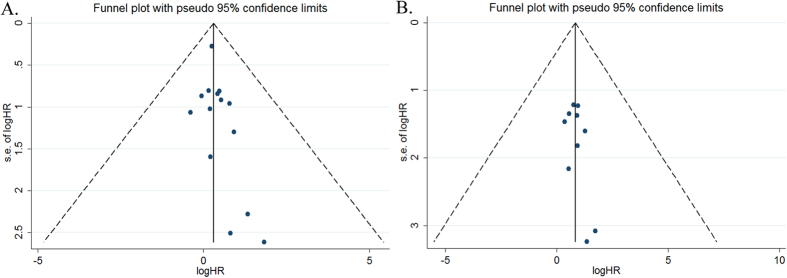
Evidences of publication bias for all-cause mortality were not observed based on the funnel plot (Fig. 4A), Begg’s rank correlation test (P = 0.101), and Egger’s linear regression test (P = 0.134). There were also no evidences of publication bias for cardiovascular mortality according to the funnel plot (Fig. 4B), Begg’s rank correlation test (P = 0.371) and Egger’s linear regression test (P = 0.207).
Figure 4.
Funnel plot showing publication bias based on the all-cause mortality (A) and cardiovascular mortality (B).
Discussion
The present meta-analysis provided evidences that the presence of AAC significantly increased the risk of all-cause mortality by 44% and cardiovascular mortality by 130% in dialysis patients. To the best of our knowledge, this is the first meta-analysis to investigate the relationship between the presence and severity of AAC and risk of cardiovascular and all-cause mortality in dialysis patients. Given AAC is easily determined by chest X-ray in clinical practice, regular follow-up AAC might be a simple and helpful method to stratify the mortality risk in dialysis patients.
Subgroup analysis revealed that the statistical significance of an association with mortality was more obvious in patients with grade 2 and 3 AAC. This finding supports a higher degree of AAC corresponds to a greater mortality risk. In addition, the presence of AAC in peritoneal dialysis patients appeared to have a greater mortality risk than those undergoing hemodialysis patients. Moreover, progression of AAC over one year was also an independent predictor of cardiovascular and all-cause mortality in incident peritoneal dialysis patients8.
Approximately 20–30% of people older than 65 years had calcification in the aorta2. In dialysis patients, the prevalence of AAC ranged from 37.29% to 58% based on the chest X-ray findings7,12. The high prevalence of AAC in dialysis patients indicates the importance to early detect the presence and progression of AAC. Several potential explanations may explain the presence and progression of AAC and mortality risk. AAC represented the magnitude of whole aortic calcification in the general population and dialysis patients13,14. The extent of AAC may be correlated to the degree of atherosclerosis. Calcification can increase stiffness and reduce elasticity of large arteries, resulting in substantial mortality15.
Our meta-analysis had several limitations. First, the most important concern is the sensitivity for detecting AAC in chest X-ray. Compared with plain X-ray, multi-detector computed tomography or electron beam-computed tomography are the gold standard for evaluating AAC, with the power of detecting small amounts of calcification. However, these examinations are too expensive to perform in all the dialysis patients. AAC assessed by a chest X-ray may underestimate the true calcium deposition in the aortic wall. Second, most dialysis patients in our analysis were adult and elder with a trend of acceleration of vascular calcification. Thus, predictive values of AAC on mortality risk cannot be extrapolated to relatively younger dialysis patients. Third, the included studies did not adjust covariates in a consistent way, lacking adjustment for these covariates may have led to a slight overestimation of the risk estimate. Finally, Despite we made a comprehensive literature search, there were very few studies included in this meta-analysis.The conclusion based on the limited number of study may be not robust, particularly in the subgroup analyses.
In conclusion, this meta-analysis indicates that AAC appears to be independently associated with greater risk of cardiovascular and all-cause mortality, and higher grade of AAC corresponds to a greater risk in dialysis patients. Our finding support incorporation of AAC into the existing risk factors for dialysis patients may improve the prognostic stratification. However, more well-designed prospective studies are need to confirm our findings because there were very few studies being included in the meta-analysis.
Methods
Search strategy
This meta-analysis was performed in accordance with the recommendations of the Preferred Reporting Items for Systematic Reviews and Meta-analyses Statement16 An extensive electronic database search was conducted in PubMed, Embase, China National Knowledge Infrastructure, VIP and Wanfang databases up to January 2016. The following search terms were used: ‘hemodialysis’ OR ‘haemodialysis’ OR ‘peritoneal dialysis’ OR ‘end stage renal disease’ AND ‘aortic calcification’ OR ‘aortic arch’ AND ‘calcification’ OR ‘calcium’ AND ‘mortality’ OR ‘death’ AND ‘follow-up’ OR ‘longitudinal’. Additionally, the reference lists of the selected papers were manually searched for additional possible studies.
Selection criteria
Studies were considered eligible for the present meta-analysis if: 1) original observational studies; 2) participants in the end-stage kidney disease who are undergoing maintenance dialysis; 3) investigating the relationship between the presence and extent of AAC at baseline and subsequent cardiovascular or all-cause mortality risk; and 4) reporting risk estimate of cardiovascular or all-cause mortality events. The severity of calcification was classified as grade 0 to 3 in accordance with previous studies6,13,14. For the multiple articles from the same research group, we only selected the most recent comprehensive publication. Studies were excluded if they were cross-sectional design, reviews or duplicated publication.
Data extraction and quality assessment
Two authors (A Zhang and SJ Wang) independently collected data from included studies using a structured form. Extracted information included first author’s name, publication year, study design, geographical region of study, baseline characteristics of patients, detection methods, prevalence of AAC, event numbers, fully adjusted risk ratio (RR) or hazard ratio (HR) and 95% confidence intervals (CI), duration of follow-up, and adjustment for covariates. Any discrepancies during the data extraction were resolved by discussion. We applied the Newcastle–Ottawa Scale (NOS) for cohort studies to evaluate the methodological quality of each study10. The NOS ranges from zero to nine stars. Studies achieving a rating of more than 6 stars were considered to be of higher quality.
Statistical analysis
The overall risk estimates were pooled using the most fully adjusted RR or HR with their 95% CI comparing with and without AAC. Heterogeneity between studies evaluated by the Cochran’s Q (heterogeneity was set at a value of p < 0.10) and I2 tests (I2 > 50%). Random effect model was used for meta-analysis when there was significant heterogeneity; otherwise, a fixed-effect model was applied17. Subgroup analyses were performed by study design (prospective vs. retrospective), region (America vs. Asia), population (hemodialysis vs. peritoneal dialysis), sample sizes (>500 vs. <500), grade of AAC, follow-up duration (≥4 years vs. <4 years), and NOS scores (≥6 stars vs. <6 stars). The possibility of publication bias was tested by the Begg’s18 and Egger’s19 tests with significant publication bias considered as a p-value < 0.1.We performed a sensitivity analysis by excluding any single study at each turn to test the robustness of the pooled results. All statistical analyses were conducted using Stata 12.0 software.
Additional Information
How to cite this article: Zhang, A. et al. Aortic arch calcification and risk of cardiovascular or all-cause and mortality in dialysis patients: A meta-analysis. Sci. Rep. 6, 35375; doi: 10.1038/srep35375 (2016).
Supplementary Material
Footnotes
Author Contributions A.Z. and S.J.W. performed the literature research, extracted data, and assessed the quality. H.X.L. and J.Y. drafted the manuscript and made statistical analysis. H.W. designed the study, analyzed the results, and revised the manuscript All the authors reviewed and approved the final manuscript.
References
- Cannata-Andia J. B., Rodriguez-Garcia M., Carrillo-Lopez N., Naves-Diaz M. & Diaz-Lopez B. Vascular calcifications: pathogenesis, management, and impact on clinical outcomes. J Am Soc Nephrol 17, S267–S273 (2006). [DOI] [PubMed] [Google Scholar]
- Iribarren C., Sidney S., Sternfeld B. & Browner W. S. Calcification of the aortic arch: risk factors and association with coronary heart disease, stroke, and peripheral vascular disease. JAMA 283, 2810–2815 (2000). [DOI] [PubMed] [Google Scholar]
- Iijima K. et al. Aortic arch calcification detectable on chest X-ray is a strong independent predictor of cardiovascular events beyond traditional risk factors. Atherosclerosis 210, 137–144 (2010). [DOI] [PubMed] [Google Scholar]
- Li L. C., Lee Y. T., Lee Y. W., Chou C. A. & Lee C. T. Aortic arch calcification predicts the renal function progression in patients with stage 3 to 5 chronic kidney disease. Biomed Res Int 2015, 131263 (2015). [DOI] [PMC free article] [PubMed] [Google Scholar]
- Lee C. T. et al. Calcification of the aortic arch predicts cardiovascular and all-cause mortality in chronic hemodialysis patients. Cardiorenal Med 4, 34–42 (2014). [DOI] [PMC free article] [PubMed] [Google Scholar]
- Komatsu M., Okazaki M., Tsuchiya K., Kawaguchi H. & Nitta K. Aortic arch calcification predicts cardiovascular and all-cause mortality in maintenance hemodialysis patients. Kidney Blood Press Res 39, 658–667 (2014). [DOI] [PubMed] [Google Scholar]
- Hong W. X., Yu G., Cur Y. P., Sheng X. H. & Wang N. S. Clinical study on the relationship between calcium and phosphorus metabolism with aortic arch calcification in maintenance peritoneal dialysis patients. Chin J Nephrol 31, 641–646 (2015). [Google Scholar]
- Lee M. J. et al. Progression of aortic arch calcification over 1 year is an independent predictor of mortality in incident peritoneal dialysis patients. PLoS One 7, e48793 (2012). [DOI] [PMC free article] [PubMed] [Google Scholar]
- Ogawa T. et al. Progression of aortic arch calcification and all-cause and cardiovascular mortality in chronic hemodialysis patients. Int Urol Nephrol 42, 187–194 (2010). [DOI] [PubMed] [Google Scholar]
- Bohn E. et al. Predicting risk of mortality in dialysis patients: a retrospective cohort study evaluating the prognostic value of a simple chest X-ray. BMC Nephrol 14, 263 (2013). [DOI] [PMC free article] [PubMed] [Google Scholar]
- Liu S., Zhang D. L., Guo W., Cui W. Y. & Liu W. H. Left ventricular mass index and aortic arch calcification score are independent mortality predictors of maintenance hemodialysis patients. Hemodial Int 16, 504–511 (2012). [DOI] [PubMed] [Google Scholar]
- Abdelmalek J. A., Stark P., Walther C. P., Ix J. H. & Rifkin D. E. Associations between coronary calcification on chest radiographs and mortality in hemodialysis patients. Am J Kidney Dis 60, 990–997 (2012). [DOI] [PMC free article] [PubMed] [Google Scholar]
- Ogawa T. et al. Simple evaluation of aortic arch calcification by chest radiography in hemodialysis patients. Hemodial Int 13, 301–306 (2009). [DOI] [PubMed] [Google Scholar]
- Symeonidis G. et al. Gravity of aortic arch calcification as evaluated in adult Greek patients. Int Angiol 21, 233–236 (2002). [PubMed] [Google Scholar]
- London G. M., Marchais S. J., Guerin A. P. & Metivier F. Arteriosclerosis, vascular calcifications and cardiovascular disease in uremia. Curr Opin Nephrol Hypertens 14, 525–531 (2005). [DOI] [PubMed] [Google Scholar]
- Moher D., Liberati A., Tetzlaff J. & Altman D. G. Preferred reporting items for systematic reviews and meta-analyses: the PRISMA statement. Ann Intern Med 151, 264-9, W64 (2009). [DOI] [PubMed] [Google Scholar]
- Higgins J. P., Thompson S. G., Deeks J. J. & Altman D. G. Measuring inconsistency in meta-analyses. BMJ 327, 557–560 (2003). [DOI] [PMC free article] [PubMed] [Google Scholar]
- Begg C. B. & Mazumdar M. Operating characteristics of a rank correlation test for publication bias. Biometrics 50, 1088–1101 (1994). [PubMed] [Google Scholar]
- Egger M., Davey Smith G., Schneider M. & Minder C. Bias in meta-analysis detected by a simple, graphical test. BMJ 315, 629–634 (1997). [DOI] [PMC free article] [PubMed] [Google Scholar]
Associated Data
This section collects any data citations, data availability statements, or supplementary materials included in this article.


