

ABSTRACT
Microbial sulfur metabolism, particularly the formation and consumption of insoluble elemental sulfur (S0), is an important biogeochemical engine that has been harnessed for applications ranging from bioleaching and biomining to remediation of waste streams. Chlorobaculum tepidum, a low-light-adapted photoautolithotrophic sulfur-oxidizing bacterium, oxidizes multiple sulfur species and displays a preference for more reduced electron donors: sulfide > S0 > thiosulfate. To understand this preference in the context of light energy availability, an “energy landscape” of phototrophic sulfur oxidation was constructed by varying electron donor identity, light flux, and culture duration. Biomass and cellular parameters of C. tepidum cultures grown across this landscape were analyzed. From these data, a correction factor for colorimetric protein assays was developed, enabling more accurate biomass measurements for C. tepidum, as well as other organisms. C. tepidum's bulk amino acid composition correlated with energy landscape parameters, including a tendency toward less energetically expensive amino acids under reduced light flux. This correlation, paired with an observation of increased cell size and storage carbon production under electron-rich growth conditions, suggests that C. tepidum has evolved to cope with changing energy availability by tuning its proteome for energetic efficiency and storing compounds for leaner times.
IMPORTANCE How microbes cope with and adapt to varying energy availability is an important factor in understanding microbial ecology and in designing efficient biotechnological processes. We explored the response of a model phototrophic organism, Chlorobaculum tepidum, across a factorial experimental design that enabled simultaneous variation and analysis of multiple growth conditions, what we term the “energy landscape.” C. tepidum biomass composition shifted toward less energetically expensive amino acids at low light levels. This observation provides experimental evidence for evolved efficiencies in microbial proteomes and emphasizes the role that energy flux may play in the adaptive responses of organisms. From a practical standpoint, our data suggest that bulk biomass amino acid composition could provide a simple proxy to monitor and identify energy stress in microbial systems.
INTRODUCTION
Microbes that synthesize or degrade insoluble sulfur minerals are instrumental in the biogeochemical sulfur cycle (1) and have been applied for biomining (2, 3) and sulfide remediation (4–7). However, little is known about how these organisms respond to fluctuations in available energy due to shifts in electron donor identity, fixed carbon availability, or light in the case of phototrophic bacteria. A deeper understanding of microbial strategies for coping with energy fluctuations has the potential to improve microbe-catalyzed industrial processes (8) and to impact our understanding of microbial ecology as shaped by energy availability (9). Furthermore, a specific understanding of these adaptations among microbes capable of degrading elemental sulfur could inform new technologies for mitigating the effects of sulfur-metabolizing microbes on disturbed ecosystems (e.g., waste sulfur piles from petrochemical refining), particularly if coupled with recent advances in systems and synthetic biology.
Microbes that produce insoluble elemental sulfur (S0) as an intermediate of reduced sulfur compound oxidation and subsequently oxidize S0 to sulfate include both chemotrophs (genera Acidothiobacillus and Beggiatoa, order Sulfolobales) and phototrophs (families Chromatiaceae and Chlorobiaceae). S0 may be deposited either extra- or intracellularly (10, 11). The Chlorobiaceae are obligate anaerobes that use sulfide and other reduced sulfur compounds as electron donors for anoxygenic photosynthesis and transiently deposit S0 as extracellular globules (12–15). Unlike the more metabolically versatile species of the family Chromatiaceae, which are capable of dark, aerobic chemotrophic growth in addition to phototrophic sulfur oxidation (16), all of the characterized members of the family Chlorobiaceae are obligate anaerobic photolithoautotrophs, although some Chlorobiaceae assimilate simple organic carbon compounds (acetate, pyruvate) (17). Chlorobaculum tepidum produces and degrades insoluble extracellular S0 as an obligate intermediate of sulfide oxidation, grows rapidly (15, 18), is genetically tractable (19–23), and has a sequenced genome (24), making it an ideal platform for studying S0 metabolism by systems-based methods.
Systems-based methods require reproducible growth under controlled conditions and robust methods of biomass quantitation, both of which are challenging for C. tepidum. For example, consistent growth on S0 as the sole electron donor has only recently been reported (14). Extracellular S0 complicates growth measurements by standard methods (i.e., optical density and dry weight) because S0 adds turbidity (18, 25) and mass. Therefore, colorimetric protein assays are the methods of choice for biomass determinations of C. tepidum (12, 18, 25). However, differences between the amino acid compositions of biomass and protein standards and interference from a range of compounds (26), including photosynthetic pigments, mean that colorimetric protein assays often do not reflect the absolute protein concentration. While pigment extraction prior to protein measurement is common (12, 18, 25), the effects of extraction and of varying pigment content, induced by changes in light level (27, 28) and electron donor (12), have not been investigated systematically.
Design-of-experiments methodology (29, 30) was used to assess protein-based biomass quantitation methods and the response of C. tepidum across a factorial space defined by the electron donor, light flux level, and culture duration. This space—the “energy landscape” of phototrophic sulfur oxidation (Fig. 1)—was designed to alter pigment content by altering energy availability. C. tepidum displayed shifts in biomass amino acid composition, cell volume, and storage carbohydrate content across the energy landscape, suggesting that C. tepidum alters its physiology in response to energy availability to a greater extent than previously appreciated. While bias in the amino acid composition of highly expressed proteins toward energetically inexpensive amino acids has been inferred by bioinformatic analyses for a range of organisms (31–33), this work reports an experimentally measured shift in bulk amino acid composition for a single organism as a function of growth conditions. This observation implies that relatively simple bulk biomass measurements can be used to infer details about the energy status and adaptation of microbes.
FIG 1.
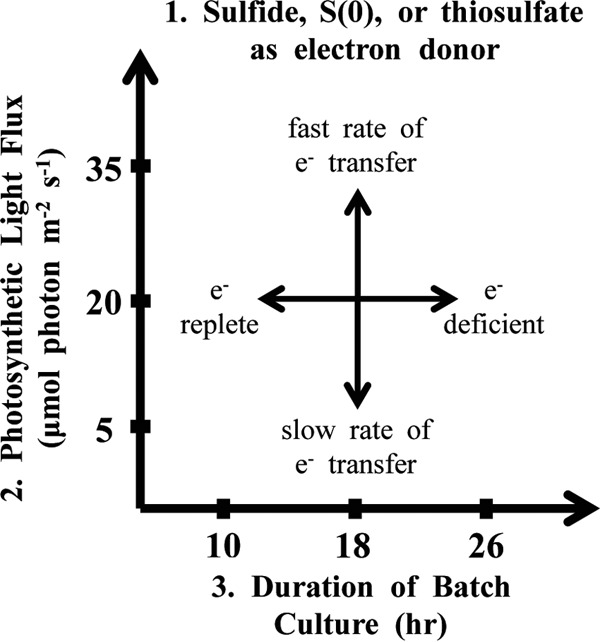
Schematic of the energy landscape of phototrophic sulfur oxidation. The energy landscape of phototrophic sulfur oxidation is constructed from three factors at three levels, i.e., (i) electron donor identity (sulfide, S0, or thiosulfate), (ii) light flux (5, 20, or 35 μmol photons m−2 s−1), and (iii) duration of batch culture (10, 18, or 26 h).
MATERIALS AND METHODS
Experimental design.
A three-by-three factorial experiment was employed to examine C. tepidum growth and characteristics as a function of the electron donor type, light flux level, and culture duration at three levels per factor. The I-optimal design was created by using JMP Pro (SAS Institute Inc.) and contained 48 independent cultures performed in six culturing blocks (see Table S1 in the supplemental material). This design enabled quantitative analysis of the effects of simultaneous changes in the energy landscape parameters on various measured responses (cell size attributes, total carbohydrate [TC], amino acid composition) by a second-order interaction polynomial model, Y = β0 + Σ βi xi + Σi<j βij xi xj + Σ βii xi xi + ϵ, where Y is the measured response, xi are experimental factors, β0,i,ij,ii are coefficients determined from multiple regression, and ϵ represents random error. β0 is the mean value of the response; main-effect terms (βi) represent a factor's direct effect, cross-interaction terms (βij) represent the synergistic impact of two factors, and polynomial terms (βii) represent nonlinear effects. Culturing block was investigated as a factor, except for analyses with amino acid analysis (AAA)-derived data as the dependent variable(s), which were conducted on a subset of the full design (see Table S1 in the supplemental material).
Bacterial strains and growth conditions.
C. tepidum strain WT2321, a plating strain derivative of the original TLS1 isolate (15, 20), was grown in 20-ml cultures with a 10-lb in−2 gage (177-kPa) headspace composed of 95% N2 and 5% CO2 passed through a heated copper scrubber. Experimental cultures were inoculated to 4 μg protein ml−1 from precultures derived from cryogenic stocks and grown at 45 to 46°C in a heated rotisserie culturing system. This system provided improved culture-to-culture consistency in light exposure and mixing relative to stirred water bath cultures (see Text A in the supplemental material for details). A light field of 35 μmol photons m−2 s−1 was provided from 100 W Reveal incandescent bulbs (GE Lighting) measured with a quantum PAR sensor (LI-COR). To obtain 5 and 20 μmol photons m−2 s−1 light, individual cultures were shaded by using printed transparency films. Culture durations (Fig. 1) were selected to capture mid-exponential-, late-exponential-, and early-stationary-phase cells at a light flux of 20 μmol photons m−2 s−1.
Culture medium.
Sulfur-free Pf-7 medium (15) was prepared by omitting sulfide and thiosulfate from Pf-7 prepared as previously described (12). Electron donors were added to individual tubes from concentrated, anoxic stock solutions. Sulfide stocks were pH neutralized (34), and biogenic S0 was purified as previously described (14). The electron donor concentrations in uninoculated medium were sulfide at 3.4 ± 0.2 mM, S0 at 9.3 ± 0.3 mM, and thiosulfate at 10.2 ± 0.1 mM. Acetate was added to all cultures at an initial concentration of 7.4 ± 0.3 mM.
Quantification of sulfur compounds and acetate.
Measurements were performed as described previously (12, 35), with the following modifications. Elemental sulfur was extracted from cell pellets with 10:1 (vol/vol) chloroform-methanol prior to quantitation by reversed-phase high-performance liquid chromatography. Sulfate was quantified by ion chromatography with suppressed conductivity detection (Metrohm) with an A Supp 5 100- by 4-mm column eluted with 3.2 mM Na2CO3–1.0 mM NaHCO3–6.5% (vol/vol) acetone in ultrapure water. Standard curves were prepared from sodium sulfide nonahydrate (ACS; Fisher), elemental sulfur powder (USP; Fisher), sodium thiosulfate pentahydrate (>99.5%; Sigma-Aldrich), sodium sulfate (>99%; Sigma-Aldrich), and sodium acetate (>99%; EM Science).
Protein and BChl c determinations.
C. tepidum cells collected by centrifugation (16,873 × g, 5 min) were lysed with 0.25 M NaOH (10 min), neutralized with an equal volume of 0.25 M HCl, centrifuged gently to pellet S0 (14 × g, 1 min), and diluted with 0.25 M NaCl prior to protein quantitation. Bradford assays were performed with Protein Assay Dye Reagent Concentrate (Bio-Rad Laboratories) in accordance with the manufacturer's instructions by using either the absorbance at 595 nm or the ratio of absorbances at 595 and 470 nm as the measured response (36, 37). Bicinchoninic acid (BCA) assays were performed with the Pierce BCA kit (Thermo Scientific) and incubation at 37°C; the ratio of sample to working reagent was increased to 1:2 (vol/vol). The observed technical variation for all protein assays is reported in Table S2 in the supplemental material. Bovine serum albumin (>98%; EM Science OmniPur) was used as a protein standard. Pigments were removed from extracted (EX) samples by methanol extraction (−20°C, 10 min) prior to lysis, whereas whole (WH) samples with pigment intact were analyzed without prior extraction. Bacteriochlorophyll c (BChl c) in the extracts was determined by absorbance at 669 nm (ε = 86.0 liters g−1 cm−1 [38]).
AAA.
Lyophilized cell samples were hydrolyzed (1% [vol/vol] phenol in 6 N HCl, 110°C, 24 h), and amino acids were separated by ion-exchange chromatography (Hitachi L-8800) with sodium citrate buffer as the mobile phase. The hydrolysis destroys Cys, Met, and Trp and converts the amide amino acids Asn and Gln to Asp and Glu, respectively. Biomass amino acid molar composition was calculated on the basis of the molar quantities of the individual amino acids measured in a sample.
Microscopy and cell volume measurements.
Culture aliquots were fixed with 0.37% formaldehyde and stored in the dark (4°C). At least three phase-contrast images at a total magnification of ×1,000 were collected for each culture with an AxioImager Z1 light microscope and a 100× oil immersion objective lens (Zeiss). Images were thresholded and masked by using ImageJ (version 1.49t, http://imagej.nih.gov/ij) default settings and a 15.5-pixel μm−1 scale. The particle analyzer function in Fiji (http://fiji.sc/Fiji) was used to extract area and perimeter measurements of cell-like objects from the images by using predetermined area and circularity criteria. Extracted objects were validated as cells by cross-referencing with the original images. Dividing, clumped, or out-of-focus cells and other debris were manually excluded so that only well-resolved cells were retained in the final data set. Cell images were modeled as the two-dimensional projection of a cylinder with hemispherical end caps to calculate cell diameter, length, and volume from area and perimeter measurements. Diameter, length, and volume measurements displayed lognormal distributions across the data set and within cultures and were log transformed and averaged by culture prior to analysis by least-squares linear models.
Cellular carbohydrate analysis.
Cellular carbohydrates were measured by the anthrone-sulfuric acid assay (39) adapted to a 96-well format (40, 41). Cell pellets were extracted with acetone (10 min, −20°C) to remove interfering pigments (42). Extracellular carbohydrates were removed by resuspension in a solution of 0.85% NaCl, centrifugation (16,873 × g, 5 min), and removal of the supernatant (39). Pellets were resuspended in water, and sample aliquots (45 μl per well) were transferred to a polypropylene 96-well plate (VWR). Samples were mixed with 150 μl anthrone reagent (2 g liter−1 anthrone [Acros Organics] in 98% sulfuric acid [EM Science]). For each sample, one aliquot was mixed with sulfuric acid without anthrone as a negative control and one aliquot was spiked with 5 μg glucose as a positive control. The covered plate was incubated at 4°C for 10 min at 95 to 105°C for 20 min and cooled at room temperature for 20 min. The absorbance at 620 nm was measured along with a glucose standard curve (0.5 to 10 μg glucose per well).
Statistical analysis.
JMP Pro was used for all statistical analyses and preparation of box-and-whisker plots. In box-and-whisker plots used throughout, the middle line indicates the median value, boxes span the 25th to 75th quantiles, and the whiskers represent either 1.5× the interquantile range from the end of the box or the upper and lower data points (excluding outliers).
The effect of the energy landscape on univariate responses was analyzed by least-squares fitting of the data to the second-order interaction polynomial model described above in the paragraph on experimental design. Log-transformed and averaged cell dimensions were fitted by weighted least-squares analysis, using the inverse of the variance of the cell dimension measurement as the weighting variable, to account for the large range of cell sizes observed within each population. Analysis of variance (ANOVA) was used to assess overall model significance by F test, which can assess multiple coefficients simultaneously, and to estimate parameter coefficient values, where the significance of individual parameters was determined by t test. Insignificant parameters, defined as P > 0.2, were sequentially eliminated to improve model significance and parameter estimates, and only parameters with t-test probabilities (P values) of <0.01 were considered to have a significant effect on the measured response. Light and culture duration factors were coded between −1 and 1 before model fitting. In some cases, using culture attributes (e.g., growth rate, etc.) as factors provided more meaningful relationships than the original energy landscape parameters, and the factors identified as producing significant effects are specified in the relevant sections below.
Amino acid composition data were fitted by multivariate ANOVA (MANOVA), which enabled analysis of the effects of the energy landscape on amino acid composition as a whole, as well as on individual amino acids. The statistical significance of effects in MANOVA is determined by F test, to enable the assessment of multiple coefficients simultaneously; approximated F ratios for categorical factors in MANOVA were calculated by Wilk's lambda.
RESULTS
Calibration of indirect protein assays provides accurate prediction of absolute biomass protein concentration.
As intended in the experimental design, cultivation of C. tepidum across all 27 energy landscape treatments (see Table S1 in the supplemental material) produced biomass with BChl c contents spanning 0.10 to 0.24 μg of BChl c μg of protein−1. Photosynthetic pigment interference in indirect protein assays, specifically, the Bradford and bicinchoninic acid (BCA) methods, was assessed by comparing protein measurements of WH and methanol-extracted (EX) samples. Two versions of the Bradford assay were used: standard (BrS), which measured A595, and ratio (BrR), which measured the A595/A470 ratio to provide better sensitivity and linearity than the standard assay (36, 37). The performance of the indirect assays was benchmarked against direct quantitation of protein by AAA measurements on WH samples, which displayed <5% error with bovine serum albumin as a standard (data not shown).
Indirect protein assays were highly correlated with AAA measurements (Table 1; Fig. 2), with the highest accuracy exhibited by BCA assay of EX samples (normalized root mean square error [nRMSE] = 16%; Table 1; see Text B in the supplemental material for calculations of accuracy metrics). The BCA assay overpredicted protein in WH samples (nRMSE = 37%), particularly for early- to mid-exponential-phase cultures (Fig. 2A, inset). Both versions of the Bradford assay underpredicted protein (nRMSE = >25%), regardless of whether pigments were removed, with BrR-WH measurements the least accurate (nRMSE = 38%).
TABLE 1.
Accuracy of Bradford and BCA (indirect) protein assay measurements in predicting direct protein quantitation by AAA
| Assay correction, pigment status, and assay method | R2 | β1 | β0 | RMSE (μg/ml) | nRMSE (%) |
|---|---|---|---|---|---|
| Without correction | |||||
| WH cell pellet | |||||
| BCA | 0.989 | 26 | 37 | ||
| BrS | 0.966 | 38 | 25 | ||
| BrR | 0.969 | 56 | 38 | ||
| EX cell pellet | |||||
| BCA | 0.983 | 12 | 16 | ||
| BrS | 0.971 | 40 | 29 | ||
| BrR | 0.983 | 43 | 33 | ||
| After correctiona | |||||
| WH cell pellet | |||||
| BCA | 1.07 | 15.0 | 10 | 24 | |
| BrS | 0.734 | 2.61 | 18 | 15 | |
| BrR | 0.604 | 1.52 | 17 | 15 | |
| EX cell pellet | |||||
| BCA | 0.981 | 3.30 | 12 | 18 | |
| BrS | 0.734 | −0.57 | 16 | 13 | |
| BrR | 0.714 | −2.11 | 12 | 12 |
Corrected = (indirect − β0) × β1−1.
FIG 2.
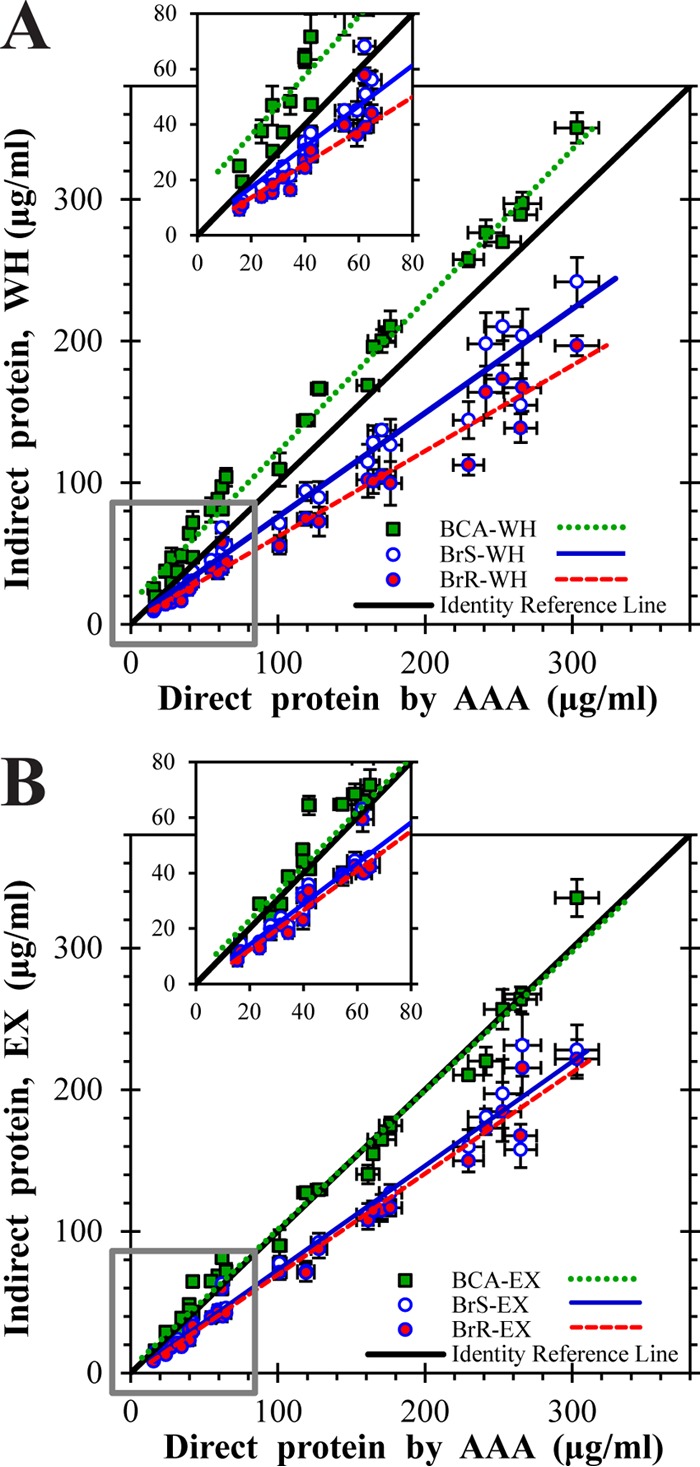
Calibration of indirect protein measurements against AAA. Values from BCA and Bradford assays are plotted versus direct protein quantitation by AAA for WH samples (A) and EX samples (B) along with the linear least-squares regression. Insets show low-concentration regions. The solid black identity reference line indicates equality between indirect and AAA protein determinations. The vertical error bars for indirect assay measurements represent the standard errors of triplicate determinations; horizontal error bars on AAA measurements represent propagation of the pooled standard error for four replicated AAA analyses.
The accuracy of all assays except BCA-WH was improved by a linear correction function as follows: Corrected = (Indirect − β0) × β1−1. Parameters β0 and β1 were obtained from the intercept and slope, respectively, of least-squares linear regressions of indirect protein measurements against AAA measurements (Table 1; see Text B in the supplemental material for details). Although BCA-WH exhibited the smallest absolute RMSE when corrected by a linear correlation function, it had the highest nRMSE due to proportionally large deviations for low-density cultures (Table 1; Fig. 2A, inset). Corrected Bradford assay measurements of EX samples demonstrated the smallest nRMSE (13% for BrS and 12% for BrR), a slight improvement in prediction accuracy over the uncorrected BCA-EX measurements.
Thus, for routine use with highly pigmented organisms like C. tepidum, BCA-EX measurements should provide the best results without the need for a correction factor. For the subsequent experiments, however, we employed corrected BrR-Ex measurements based on the improvement in overall accuracy.
Comparisons of WH and EX protein measurements suggest characteristics of the internal metabolite pools of C. tepidum.
While methanol extraction improved the accuracy (i.e., lowered the nRMSE) of the Bradford and BCA assays, this step could remove protein and/or soluble pools from biomass samples. Indeed, methanol extraction reduced the measured protein mass by 9%, on average (see Fig. S1A in the supplemental material; P = 0.001, one-tailed test), as measured by AAA of 16 pairs of WH and EX samples (see Table S1 in the supplemental material). Furthermore, the amino acid composition was altered between WH and EX samples, indicating that extraction preferentially removed Ala, Pro, and Glx (see Fig. S1B in the supplemental material; see Text C in the supplemental material for details). This was interpreted as loss of the soluble pools of these amino acids. However, there was no obvious relationship between the extent of depletion of Ala, Pro, or Glx and the energy landscape (data not shown).
Comparing BCA-WH and BCA-EX measurements revealed an interesting bias in BCA-WH error. While there was no relationship between BCA-EX error and energy landscape parameters, the tendency of BCA-WH to overpredict protein was greatest among samples from sulfide- and S0-grown cultures, at early times or low light levels, but not with thiosulfate-grown cultures (see Fig. S2 in the supplemental material). These observations suggest that C. tepidum possesses one or more internal pools of methanol-soluble metabolic reductants that artificially increase the signal of the BCA-WH assay, which is based on the reduction of Cu(II) to Cu(I).
C. tepidum cell size variations across the energy landscape are associated with the production of storage carbohydrates.
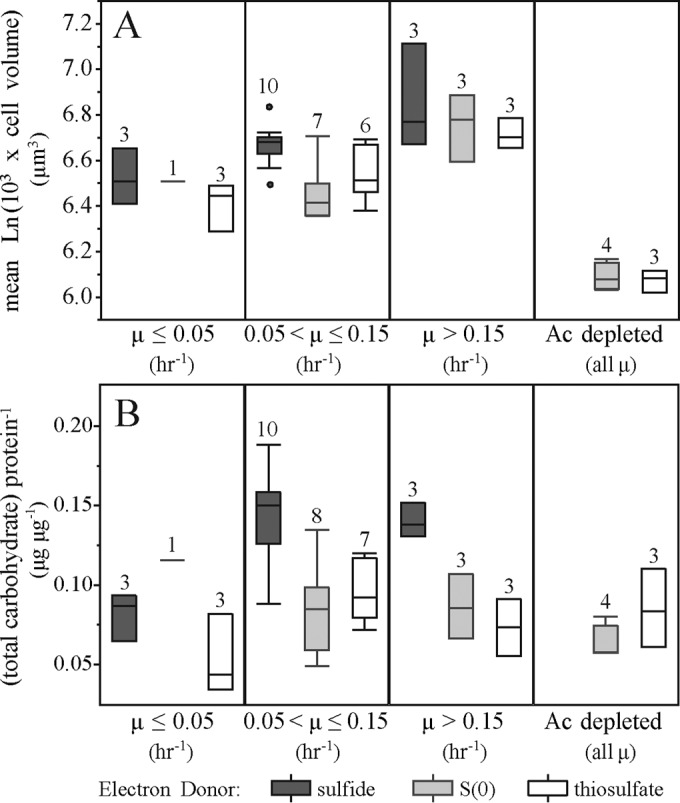
As cell size provides an indicator of the physiological state of microbes (43), we assessed changes in C. tepidum cell dimensions across the energy landscape and found that the growth rate positively correlated with cell length (R2 = 0.38; P < 0.0001) and cell volume (R2 = 0.34; P < 0.0001) but did not correlate with cell diameter (see Fig. S3 in the supplemental material). Increases in cell volume with higher growth rates is a well-established phenomenon (44), but the large variability in cell volume at a particular growth rate suggested that additional factors were influencing cell size (43). Adding parameters for electron donor identity and acetate availability revealed that these factors affected cell size beyond the effect of growth rate (Fig. 3A). Growth on sulfide led to larger (21%, P < 0.0001) and longer (17%, P < 0.0001) cells than growth on S0 and thiosulfate but had a negligible effect on cell diameter (see Fig. S4 in the supplemental material). Acetate depletion decreased the cell volume by 29% through the combined effects of decreased length (17%; P < 0.001) and decreased diameter (8%; P < 0.0001).
FIG 3.

Effects of the electron donor and acetate depletion on cell volume and storage carbohydrate accumulation across cultures at different growth rates. Box-and-whisker plots of culture-averaged log-transformed cell volumes (A) and total culture carbohydrate (B) normalized to culture protein binned by growth rate and classified by electron donor identity and acetate (Ac) availability. The number of cultures in each grouping is indicated above the box. Acetate was fully depleted by the 26-h time point for S0- and thiosulfate-grown cultures at the medium (20 μmol photons m−2 s−1) and high (35 μmol photons m−2 s−1) light levels.
As the accumulation and depletion of storage carbohydrates are known to influence cell volume (39, 40), TC was measured in biomass samples from across the energy landscape. Growth on sulfide increased the TC-to-protein ratio of C. tepidum by 72%, on average (P < 0.0001). The corresponding increase in the cell volume and TC-to-protein ratio of sulfide-grown cultures (Fig. 3B) provides evidence that growth on sulfide leads to enhanced glycogen production relative to C. tepidum growth on S0 or thiosulfate. Interestingly, the TC-to-protein ratio was not correlated with acetate depletion; thus, decreased cell volume in acetate-depleted cultures is not a result of storage carbohydrate degradation.
C. tepidum amino acid composition varies across the energy landscape.
The bulk amino acid composition of C. tepidum biomass, as determined from the AAA measurements (see Fig. S5 in the supplemental material), exhibited statistically significant changes across the energy landscape. MANOVA produced a highly significant (P ≤ 0.0001) second-order interaction model (see Materials and Methods), revealing that the electron donor (P = 0.0006), light level (P < 0.0001), and culture duration (P = 0.002) affected the abundance of specific amino acids (where the interaction of the light level and culture duration had a weak effect, P = 0.04). The electron donor had the most significant effect on Gly (P < 0.0001; see Fig. S6A in the supplemental material), which was enriched on sulfide and depleted on thiosulfate. Increasing light decreased the Asx content (P = 0.0003; see Fig. S6D in the supplemental material) and enriched for Lys (P = 0.0015; see Fig. S6F in the supplemental material). Increased culture duration enriched for Pro (P = 0.0008; see Fig. S6C in the supplemental material) and decreased Arg (P = 0.002; see Fig. S6B in the supplemental material) and Gly (P = 0.007; see Fig. S6A in the supplemental material).
Light flux affects biomass amino acid composition according to amino acid biosynthetic cost.
A closer inspection revealed that light induced subtler changes in nearly all amino acids. High light flux enriched for amino acids with high biosynthetic ATP requirements, while low light flux enriched for amino acids with low biosynthetic ATP costs (Fig. 4A; values for photosynthetic bacteria from reference 45). When the cost of amino acid synthesis for C. tepidum biomass (∼Pavg) was calculated by using the amino acid composition data and the energetic costs of synthesizing each amino acid in terms of the ATP required per amino acid (45), ∼Pavg was positively correlated with light flux (Fig. 4B; P = 0.002 for light as a single factor, P = 0.0008 when including culture duration as a nonlinear effect). The mean change in ∼Pavg between the low- and high-light conditions was 0.14 ± 0.04 ATP per amino acid. Different amino acids did not contribute equally to the change in ∼Pavg—for example, Lys was the largest contributor, while Pro and Thr slightly opposed the overall trend (see Table S3 in the supplemental material). However, excluding individual amino acids from the ∼Pavg calculation did not eliminate the relationship between ∼Pavg and light flux (see Table S4 in the supplemental material), consistent with a globally coordinated alteration of biomass composition.
FIG 4.
Light level affects variation in amino acid abundance according to biosynthetic cost. (A) Mean values of the normalized difference from the average composition are plotted as a function of light. Statistical significance: *, P < 0.05; **, P < 0.01; ***, P < 0.001. Amino acids are arranged in order of increasing biosynthetic cost (ATP required per amino acid) using values for phototrophic bacteria (45). The average amino acid biosynthetic cost for C. tepidum biomass (21.8 ATP molecules per amino acid) is indicated by the vertical dashed line. Error bars represent the standard error of the mean within each light level. (B) Box-and-whisker plot representation of the distribution of the measured ∼Pavg values for low, medium, and high light levels.
As C. tepidum is known to increase its BChl c content and chlorosome volume fraction in response to decreased light flux (27, 28), we considered the possibility that the observed bias in amino acid composition at low light levels could be the result of increased abundance of chlorosome-associated proteins. The BChl c-to-protein ratio increased with decreasing light for sulfide- and S0-grown cultures, as expected (see Fig. S7A in the supplemental material), although this was not the case for thiosulfate-grown cultures. We found that the BChl c-to-protein ratio strongly correlated with the overall amino acid composition (P = 0.0003 by MANOVA), and cultures with similar BChl c-to-protein ratios clustered together in a principal-component analysis plot (see Fig. S6B in the supplemental material). However, the BChl c-to-protein ratio did not correlate with ∼Pavg (P = 0.8; see Fig. S6C in the supplemental material), suggesting that the bias in composition toward amino acids with lower biosynthetic costs is not merely the result of increased chlorosome and chlorosome protein abundance.
There was no correlation between ∼Pavg and growth rate (P = 0.8; data not shown). All cultures achieved exponential growth, with maximal rates observed from 0 to 10 h. Growth rates of low-light cultures were lower with all electron donors (μ = 0.09 to 0.11 h−1) than those of medium-light (0.19 to 0.22 h−1) and high-light (μ = 0.23 to 0.25 h−1) cultures. Growth rates of cultures grown at medium (by 37 to 62%) and high (by 65 to 76%) light levels were lower after 10 h, but cultures continued to grow through 26 h.
DISCUSSION
Prior extraction of biomass samples improves the accuracy of indirect protein assays.
Bradford and BCA protein assays are simple, rapid, and inexpensive yet exhibit protein-to-protein variability, measure protein indirectly relative to a chosen protein standard, and are subject to interference from a range of compounds, including photosynthetic pigments (26). As C. tepidum pigment content changes in response to the electron donor (12), light intensity (27, 28), and culture duration, we used cultures grown across the energy landscape to examine this interference by using AAA as the “gold standard” for protein quantitation (46).
This work established that BCA-EX measurements provided good overall accuracy in predicting C. tepidum protein without correction. This method should provide a convenient and more generally applicable method of protein determination for photosynthetic biomass samples. Slightly improved accuracy was obtained from BrR-EX and BrS-EX measurements with an empirical correction function (Table 1; Fig. 2). However, we expect that the correction factor will vary between organisms based on different pigment contents and this will need to be determined for each organism independently. This study provides a road map for how to carry out such a correction, if desired.
Extractable pools inferred from protein analyses.
Pigments are typically removed by methanol extraction, and we found that this introduced changes in biomass amino acid composition by preferential extraction of alanine, proline, and glutamate/glutamine. This result was interpreted as the loss of free intracellular amino acid pools in C. tepidum, as these amino acids are observed as free pools in other microorganisms (47, 48). Prior studies of C. tepidum indicate that glutamine synthase/glutamine aminotransferase (GS/GOGAT) is the main route of ammonium assimilation in C. tepidum (49), which would be expected to contribute to free pools of glutamate and glutamine. Alanine dehydrogenase (ADH) has been suggested as an alternative ammonium assimilation pathway in “Chlorobium chlorochromatii” (50), which is consistent with our observation of an extractable alanine pool. This is further supported by C. tepidum transcriptome sequencing data (51), which showed that genes for GS/GOGAT (CT1411, CT0401, CT0402) and ADH (CT0650, CT0706) were expressed at similar levels. The significance of free proline in C. tepidum is not clear, but free-proline pools have been associated with osmotic stress (44, 47, 52), where converting glutamate to proline enables an increase in the intracellular solute concentration without requiring additional positively charged solutes to balance the charge (52).
The overestimation of protein by BCA-WH, but not BCA-EX, measurements for a subset of the energy landscape treatments provides evidence for the transient accumulation of an intracellular, methanol-extractable compound that increases the reduction of Cu(II) to Cu(I) in the BCA assay. The increase in the BCA-WH protein signal was predominantly observed in cells grown on sulfide or S0, particularly at short culture durations or low light levels (see Fig. S3 in the supplemental material), and was not present in cultures grown with thiosulfate as the electron donor or where the electron donor was largely exhausted. The increase in BCA-WH could be due to intracellular pools of sulfide or polysulfide, which have been detected in C. tepidum (unpublished data). Intracellular pools of polysulfides but not sulfide have also been observed in the purple sulfur bacterium Allochromatium vinosum (53). While intracellular pools of thiosulfate and sulfite have been previously quantified in C. tepidum (54, 55), these compounds are not soluble in methanol and would be unlikely to be extracted.
C. tepidum cell size changes suggest storage compound formation.
A positive relationship between the growth rate and cell size of heterotrophic bacteria such as Escherichia coli and Salmonella enterica serovar Typhimurium is textbook material (44), but whether this property translates to less-well-studied systems like C. tepidum is not clear. Growth rate and cell size correlate across different species of cyanobacteria and heterotrophic bacteria, but data on changes within a given species are lacking (56). Cell size was observed to correlate with the growth rate of Chromatium minus, a purple sulfur phototrophic bacterium, where large variations in cell volume among cells of a constant growth rate were attributed to intracellular storage of sulfur and glycogen (57). The Chlorobiaceae synthesize glycogen in the light as a carbon storage compound and ferment the stored glycogen in the dark to provide maintenance energy (17, 58–61).
After accounting for growth rate differences, C. tepidum cells grown on sulfide were larger than on S0 or thiosulfate, a difference that appears to be due to the accumulation of glycogen in sulfide-grown cells (Fig. 3B). While degradation of glycogen was previously described upon the transition from sulfide oxidation to S0 oxidation for members of the family Chromatiaceae (62, 63), this work directly compared glycogen production levels during the oxidation of different electron donors in the family Chlorobiaceae. Enhanced glycogen storage on sulfide suggests that C. tepidum may use glycogen synthesis in part to cope with and/or store excess reducing power available during sulfide oxidation. This is consistent with the induction of a high-velocity, low-affinity sulfide:quinone oxidoreductase (CT1087) whose physiological role seems to be primarily sulfide tolerance (51, 64, 65).
The parallel effect of culture parameters on cell length and volume, but not on cell diameter, suggests that C. tepidum modulates cell size by altering length rather than diameter. Because C. tepidum chlorosomes are arranged at the perimeter of cells, the chlorosome concentration per unit of cell volume will be maximized by a smaller diameter. Thus, maintaining the cell diameter may be advantageous for maximizing the light-harvesting potential of the cells.
Amino acid composition changes induced by energy landscape parameters suggest that biosynthetic streamlining at low energy can be observed with bulk measurements.
At the outset, we did not expect to observe significant changes in amino acid composition across the energy landscape because we felt that protein expression changes would be too subtle to be detected in bulk biomass measurements. However, the data clearly indicate that C. tepidum biomass composition detectably shifts across the energy landscape. Furthermore, these shifts appear to be sensible in the context of the energy landscape when interpreted on the basis of the energetics of amino acid biosynthesis. The ∼Pavg decreased in response to decreased light flux, amounting to a difference of 0.14 ± 0.04 ATP per amino acid from the high-light to the low-light conditions (Fig. 4B), which translates to a savings in amino acid synthesis costs of 0.64% from 21.87 ATP molecules per amino acid at high light levels. As noted above, tryptophan, the most energetically expensive amino acid (76.3 ATP molecules per amino acid [45]), is not measurable by the AAA method employed. Trp shares chorismate as a biosynthetic intermediate with Phe and Tyr, which both contribute positively to the ∼Pavg change in response to light. Thus, we expect that Trp would also positively contribute to an observed change in ∼Pavg.
This bias of C. tepidum toward using less energetically expensive amino acids at reduced light flux could potentially be an evolved response for coping with ATP limitation, as members of the family Chlorobiaceae are adapted to lower light flux than other phototrophs (16, 66). Interestingly, the first- and third-lowest-cost proteins in the C. tepidum proteome on a per amino acid basis (calculated by using the approach of Smith and Chapman [45]) are associated with light harvesting (chlorosome proteins CsmD and CsmF), and the fourth-lowest-cost protein is associated with ATP generation (ATP synthase subunit c).
Efficiency in the primary sequence of proteins has been observed previously; highly expressed bacterial genes (as assessed by major codon usage) tend to code for proteins that use less energetically expensive amino acids (31–33), and extracellular proteins tend to be composed of less energetically expensive amino acids than intracellular and membrane proteins (45). Furthermore, a survey of yeast transcriptomic data found that resource limitations (e.g., salt stress, reduced exogenous amino acid availability, etc.) induced gene expression changes that varied inversely with the length of the coded proteins (67). However, whereas these previous studies were based on inferences from bioinformatic analyses and omics data sets, this work reports an experimentally measured shift in an organism's bulk amino acid composition in response to growth conditions. That the bias toward amino acids with lower biosynthetic cost appears to be independent of BChl c content (see Fig. S7C in the supplemental material) suggests that this effect is the result of global changes in C. tepidum protein expression, and possibly evolved efficiency in the primary sequence of proteins important at low light levels, rather than a mere consequence of increased chlorosome expression.
While a 0.64% cost savings in the energy requirements of amino acid synthesis at first glance appears quite small, long-term evolutionary success can be built on such incremental advances. Estimating that that amino acid biosynthesis accounts for 57% of the cellular energy budget of a reverse tricarboxylic acid cycle autotroph (68), this change in ∼Pavg would translate to a 0.37% increase in the growth rate, enabling a 10−6 initial proportion of the population to achieve >99% of the population within 7,300 doublings. This is roughly 20 years, assuming a doubling time of 8 h, which is consistent with the measured growth rate of C. tepidum under the low-light conditions of this study. While this time frame is long compared to typical laboratory growth experiments, 20 years is short compared to evolutionary time scales; for example, there is evidence that populations of green sulfur bacteria have consistently occurred in the Mediterranean Sea for >200,000 years (69) and potentially >2,000,000 years (70) and that purple sulfur bacteria have inhabited Mahoney Lake for >9,000 years (71). Furthermore, the energy savings and selection coefficient for this advantage (2.5 × 10⁻³ generation−1, calculated in accordance with reference 72) are similar to the advantage for switching from low-frequency to high-frequency codons in highly expressed proteins (31, 73).
The fact that the biases in the cost of amino acid synthesis were detectable by bulk analysis of biomass rather than by fine-grained omics-type analyses emphasizes the role that energy flux may play in the evolved adaptations of organisms and provides experimental evidence for evolved efficiencies in microbial proteomes. Thus, future systems-based studies that explore the response of C. tepidum and other environmental microbes to changing energy flux have the potential to provide deeper insight into the environmental pressures that have shaped proteins critical for life in low energy flux environments.
Concluding remarks.
The factorial approach employed in this work, coupled with efforts to reduce culturing variability and establish robust biomass quantitation, enabled a systematic analysis of the effects of electron donor, light flux level, and culture duration, as well as their interacting effects, on the physiology of C. tepidum. Through the range of treatments produced by this approach, protein-based biomass quantitation methods were calibrated and previously unidentified traits of C. tepidum were revealed. These include changes in glycogen storage as a function of electron donor and overall biomass amino acid composition in response to growth conditions. Our observation of a bias in the amino acid composition toward less energetically expensive amino acids under low-light conditions provides a “real-time” experimental observation of whole-biomass amino acid compositional shifts in response to energy limitation. Thus, measurements of biomass amino acid composition have the potential to provide a simple, useful means to assess and diagnose energy stress or adaptations in applications such as bioreactor process monitoring. The experimental design approach employed here enabled simultaneous examination of multiple factors that revealed subtle and interacting-factor effects that would have remained hidden in studies with single-factor designs. The generalized approach of carefully designed “landscape”-type studies can be extended to many other systems to enable the identification of previously undetected interactions in problems impacted by multiple interacting factors.
Supplementary Material
ACKNOWLEDGMENTS
We thank Cassandra Marnocha and Clara Chan for assistance with microscopy techniques and use of equipment. We are grateful to Jacob Hilzinger for sharing information on C. tepidum's internal metabolite pools and to Kathleen Scott (University of South Florida) for help estimating amino acid synthesis cost in the context of the cellular energy budget. AAA was performed by the Molecular Structure Facility at the University of California at Davis.
Funding Statement
This work, including the efforts of Thomas E. Hanson, was funded by National Science Foundation (NSF) (MCB-1244373). This work, including the efforts of Amalie Tuerk Levy, was funded by National Science Foundation (NSF) (GRFP 0750966). This work used infrastructure resources funded by National Science Foundation (NSF) (EPS-0814251). This work used infrastructure resources funded by HHS | NIH | National Institute of General Medical Sciences (NIGMS) (P20 GM103446). This work, including the efforts of Thomas E. Hanson, was funded by University of Delaware Research Foundation (UDRF).
Footnotes
Supplemental material for this article may be found at http://dx.doi.org/10.1128/AEM.02111-16.
REFERENCES
- 1.Lavik G, Stührmann T, Brüchert V, Van der Plas A, Mohrholz V, Lam P, Mussmann M, Fuchs BM, Amann R, Lass U, Kuypers MMM. 2009. Detoxification of sulphidic African shelf waters by blooming chemolithotrophs. Nature 457:581–584. doi: 10.1038/nature07588. [DOI] [PubMed] [Google Scholar]
- 2.Johnson DB. 2014. Biomining—biotechnologies for extracting and recovering metals from ores and waste materials. Curr Opin Biotechnol 30:24–31. doi: 10.1016/j.copbio.2014.04.008. [DOI] [PubMed] [Google Scholar]
- 3.Rawlings DE. 2005. Characteristics and adaptability of iron- and sulfur-oxidizing microorganisms used for the recovery of metals from minerals and their concentrates. Microb Cell Fact 4:13. doi: 10.1186/1475-2859-4-13. [DOI] [PMC free article] [PubMed] [Google Scholar]
- 4.Fortuny M, Guisasola A, Casas C, Gamisans X, Lafuente J, Gabriel D. 2010. Oxidation of biologically produced elemental sulfur under neutrophilic conditions. J Chem Technol Biotechnol 85:378–386. doi: 10.1002/jctb.2333. [DOI] [Google Scholar]
- 5.Janssen AJH, Ruitenberg R, Buisman CJN. 2001. Industrial applications of new sulphur biotechnology. Water Sci Technol 44:85–90. [PubMed] [Google Scholar]
- 6.Syed M, Soreanu G, Falletta P, Béland M. 2006. Removal of hydrogen sulfide from gas streams using biological processes—a review. Can Biosyst Eng 48:2.1–2.14. [Google Scholar]
- 7.Lens PNL, Kuenen JG. 2001. The biological sulfur cycle: novel opportunities for environmental biotechnology. Water Sci Technol 44:57–66. [PubMed] [Google Scholar]
- 8.Sturman PJ, Stein OR, Vymazal J, Kröpfelová L. 2008. Sulfur cycling in constructed wetlands, p 329–344. In Vymazal J. (ed), Wastewater treatment, plant dynamics, and management in constructed and natural wetlands. Springer Science+Business Media BV, Berlin, Germany. [Google Scholar]
- 9.Macalady JL, Hamilton TL, Grettenberger CL, Jones DS, Tsao LE, Burgos WD. 2013. Energy, ecology and the distribution of microbial life. Philos Trans R Soc Lond B Biol Sci 368:20120383. doi: 10.1098/rstb.2012.0383. [DOI] [PMC free article] [PubMed] [Google Scholar]
- 10.Kleinjan WE, de Keizer A, Janssen AJH. 2003. Biologically produced sulfur, p 167–188. In Steudel R. (ed), Elemental sulfur and sulfur-rich compounds I. Springer-Verlag, New York, NY. [Google Scholar]
- 11.Dahl C, Prange A. 2006. Bacterial sulfur globules: occurrence, structure and metabolism, p 21–51. In Shivley JM. (ed), Inclusions in prokaryotes. Springer-Verlag, Berlin, Germany. [Google Scholar]
- 12.Chan L-K, Weber TS, Morgan-Kiss RM, Hanson TE. 2008. A genomic region required for phototrophic thiosulfate oxidation in the green sulfur bacterium Chlorobium tepidum (syn. Chlorobaculum tepidum). Microbiology 154(Pt 3):818–829. doi: 10.1099/mic.0.2007/012583-0. [DOI] [PubMed] [Google Scholar]
- 13.Holkenbrink C, Barbas SO, Mellerup A, Otaki H, Frigaard N-U. 2011. Sulfur globule oxidation in green sulfur bacteria is dependent on the dissimilatory sulfite reductase system. Microbiology 157:1229–1239. doi: 10.1099/mic.0.044669-0. [DOI] [PubMed] [Google Scholar]
- 14.Hanson TE, Bonsu E, Tuerk A, Marnocha CL, Powell DH, Chan CS. 31 July 2015. Chlorobaculum tepidum growth on biogenic S(0) as the sole photosynthetic electron donor. Environ Microbiol doi: 10.1111/1462-2920.12995. [DOI] [PubMed] [Google Scholar]
- 15.Wahlund T, Woese C, Castenholz R. 1991. A thermophilic green sulfur bacterium from New Zealand hot springs, Chlorobium tepidum sp. nov. Arch Microbiol 156:81–90. doi: 10.1007/BF00290978. [DOI] [Google Scholar]
- 16.Imhoff JF. 2006. The Chromatiaceae, p 846–873. In Dworkin M, Falkow S, Rosenburg E, Schleifer K-H, Stackebrandt E (ed), The prokaryotes—volume 6: proteobacteria: gamma subclass, 3rd ed Springer Science+Business Media, LLC, Singapore. [Google Scholar]
- 17.Overmann J. 2006. The family Chlorobiaceae, p 359–378. In Dworkin M, Falkow S, Rosenberg E, Schleifer K-H, Stackebrandt E (ed), The prokaryotes—volume 7: proteobacteria: delta and epsilon subclasses. Deeply rooting bacteria, 3rd ed Springer Science+Business Media, LLC, Singapore. [Google Scholar]
- 18.Mukhopadhyay B, Johnson EF, Ascano M. 1999. Conditions for vigorous growth on sulfide and reactor-scale cultivation protocols for the thermophilic green sulfur bacterium Chlorobium tepidum. Appl Environ Microbiol 65:301–306. [DOI] [PMC free article] [PubMed] [Google Scholar]
- 19.Chan L-K, Morgan-Kiss RM, Hanson TE. 2008. Genetic and proteomic studies of sulfur oxidation in Chlorobium tepidum (syn. Chlorobaculum tepidum), p 357–373. In Hell R, Dahl C, Knaff DB, Leustek T (ed), Sulfur metabolism in phototrophic organisms. Springer Science & Business Media, Dordrecht, The Netherlands. [Google Scholar]
- 20.Wahlund TM, Madigan MT. 1995. Genetic transfer by conjugation in the thermophilic green sulfur bacterium Chlorobium tepidum. J Bacteriol 177:2583–2588. [DOI] [PMC free article] [PubMed] [Google Scholar]
- 21.Frigaard N-U, Bryant DA. 2001. Chromosomal gene inactivation in the green sulfur bacterium Chlorobium tepidum by natural transformation. Appl Environ Microbiol 67:2538–2544. doi: 10.1128/AEM.67.6.2538-2544.2001. [DOI] [PMC free article] [PubMed] [Google Scholar]
- 22.Hanson TE, Tabita FR. 2001. A ribulose-1,5-biophosphate carboxylase/oxygenase (RubisCO)-like protein from Chlorobium tepidum that is involved with sulfur metabolism and the response to oxidative stress. Proc Natl Acad Sci U S A 98:4397–4402. doi: 10.1073/pnas.081610398. [DOI] [PMC free article] [PubMed] [Google Scholar]
- 23.Azai C, Harada J, Oh-oka H. 2013. Gene expression system in green sulfur bacteria by conjugative plasmid transfer. PLoS One 8:e82345. doi: 10.1371/journal.pone.0082345. [DOI] [PMC free article] [PubMed] [Google Scholar]
- 24.Eisen JA, Nelson KE, Paulsen IT, Heidelberg JF, Wu M, Dodson RJ, Deboy R, Gwinn ML, Nelson WC, Haft DH, Hickey EK, Peterson JD, Durkin AS, Kolonay JL, Yang F, Holt I, Umayam LA, Mason T, Brenner M, Shea TP, Parksey D, Nierman WC, Feldblyum TV, Hansen CL, Craven MB, Radune D, Vamathevan J, Khouri H, White O, Gruber TM, Ketchum KA, Venter JC, Tettelin H, Bryant DA, Fraser CM. 2002. The complete genome sequence of Chlorobium tepidum TLS, a photosynthetic, anaerobic, green-sulfur bacterium. Proc Natl Acad Sci U S A 99:9509–9514. doi: 10.1073/pnas.132181499. [DOI] [PMC free article] [PubMed] [Google Scholar]
- 25.Frigaard N-U, Voigt GD, Bryant DA. 2002. Chlorobium tepidum mutant lacking bacteriochlorophyll c made by inactivation of the bchK gene, encoding bacteriochlorophyll c synthase. J Bacteriol 184:3368–3376. doi: 10.1128/JB.184.12.3368-3376.2002. [DOI] [PMC free article] [PubMed] [Google Scholar]
- 26.Sapan CV, Lundblad RL, Price NC. 1999. Colorimetric protein assay techniques. Biotechnol Appl Biochem 29:99–108. [PubMed] [Google Scholar]
- 27.Morgan-Kiss RM, Chan L-K, Modla S, Weber TS, Warner M, Czymmek KJ, Hanson TE. 2009. Chlorobaculum tepidum regulates chlorosome structure and function in response to temperature and electron donor availability. Photosynth Res 99:11–21. doi: 10.1007/s11120-008-9361-7. [DOI] [PubMed] [Google Scholar]
- 28.Borrego CM, Gerola PD, Miller M, Cox RP. 1999. Light intensity effects on pigment composition and organisation in the green sulfur bacterium Chlorobium tepidum. Photosynth Res 59:159–166. doi: 10.1023/A:1006161302838. [DOI] [Google Scholar]
- 29.Mead R, Gilmour SG, Mead A. 2012. Statistical principles for the design of experiments: applications to real experiments. Cambridge University Press, New York, NY. [Google Scholar]
- 30.Ogunnaike BA. 2010. Random phenomena: fundamentals of probability and statistics for engineers, p 787–849. CRC Press, Boca Raton, FL. [Google Scholar]
- 31.Akashi H, Gojobori T. 2002. Metabolic efficiency and amino acid composition in the proteomes of Escherichia coli and Bacillus subtilis. Proc Natl Acad Sci U S A 99:3695–3700. doi: 10.1073/pnas.062526999. [DOI] [PMC free article] [PubMed] [Google Scholar]
- 32.Raiford DW, Heizer EM, Miller RV, Doom TE, Raymer ML, Krane DE. 2012. Metabolic and translational efficiency in microbial organisms. J Mol Evol 74:206–216. doi: 10.1007/s00239-012-9500-9. [DOI] [PubMed] [Google Scholar]
- 33.Heizer EM, Raiford DW, Raymer ML, Doom TE, Miller RV, Krane DE. 2006. Amino acid cost and codon-usage biases in 6 prokaryotic genomes: a whole-genome analysis. Mol Biol Evol 23:1670–1680. doi: 10.1093/molbev/msl029. [DOI] [PubMed] [Google Scholar]
- 34.Siefert E, Pfennig N. 1984. Convenient method to prepare neutral sulfide solution for cultivation of phototrophic sulfur bacteria. Arch Microbiol 139:100–101. doi: 10.1007/BF00692721. [DOI] [Google Scholar]
- 35.Rethmeier J, Rabenstein A, Langer M, Fischer U. 1997. Detection of traces of oxidized and reduced sulfur compounds in small samples by combination of different high-performance liquid chromatography methods. J Chromatogr A 760:295–302. doi: 10.1016/S0021-9673(96)00809-6. [DOI] [Google Scholar]
- 36.Ernst O, Zor T. 2010. Linearization of the Bradford protein assay. J Vis Exp 38:1918. doi: 10.3791/1918. [DOI] [PMC free article] [PubMed] [Google Scholar]
- 37.Zor T, Selinger Z. 1996. Linearization of the Bradford protein assay increases its sensitivity: theoretical and experimental studies. Anal Biochem 236:302–308. doi: 10.1006/abio.1996.0171. [DOI] [PubMed] [Google Scholar]
- 38.Stanier RY, Smith JHC. 1960. The chlorophylls of green bacteria. Biochim Biophys Acta 41:478–484. doi: 10.1016/0006-3002(60)90045-7. [DOI] [PubMed] [Google Scholar]
- 39.Hanson RS, Phillips JA. 1981. Chemical composition, p 328–364. In Gerhardt P, Murray RGE, Costilow RN, Nester EW, Wood WA, Krieg NR, Phillips GB (ed), Manual of methods for general bacteriology. American Society for Microbiology, Washington, DC. [Google Scholar]
- 40.Leyva A, Quintana A, Sánchez M, Rodríguez EN, Cremata J, Sánchez JC. 2008. Rapid and sensitive anthrone-sulfuric acid assay in microplate format to quantify carbohydrate in biopharmaceutical products: method development and validation. Biologicals 36:134–141. doi: 10.1016/j.biologicals.2007.09.001. [DOI] [PubMed] [Google Scholar]
- 41.Zuroff TR, Xiques SB, Curtis WR. 2013. Consortia-mediated bioprocessing of cellulose to ethanol with a symbiotic Clostridium phytofermentans/yeast co-culture. Biotechnol Biofuels 6:59. doi: 10.1186/1754-6834-6-59. [DOI] [PMC free article] [PubMed] [Google Scholar]
- 42.Turnbull TL, Adams MA, Warren CR. 2007. Increased photosynthesis following partial defoliation of field-grown Eucalyptus globulus seedlings is not caused by increased leaf nitrogen. Tree Physiol 27:1481–1492. doi: 10.1093/treephys/27.10.1481. [DOI] [PubMed] [Google Scholar]
- 43.Sánchez O, Van Gemerden H, Mas J. 1998. Utilization of reducing power in light-limited cultures of Chromatium vinosum DSM 185. Arch Microbiol 170:411–417. doi: 10.1007/s002030050661. [DOI] [PubMed] [Google Scholar]
- 44.Neidhardt FC, Ingraham JL, Schaechter M. 1990. Physiology of the bacterial cell. Sinauer Associates, Inc., Sunderland, MA. [Google Scholar]
- 45.Smith DR, Chapman MR. 2010. Economical evolution: Microbes reduce the synthetic cost of extracellular proteins. mBio 1:e00131–10. doi: 10.1128/mBio.00131-10. [DOI] [PMC free article] [PubMed] [Google Scholar]
- 46.Smith AJ. 1997. Postcolumn amino acid analysis. Methods Mol Biol 64:139–146. [DOI] [PubMed] [Google Scholar]
- 47.Brown CM, Stanley SO. 1972. Environment-mediated changes in the cellular content of the “pool” constituents and their associated changes in cell physiology. J Appl Chem Biotechnol 22:363–389. doi: 10.1002/jctb.5020220307. [DOI] [Google Scholar]
- 48.Clark VL, Peterson DE, Bernlohr RW. 1972. Changes in free amino acid production and intracellular amino acid pools of Bacillus licheniformis as a function of culture age and growth media. J Bacteriol 112:715–725. [DOI] [PMC free article] [PubMed] [Google Scholar]
- 49.Wahlund TM, Madigan MT. 1993. Nitrogen fixation by the thermophilic green sulfur bacterium Chlorobium tepidum. J Bacteriol 175:474–478. [DOI] [PMC free article] [PubMed] [Google Scholar]
- 50.Cerqueda-García D, Martínez-Castilla LP, Falcón LI, Delaye L. 2014. Metabolic analysis of Chlorobium chlorochromatii CaD3 reveals clues of the symbiosis in ‘Chlorochromatium aggregatum’. ISME J 8:991–998. doi: 10.1038/ismej.2013.207. [DOI] [PMC free article] [PubMed] [Google Scholar]
- 51.Eddie BJ, Hanson TE. 2013. Chlorobaculum tepidum TLS displays a complex transcriptional response to sulfide addition. J Bacteriol 195:399–408. doi: 10.1128/JB.01342-12. [DOI] [PMC free article] [PubMed] [Google Scholar]
- 52.Ellar DJ. 1978. Some strategies of osmoregulation and ion transport in microorganisms, p 125–150. In Schmidt-Nielsen K, Bolis L, Maddrell SHP (ed), Comparative physiology: water, ions, and fluid mechanics. Cambridge University Press, New York, NY. [Google Scholar]
- 53.Franz B, Gehrke T, Lichtenberg H, Hormes J, Dahl C, Prange A. 2009. Unexpected extracellular and intracellular sulfur species during growth of Allochromatium vinosum with reduced sulfur compounds. Microbiology 155:2766–2774. doi: 10.1099/mic.0.027904-0. [DOI] [PubMed] [Google Scholar]
- 54.Rodriguez J, Hiras J, Hanson TE. 2011. Sulfite oxidation in Chlorobaculum tepidum. Front Microbiol 2:112. doi: 10.3389/fmicb.2011.00112. [DOI] [PMC free article] [PubMed] [Google Scholar]
- 55.Hiras J. 2012. Characterization of a novel redox active thiol from Chlorobaculum tepidum. Ph.D. dissertation. University of Delaware, Newark, DE. [Google Scholar]
- 56.Kirchman DL. 2016. Growth rates of microbes in the oceans. Annu Rev Mar Sci 8:285–309. doi: 10.1146/annurev-marine-122414-033938. [DOI] [PubMed] [Google Scholar]
- 57.Montesinos E. 1987. Change in size of Chromatium minus cells in relation to growth rate, sulfur content, and photosynthetic activity: a comparison of pure cultures and field populations. Appl Environ Microbiol 53:864–871. [DOI] [PMC free article] [PubMed] [Google Scholar]
- 58.Sirevåg R, Ormerod JG. 1977. Synthesis, storage, and degradation of polyglucose in Chlorobium thiosulfatophilum. Arch Microbiol 111:239–244. doi: 10.1007/BF00549360. [DOI] [PubMed] [Google Scholar]
- 59.Sirevåg R. 1975. Photoassimilation of acetate and metabolism of carbohydrate in Chlorobium thiosulfatophilum. Arch Microbiol 104:105–111. doi: 10.1007/BF00447309. [DOI] [PubMed] [Google Scholar]
- 60.Badalamenti JP, Torres CI, Krajmalnik-Brown R. 2014. Coupling dark metabolism to electricity generation using photosynthetic cocultures. Biotechnol Bioeng 111:223–231. doi: 10.1002/bit.25011. [DOI] [PubMed] [Google Scholar]
- 61.Habicht KS, Miller M, Cox RP, Frigaard N-U, Tonolla M, Peduzzi S, Falkenby LG, Andersen JS. 2011. Comparative proteomics and activity of a green sulfur bacterium through the water column of Lake Cadagno, Switzerland. Environ Microbiol 13:203–215. doi: 10.1111/j.1462-2920.2010.02321.x. [DOI] [PubMed] [Google Scholar]
- 62.van Gemerden H, Beeftink HH. 1978. Specific rates of substrate oxidation and product formation in autotrophically growing Chromatium vinosum cultures. Arch Microbiol 119:135–143. doi: 10.1007/BF00964264. [DOI] [Google Scholar]
- 63.Schmidt GL, Kamen MD. 1970. Variable cellular composition of Chromatium in growing cultures. Arch Mikrobiol 73:1–18. doi: 10.1007/BF00409947. [DOI] [PubMed] [Google Scholar]
- 64.Chan L-K, Morgan-Kiss RM, Hanson TE. 2009. Functional analysis of three sulfide:quinone oxidoreductase homologs in Chlorobaculum tepidum. J Bacteriol 191:1026–1034. doi: 10.1128/JB.01154-08. [DOI] [PMC free article] [PubMed] [Google Scholar]
- 65.Shuman KE, Hanson TE. 2016. A sulfide:quinone oxidoreductase from Chlorobaculum tepidum displays unusual kinetic properties. FEMS Microbiol Lett 363:fnw100. doi: 10.1093/femsle/fnw100. [DOI] [PMC free article] [PubMed] [Google Scholar]
- 66.Biebl H, Pfennig N. 1978. Growth yields of green sulfur bacteria in mixed cultures with sulfur and sulfate reducing bacteria. Arch Microbiol 117:9–16. doi: 10.1007/BF00689344. [DOI] [Google Scholar]
- 67.Vilaprinyo E, Alves R, Sorribas A. 2010. Minimization of biosynthetic costs in adaptive gene expression responses of yeast to environmental changes. PLoS Comput Biol 6:e1000674. doi: 10.1371/journal.pcbi.1000674. [DOI] [PMC free article] [PubMed] [Google Scholar]
- 68.Mangiapia M, Scott K. 2016. From CO2 to cell: energetic expense of creating biomass using the Calvin-Benson-Bassham and reductive citric acid cycles based on genome data. FEMS Microbiol Lett 363:fnw054. doi: 10.1093/femsle/fnw054. [DOI] [PubMed] [Google Scholar]
- 69.Coolen MJL, Overmann J. 2007. 217 000-year-old DNA sequences of green sulfur bacteria in Mediterranean sapropels and their implications for the reconstruction of the paleoenvironment. Environ Microbiol 9:238–249. doi: 10.1111/j.1462-2920.2006.01134.x. [DOI] [PubMed] [Google Scholar]
- 70.Passier HF, Bosch H-J, Nijenhuis IA, Lourens LJ, Böttcher ME, Leenders A, Sinninghe Damsté JS, de Lange GJ, de Leeuw JW. 1999. Sulphidic Mediterranean surface waters during Pliocene sapropel formation. Nature 397:146–149. doi: 10.1038/16441. [DOI] [Google Scholar]
- 71.Coolen MJL, Overmann J. 1998. Analysis of subfossil molecular remains of purple sulfur bacteria in a lake sediment. Appl Environ Microbiol 64:4513–4521. [DOI] [PMC free article] [PubMed] [Google Scholar]
- 72.Dykhuizen DE. 1990. Experimental studies of natural selection in bacteria. Annu Rev Ecol Syst 21:373–398. doi: 10.1146/annurev.es.21.110190.002105. [DOI] [Google Scholar]
- 73.Brandis G, Hughes D. 2016. The selective advantage of synonymous codon usage bias in Salmonella. PLoS Genet 12:e1005926. doi: 10.1371/journal.pgen.1005926. [DOI] [PMC free article] [PubMed] [Google Scholar]
Associated Data
This section collects any data citations, data availability statements, or supplementary materials included in this article.