Abstract
MRI-based fluid-structure interactions (FSI) models for atherosclerotic plaques have been developed to perform mechanical analysis to investigate the association of plaque wall stress (PWS) with cardiovascular disease. However, the time consuming 3D FSI model construction process is a great hinder for its clinical implementations.
In this study, a 3D thin-layer structure only (TLS) plaque model was proposed as an approximation with much less computational cost to 3D FSI models for better clinical implementation potential. 192 TLS models were constructed based on 192 ex vivo MRI Images of 12 human coronary atherosclerotic plaques. Plaque stresses were extracted from all lumen nodal points. The maximum value of Plaque wall stress (MPWS) and average value of plaque wall stress (APWS) of each slice were used to compare with those from corresponding FSI models. The relative errors for MPWS and APWS were 9.76% and 9.89%, respectively. Both MPWS and APWS values obtained from TLS models showed very good correlation with those from 3D FSI models. Correlation results from TLS models were consistent with FSI models. Our results indicated that the proposed 3D TLS plaque models may be used as a good approximation to 3D FSI models with much less computational cost. With further validation, 3D TLS models may be possibly used to replace FSI models to save time and perform mechanical analysis for atherosclerotic plaques for clinical implementation.
Keywords: Fluid-Structure Interactions, Thin Layer Structure Only Model, Vulnerable Atherosclerotic Plaques, Stress
1. Introduction
Cardiovascular disease (CVD) is the leading cause of death worldwide. More than 60% of heart attacks are caused by rupture of a vulnerable plaque (Naghavi et al., 2003). In recent years, medical imaging technologies including magnetic resonance imaging (MRI), intravascular ultrasound (IVUS), angiography, and computed tomography (CT) have been developed and used in patient screening and diagnosis. Currently, plaque stenosis severity is still widely used as a main guidance for revascularization decisions. However, there has been growing evidence suggesting that stenosis criterion may be imprecise and the value of a particular intervention for each individual is uncertain (Gorelick, 1990, Barnett et al. 1998, Rothwell et al., 2003, Underhill et al., 2010). For example, 61% of the 2226 recently symptomatic subjects had less than 50% carotid stenosis (Barnett et al. 1998). It is thus clear that more accurate noninvasive methods are required so that future plaque rupture can be predicted early and proper treatment can be recommended to prevent actual drastic clinical events.
From the mechanical point of view, plaque rupture is likely to occur when the mechanical stress exceeds the material strength of fibrous cap. It was well accepted that mechanical forces play an important role in the rupture process and should be considered in an integrated way for plaque assessment. Indeed, image-based computational models have been introduced by many research groups to predict mechanical stress within the plaque structure (Bluestein et al. 2008, Cheng et al., 1993, Joshi et al., 2004, Leach et al., 2010, Sadat et al., 2011, Tang et al., 2003, 2004, 2008, 2009) and to assess its clinical significance (Gao et al., 2011, Gijsen et al., 2015, Huang et al., 2014a, Li et al., 2007, Teng et al., 2014a, Zhu et al., 2010,). Tang et al. introduced the first 3D multi-component fluid structure interaction (FSI) model for image-based plaque mechanical analysis (Tang et al., 2003). The numerical accuracy and reliability of 3D FSI models have then been demonstrated and validated, showing good agreement with both analytical solutions (Huang 2009a) and experimental data (Tang et al., 2003). Comparing to flow shear stress, plaque wall stress (PWS) might be a better predictor of carotid plaque rupture sites than flow shear stress, since PWS is typically around 103–105 times greater than wall shear stress (WSS) (Brown et al., 2016, Teng et al., 2010, Tang et al., 2014). It was found by several groups that higher PWS obtained from FSI models are linked to plaque rupture (Bluestein et al., 2008, Tang et al., 2009, Teng et al., 2010, Gao et al., 2011, Huang et al., 2012, Huang et al., 2014). However, currently it is still very time-consuming to construct 3D FSI models due to the complex deformable plaque structure and the highly non-linear material properties. This heavily restrained the clinical applications for 3D FSI Models.
Various modeling strategies, including 2D structure-only, 3D structure only and 3D fluid-structure interaction (FSI) simulations, have been compared to investigate the differences in stress predictions (Huang et al., 2014b). Huang et al. compared the differences in assessing mechanical stress within carotid atherosclerotic plaques using 2D structure only, 3D structure only, 3D one way and fully coupled FSI analysis (Huang et al., 2014b). Their results indicated that 1) 2D structure only model might not be suitable as an approximation to FSI model since the simulation significantly overestimated the stress level, although it is with much less computational expense; 2) 3D structure only model produced a small yet statistically significant stress overestimation compared to 3D FSI models. These studies indicated that 2D models might not be able to provide accurate approximations to FSI models. Although 3D structure only model produced a good approximation to FSI models, the difficulty of construction of the model is still significant and it is hard to be applied in clinical applications.
In the effort of seeking a computational model for atherosclerotic plaques which can be used to obtain reliable predictions of stress but with much less computational expense comparing to FSI models, a 3D thin layer structure only (TLS) plaque model was proposed to perform mechanical analysis for human atherosclerotic plaques based on ex vivo MRI data of coronary atherosclerotic plaques. TLS model takes less than 2 hours to construct and obtain the convergent solutions while FSI model takes one or two weeks for construction excluding obtaining convergent solutions. The simulation results of TLS models were used to compare with FSI models to investigate how good the approximation of TLS plaque models is.
2. Materials and Methods
2.1 MRI acquisition
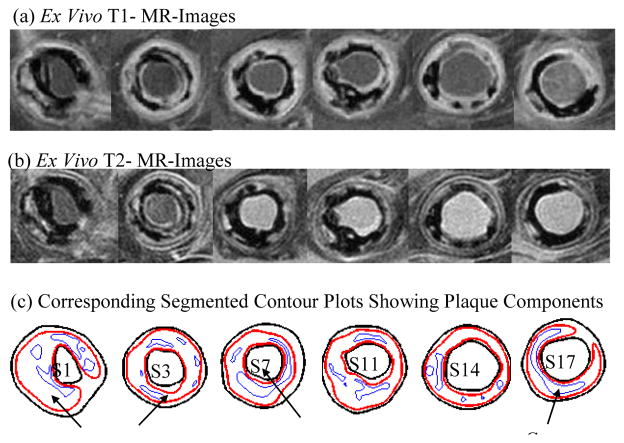
3D ex vivo MR Images were obtained from 12 human coronary plaques (male: 11; mean age: 60; consent obtained) using multi-contrast MRI techniques with high resolution (0.1mm×0.1mm×1mm) (Tang et al., 2004). Each specimen was fixed in a 10% buffered formalin solution and placed in a polyethylene tube. Then it was stored at 4°C within 12 hours after removal from the heart. All imaging procedures were performed on a 3-T Siemens Allegra clinical system (Siemens Medical Solutions, Malvern, PA). Three-dimensional gradient-echo images with a slice thickness of 0.5 mm were first obtained to define the orientation of the coronary artery vessel axis. The following MR sequences (T1-weighted, T2-weighted, proton density-weighted and gradient-echo) were obtained to better differentiate different components in the plaque (Fig. 1). The field of view was 25 × 19 mm2, matrix size was 256 × 192, and slice thickness was 1 mm. With machine interpolation, the segmented data had resolution of 0.05×0.05×1.0 mm3. After completion of MR study, the transverse sections with a thickness of 10 μm were obtained at 1 mm intervals from each specimen. These paraffin-embedded sections were stained with hematoxylin and eosin (H&E), Masson’s trichrome, and elastin van Gieson’s (EVG) stains to identify major plaque components: calcification (Ca), lipid rich necrotic core (LRNC), and fibrotic plaques (FP). Plaque vulnerability of these samples was assessed pathologically to serve as bench mark to validate computational findings. The 3D ex vivo MRI data were read by a self-developed software package Atherosclerotic Plaque Imaging Analysis (APIA, El Naqa I et al., 2007) written in Matlab (Math Works, MATLAB, Natick, MA) and also validated by histological analysis (Fig. 1 (d)).
Figure 1.
T1 and T2-weighted MR images of a human coronary plaque sample with lipid validated by histology.
2.2 3D Thin-Layer Structure Only Plaque Models
A 3D multi-component thin layer structure only (TLS) plaque model was constructed based on ex vivo MRI data to obtain the mechanical stress for analysis. For each 2D slice, the adjacent one upper slice and one lower slice were included to construct the corresponding 3D TLS plaque model. The information of axial curvature will thus be included. The deformation of each component was governed by the Cauchy momentum equation,
| (1) |
where ρ is the density of each component, t stands for time, i and j label spatial coordinates, vis the solid displacement vector, σ is the stress tensor, f.,j stands for derivative with respect to the jth variable. The strain-displacement relations is given by,
| (2) |
where ε [εij] is the Green-Lagrange strain tensor. To introduce the constitutive material models, the artery wall (includes vessel tissue and fibrous cap) and plaque component (lipid-rich necrotic core) was assumed to be hyperelastic, isotropic, incompressible and homogeneous. To simplify the model, the component of calcification was not considered in this study. The modified Mooney-Rivlin (M-R) model was used to describe the material properties of the components in the plaque (Bathe 2002). The strain energy function for M-R model is given by
| (3) |
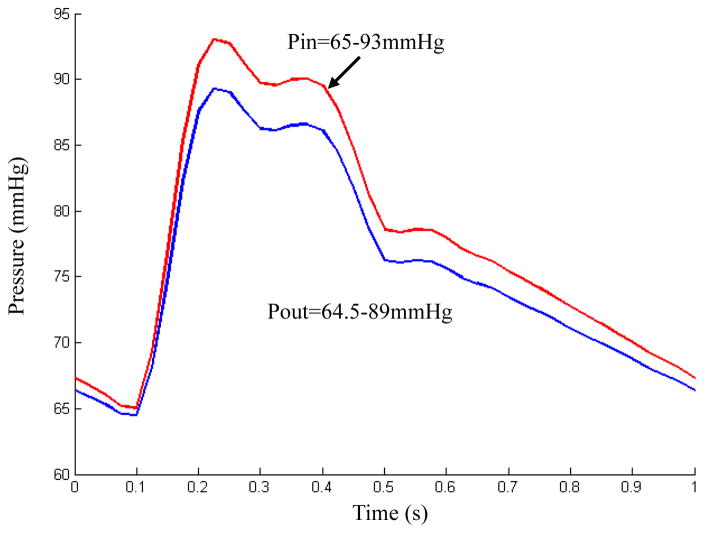
where I1 = Σ Cii, and are the first and second strain invariants, C = [Cij] = XTX is the right Cauchy-Green deformation tensor, X = [Xij] = [∂xi/∂aj], where xi is the current position, ai is the original position, and ci and Di are material parameters chosen to match experimental measurement and previously published studies (Bathe 2002). In this paper, the following parameter values were chosen: vessel tissue/fibrous cap, c1= 36.8 kPa, c2=0 kPa, D1=14.4 kPa, D2 = 2; lipid-rich necrotic core, c1=2kPa, c2=0 kPa, D1=2kPa, D2=1.5 (Tang et al., 2004, Teng et al., 2014b). Pulsating pressure conditions were used for both FSI and TLS models. For each plaque, patient-specific systolic and diastolic pressure conditions from the last hospital admission were scaled to apply. Fig. 2 shows a typical cardiac pressure profile scaled to 65–93 mmHg. It was used as upstream pressure (Pin) for FSI model based on the plaque sample shown in Fig. 1. The downstream pressure was set (64.5–89 mmHg) according to the upstream pressure, so that the flow rate was within physiological range. For TLS models, the upstream pressure (Pin) was applied over the lumen surface. In this study, both FSI and TLS plaque models were constructed based on ex vivo MR images. Therefore, the starting state for both models was at ex vivo state. The 10% pre-axial stretch was applied for both models to better simulate the arteries under the physiological condition (Huang et al., 2009b).
Figure 2.
A typical cardiac pressure profile scaled with patient-specific systolic (93 mmHg) and diastolic (65 mmHg) pressure from the last hospital admission and used as upstream pressure condition (Pin) for the computational simulations of the plaque sample shown in Figure 1.
2.3 2D, 3D TLS and 3D FSI model comparisons
The difference between TLS and 2D is that TLS model has axial stretch and axial curvature, but 2D model does not since 3 neighboured slices were included for TLS model and 2D model was under plane strain assumptions. The differences between 3D TLS and 3D FSI model were as follows, 1) FSI models include the fluid simulation while TLS models not; 2) the whole plaque was considered for FSI model but only 3 neighboured slices were considered in TLS model.
2.4 Mesh Generation and Solution Method
A Volume Component-Fitting Method (VCFM) was used to generate mesh for these models (Huang et al., 2012). Using this technique, the 3D plaque geometry was divided into some small 6 face “volumes” to curve-fit the very irregular plaque. The computational mesh was created in a commercial finite-element package ADINA (ADINA R & D, Inc., Watertown, MA, USA) computing environment.
The computational simulations for each TLS plaque models were solved by ADINA, which uses total Lagrangian incremental nonlinear finite element method. The governing finite element equations were solved by the modified Newton-Raphson iteration method. More details of the models and methods can be found at Tang and Bathe (Bathe 2002, Tang et al., 2003, Huang 2009a).
2.5 Data Analysis
Because stress is a tensor, its maximum principal stress at each node was chosen as its representative scalar value and was called as plaque wall stress (PWS) for convenience. Data for PWS was extracted from all nodal points on lumen surfaces. To investigate if TLS model is a good approximation to FSI models, the following two studies were conducted.
-
The maximum value of plaque wall stress (MPWS) and average value of plaque wall stress (APWS) extracted from all nodal points on lumen surfaces of each slice from TLS model were used to compare with those from 3D FSI model. The following formula was used to describe the relative error between the parameter values from TLS plaque model and FSI model.
(4) where ai is the value obtained from TLS models, and bi is the corresponding value from FSI models, n is the total number of slices. Data normality was assessed by Shapiro–Wilk test. P=0.1 was set as significance level. All data sets in this study were normally distributed. Therefore, to further investigate the difference of MPWS and APWS values between 3D TLS plaque model and FSI model, paired sample t-test was used for statistical analysis. A significant difference was assumed if p<0.05.
The correlation results between wall thickness and PWS based on TLS models were used to compare with those from FSI models. To find the correlation results between PWS and wall thickness, each slice was divided into 4 quarters with each quarter containing 25 data points taken on the lumen. Average PWS and wall thickness values from each quarter corresponding to maximum pressure condition were used for correlation analysis. Pearson correlation coefficient was used for all correlations analysis. The details of correlation study method can be found in Fan’s study (Fan et al., 2014). All statistical analysis was performed with SPSS 17.0 (SPSS Inc, Chicago, Ill).
3. Results
The demographic and plaque characteristics of the 12 patients were given in Table 1. There were 192 TLS models constructed based on the ex vivo MRI of the slices from these 12 patients. The computational results obtained from TLS models were used to compare with those of corresponding slice from FSI models.
Table 1.
Demographic and Clinical Characteristics of the Study Patient.
| Characteristic | Total (n=12) |
|---|---|
| Age | 59(45–72) |
| Male, n (%) | 11 (92) |
| Black, n (%) | 8 (67) |
| Body mass index, kg/m2 | 32 (23–47) |
| Systolic Blood Pressure (mmHg) | 137 (93–175) |
| Diastolic Blood Pressure (mmHg) | 77(65–104) |
| Baseline Lipid Profile | |
| Total Cholesterol, mg/dL | 156(76–260) |
| Triglycerides, mg/dL | 127(54–196) |
| High-density lipoprotein, mg/dL | 46(12–72) |
| Low-density lipoprotein, mg/dL | 85(29–177) |
3.1 Construction time for TLS model is significantly less than that for FSI models
Currently, it takes less than two hours to construct a TLS model and less than two minutes to obtain the convergent solutions. The construction/solving time for TLS model is similar to 2D model. However, it takes more than one week to construct a FSI or 3D wall only model for a well-trained researcher. What's more it takes around two days to obtain the convergent solutions if finite element meshes are good. The time for construction of TLS model is significantly less than that for FSI models.
3.2 MPWS and APWS from TLS plaque models were found to be close to those from FSI models
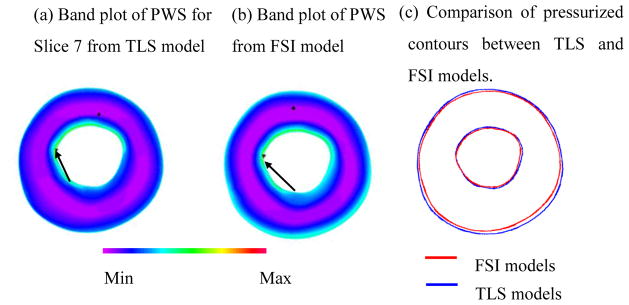
Fig. 3 presented a comparison of the results between TLS plaque model and FSI models for the slice presented in Fig. 1(d). The MPWS for slice 7 from TLS model was only 4.6% higher than that from FSI model (170.8 vs. 163.3 kPa); The APWS from TLS model was 6.7% less than that from FSI model (91.2 vs. 98.3 kPa). Fig. 3 (a) and (b) showed that PWS distributions from TLS plaque model have similar patterns with FSI model. The contours of the plaque from TLS model matched well with that from FSI model (Fig. 3 (c)).
Figure 3.
Band plots of PWS of slice on Figure 1 (d) showing the comparison of TLS and FSI models. a) Band plots of PWS for Slice 7 from TLS model; b) Band plot of PWS from FSI model; c) Comparison of pressurized contours between TLS and FSI model.
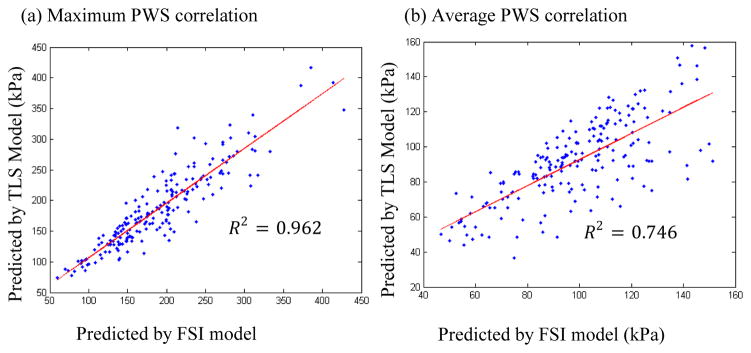
The overall results indicated that the relative error, calculated by formula (4), of MPWS from TLS models was 9.7% comparing to those from FSI models; the relative error of APWS from TLS models was 9.8% comparing to those from FSI models. Both MPWS and APWS values obtained from TLS models for each slice showed a very good correlation with those from 3D FSI models (R2=0.962 and R2=0.746 for MPWS and APWS respectively, Fig. 4).
Figure 4.
Stress Correlations. a) correlations between maximum PWS obtained by TLS and FSI models; b) correlations between average PWS obtained by TLS and FSI models.
3.3 No statistically significant difference found for MPWS between TLS plaque models and FSI models
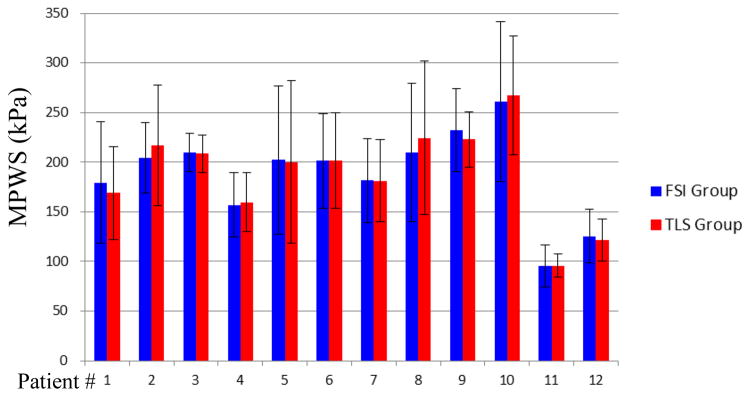
The results of PWS for those 192 slices obtained from TLS models and FSI models were compared. There was no statistically significant difference found for MPWS between TLS and FSI models (P=0.179). The mean value of MPWS values from TLS model was −1.6% less than that from FSI model (187.4±63.9 vs. 190.4±65.2 kPa). The patient-specific analysis results of MPWS obtained from TLS and FSI models were presented in Table 2 and Fig. 5. There was no statistical significant difference found for any patient (P>0.05 for all patients). What’s more, there were 9 out of 12 patients having less than 5% difference between TLS and FSI models (Table 2).
Table 2.
Summary of comparison of patient-specific maximum plaque wall stress (MPWS) and average plaque wall stress (APWS) results obtained from TLS and FSI models. Diff (%) represents the relative difference of the results between TLS and FSI models based on FSI results.
| Patient # | MPWS
|
APWS
|
||||||||
|---|---|---|---|---|---|---|---|---|---|---|
| TLS | FSI | Diff (%) | R2 | P value | TLS | FSI | Diff (% ) | R2 | P value | |
| 1 | 169.0 | 179.5 | −5.9 | 0.92 | 0.92 | 89.5 | 93.0 | −3.8 | 0.87 | 0.12 |
| 2 | 184.3 | 204.2 | −9.8 | 0.63 | 0.63 | 92.2 | 112.9 | −18.3 | 0.78 | <0.001 |
| 3 | 208.4 | 209.7 | −0.6 | 0.81 | 0.81 | 117.3 | 120.4 | −2.6 | 0.89 | 0.19 |
| 4 | 159.8 | 156.9 | 1.8 | 0.92 | 0.92 | 99.0 | 101.7 | −2.6 | 0.84 | 0.11 |
| 5 | 200.2 | 202.1 | −0.9 | 0.94 | 0.94 | 92.5 | 87.2 | 6.0 | 0.96 | 0.02 |
| 6 | 201.3 | 201.5 | −0.1 | 0.90 | 0.90 | 89.6 | 102.9 | −13.0 | 0.55 | <0.001 |
| 7 | 181.4 | 181.5 | 0.0 | 0.89 | 0.89 | 107.1 | 106.4 | 0.6 | 0.92 | 0.77 |
| 8 | 224.4 | 210.0 | 6.8 | 0.89 | 0.89 | 101.8 | 99.4 | 2.4 | 0.88 | 0.27 |
| 9 | 223.0 | 232.4 | −4.1 | 0.69 | 0.69 | 117.0 | 112.8 | 3.8 | 0.97 | 0.08 |
| 10 | 267.4 | 261.0 | 2.4 | 0.92 | 0.92 | 100.6 | 98.4 | 2.3 | 0.79 | 0.26 |
| 11 | 95.9 | 95.2 | 0.7 | 0.89 | 0.89 | 55.6 | 58.9 | −5.5 | 0.58 | 0.07 |
| 12 | 121.6 | 125.6 | −3.1 | 0.96 | 0.96 | 77.3 | 87.8 | −12.0 | 0.94 | <0.001 |
Figure 5.
Box plots show the comparisons of Maximum PWS values of each slice obtained from TLS and FSI models for each plaque.
3.4 APWS from TLS model was slightly less than those from FSI models
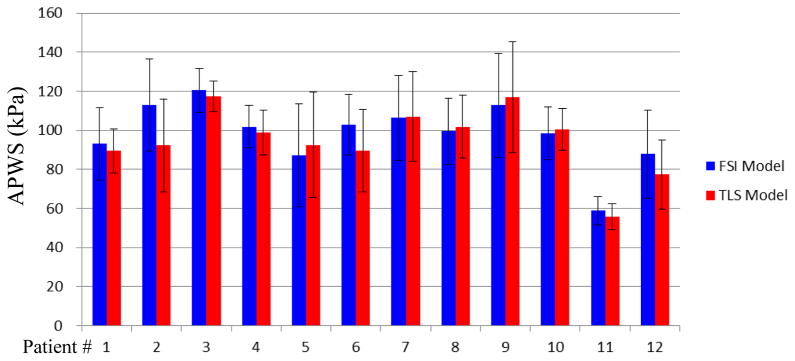
The APWS values of each slice were compared with those from FSI models. Although, the statistical significant difference was found (P<0.001), the mean value of APWS from TLS model was only 7% less than that from FSI model (91.4±23.1 v.s. 98.2±23.2). What’s more, the mixed results were found from patient-specific analysis (Table 2). The individual APWS results indicated that only 4 out of 12 plaques show statistical significant difference between TLS and FSI models. Except for these 4 plaques, APWS values predicted by TLS models are very close to those predicted by FSI models (Fig. 6).
Figure 6.
Box plots show the comparisons of Average PWS values of each slice obtained from TLS and FSI models for each plaque
3.5 Correlation results from TLS plaque models were consistent with FSI models
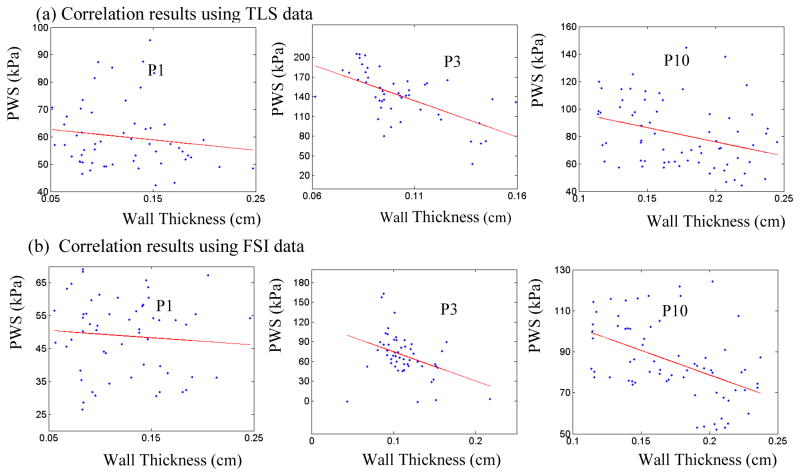
The correlation results between plaque wall thickness and PWS for randomly selected 3 patients from TLS and FSI models were presented in Table 3 and Fig. 7. 3 out of 3 patients showed negative correlation (Pearson correlation r-value <0) between plaque wall thickness and PWS using data from TLS models. The obtained correlation results were consistent with those using data from FSI models.
Table 3.
Summary of comparisons of correlation results (plaque wall thickness vs. plaque wall stress) between TLS and FSI models.
| Patient# | TLS
|
FSI
|
||
|---|---|---|---|---|
| Pearson r-value | P value | Pearson r-value | P value | |
| 1 | −0.139 | 0.306 | −0.084 | 0.540 |
| 3 | −0.616 | <0.001 | −0.384 | 0.005 |
| 10 | −0.329 | 0.006 | −0.477 | <0.001 |
Figure 7.
Comparison of correlation results of mean-quarter plaque wall stress vs. mean-quarter vessel wall thickness distribution plots from selected 3 patients between TLS and FSI models.
4. Discussion
4.1 TLS models were found to be good approximations to FSI models
In this study, it was found that MPWS and APWS results predicted by TLS plaque models were very close to those from FSI models. The PWS distributions from TLS plaque models were found to have similar patterns with FSI models. The average relative error for MPWS and APWS from TLS plaque models were less than 10% comparing to those from FSI models, respectively. The statistical analysis indicated that there was no statistical difference found for MPWS between TLS and FSI plaque models. Both MPWS and APWS results obtained from TLS plaque models showed very good correlations with those from 3D FSI models. Several research groups suggested the growing importance of searching for the hypotheses for mechanisms governing plaque progression process (Joshi et al., 2004, Fan et al., 2014). The results of TLS model were found to be in agreement with FSI plaque model results for all 3 cases. This indicated that the numerical results obtained from TLS models are able to be employed to perform the research for mechanisms governing plaque progression process with expected accuracy. These findings support that TLS models may be good approximations to FSI models.
4.2 TLS model was found to be better than 2D model
The comparisons of MPWS results for each slice of patient#1 between 2D, TLS, and FSI models were presented in Table 4. The relative error calculated by equation (4) for 2D models was 17.9% comparing to FSI models while only 8.8% for TLS models. There were 4 out of 17 slices shown that relative errors of MPWS results were more than 30% comparing to those obtained from FSI model. The error of 2D model is significant and can not be ignored. These results were consistent with Wang’s report (Wang et al., 2015). The main reason for that TLS model is able to better approximate full 3D models comparing to 2D model was that axial stretch/curvature was considered in TLS model while not in 2D models. Nieuwstadt et al. (2013) also found that axial stretch did have profound influence on the error in critical plaque wall stress by quantifying the comparison of 3D with 2D models. These indicate that comparing to 2D model, TLS model may be a better approximation to FSI model due to axial stretch consideration.
Table 4.
Summary of comparisons of maximum plaque wall stress (MPWS) results obtained from TLS and 2D models comparing to FSI models of every slices from Patient #1. Diff (%) represents the relative difference of the results between TLS/2D and FSI models based on FSI results.
| Slice # | FSI (kPa) | TLS(kPa) | TLS Diff (%) | 2D (kPa) | 2D Diff (%) |
|---|---|---|---|---|---|
| S3 | 115.0 | 111.2 | −3.3 | 84.0 | −27.0 |
| S4 | 107.6 | 119.1 | 10.7 | 145.5 | 35.2 |
| S5 | 136.8 | 155.1 | 13.3 | 158.6 | 15.9 |
| S6 | 200.9 | 176.4 | −12.2 | 169.3 | −15.7 |
| S7 | 272.0 | 243.6 | −10.4 | 172.9 | −36.4 |
| S8 | 199.1 | 166.8 | −16.2 | 169.1 | −15.1 |
| S9 | 161.5 | 150.4 | −6.9 | 140.3 | −13.1 |
| S10 | 172.0 | 161.7 | −6.0 | 153.5 | −10.7 |
| S11 | 196.7 | 196.2 | −0.2 | 224.8 | 14.3 |
| S12 | 211.9 | 205.7 | −2.9 | 223.1 | 5.3 |
| S13 | 161.3 | 164.3 | 1.8 | 173.5 | 7.5 |
| S14 | 154.3 | 174.3 | 12.9 | 168.7 | 9.3 |
| S15 | 210.2 | 243.1 | 15.6 | 279.7 | 33.0 |
| S16 | 159.6 | 181.9 | 13.9 | 170.6 | 6.9 |
| S17 | 227.7 | 255.3 | 12.1 | 321.0 | 41.0 |
| S18 | 219.6 | 217.2 | −1.1 | 209.9 | −4.4 |
| S19 | 178.6 | 161.5 | −9.6 | 154.7 | −13.4 |
4.3 TLS models may be good for clinical implementation
While 3D FSI models provide better representation of the real physical vessel, they are labor-intensive. Therefore, it’s hard for FSI model to be implemented for clinical implementation. Comparing to FSI models, the advantage of TLS models is “time saving” since it takes only one or two hours to construct a TLS plaque model. The reasons are as follows, 1) to construct a TLS model for a slice, there were only neighboured 3 slices to be considered. The patterns of neighboured 3 slices were very similar. Then it will be much easier to divide the volumes for mesh generation comparing to FSI models; 2) the obtained divided volumes are relatively more regular. This will also significantly decrease the difficulty of obtaining the convergent solutions. Therefore, it is possible to develop software to automatically generate patient-specific TLS models and perform stress analysis for all the slices of the whole plaque within an hour by the automated procedure. This will then meet the clinical needs. Therefore, comparing to one or two weeks’ construction time for FSI models, TLS models may have the potential to replace FSI models to perform mechanical analysis for atherosclerotic plaques for clinical implementation.
4.4 Limitations for TLS models
There are two major limitations of TLS model should be acknowledged: a) TLS models consider only neighboured 3 slices of plaque, which is the consideration of local region of plaque. Therefore, the axial stretch and the axial curvature of the plaque were partially considered in TLS models; b) axial pressure drop throughout the artery was neglected. It should be noted that when the plaque has a severe stenosis (more than 63%), a significant pressure drop may occur across the plaque (Deweese et al., 1970, Yang et al., 2007). Under this circumstance, the simulation results of TLS models might overestimate the stress levels of the plaques due to the neglecting of the pressure drop (Huang et al., 2014b). In this study, all the plaques involved demonstrated moderate degrees of luminal stenosis. The pressure gradient across these plaques was relatively small (Deweese et al., 1970).
5. Conclusions
In this study, a thin layer structure-only (TLS) model was introduced. The stress results of 192 patient-specific TLS models were compared with those from patient-specific FSI models. TLS models showed very good qualitative and quantitative agreement with 3D FSI models. Considering much reduced computational cost, TLS models may be used as good approximations to 3D FSI models to perform mechanical analysis for atherosclerotic plaques with clinical implementation potential. Prospective and large-scale studies are needed to further validate our findings.
Acknowledgments
This research was supported in part by NSF grant DMS-0540684 and NIH grant R01 EB004759. Dr. Xueying Huang’s research was partially supported by National Natural Science Foundation of China (Grant No. 31100670) and Fundamental Research Funds for the Central Universities (Grant No. 20720150008). Professor Chun Yang's research was supported in part by National Sciences Foundation of China grant 11171030.
Footnotes
Conflict of interest statement
We confirm that all authors of this manuscript have no conflicts of interest to declare.
Publisher's Disclaimer: This is a PDF file of an unedited manuscript that has been accepted for publication. As a service to our customers we are providing this early version of the manuscript. The manuscript will undergo copyediting, typesetting, and review of the resulting proof before it is published in its final citable form. Please note that during the production process errors may be discovered which could affect the content, and all legal disclaimers that apply to the journal pertain.
References
- Barnett HJ, Taylor DW, Eliasziw M, Fox AJ, Ferguson GG, Haynes RB, Rankin RN, Clagett GP, Hachinski VC, Sackett DL, Thorpe KE, Meldrum HE, Spence JD. Benefit of carotid endarterectomy in patients with symptomatic moderate or severe stenosis. North American Symptomatic Carotid Endarterectomy Trial Collaborators. N Engl J Med. 1998;339(20):1415–1425. doi: 10.1056/NEJM199811123392002. [DOI] [PubMed] [Google Scholar]
- Bathe KJ. Theory and Modeling Guide. ADINA R&D, Inc; Watertown: 2002. [Google Scholar]
- Bluestein D, Alemu Y, Avrahami I, Gharib M, Dumont K, Ricotta JJ, Einav S. Influence of microcalcifications on vulnerable plaque mechanics using FSI modeling. J Biomech. 2008;41(5):1111–1118. doi: 10.1016/j.jbiomech.2007.11.029. [DOI] [PubMed] [Google Scholar]
- Brown JA, Teng Z, Evans CP, Gillard HJ, Samady H, Bennett RM. Role of biomechanical forces in the natural history of coronary atherosclerosis, Nat. Rev Cardiol. 2016;13:210–220. doi: 10.1038/nrcardio.2015.203. [DOI] [PubMed] [Google Scholar]
- Cheng GC, Loree HM, Kamm RD, Fishbein MC, Lee RT. Distribution of circumferential stress in ruptured and stable atherosclerotic lesions. A structural analysis with histopathological correlation. Circulation. 1993;87(4):1179–1187. doi: 10.1161/01.cir.87.4.1179. [DOI] [PubMed] [Google Scholar]
- Deweese JA, May AG, Lipchik EO, Rob CG. Anatomic and hemodynamic correlations in carotid artery stenosis. Stroke. 1970;1(3):149–57. doi: 10.1161/01.str.1.3.149. [DOI] [PubMed] [Google Scholar]
- El Naqa I, Yang D, Apte A, Khullar D, Mutic S, Zheng J, Bradley JD, Grigsby P, Deasy JO. Concurrent multimodality image segmentation by active contours for radiotherapy treatment planning. Med Phys. 2007;34(12):4738–49. doi: 10.1118/1.2799886. [DOI] [PubMed] [Google Scholar]
- Fan R, Tang D, Yang C, Zheng J, Bach R, Wang L, Muccigrosso D, Billiar K, Zhu J, Ma G, Maehara A, Mintz GS. Human coronary plaque wall thickness correlated positively with flow shear stress and negatively with plaque wall stress: an IVUS-based fluid-structure interaction multi-patient study. Biomed Eng Online. 2014;13(1):32. doi: 10.1186/1475-925X-13-32. [DOI] [PMC free article] [PubMed] [Google Scholar]
- Gao H, Long Q, Kumar Das S, Halls J, Graves M, Gillard JH, Li ZY. Study of carotid arterial plaque stress for symptomatic and asymptomatic patients. J Biomech. 2011;44(14):2551–7. doi: 10.1016/j.jbiomech.2011.07.012. [DOI] [PubMed] [Google Scholar]
- Gorelick PB. Carotid endarterectomy: where do we draw the line? Stroke. 1990;30:1745–1750. doi: 10.1161/01.str.30.9.1745. [DOI] [PubMed] [Google Scholar]
- Gijsen FJ, Nieuwstadt HA, Wentzel JJ, Verhagen HJ, van der Lugt A, van der Steen AF. Carotid Plaque Morphological Classification Compared With Biomechanical Cap Stress: Implications for a Magnetic Resonance Imaging-Based Assessment. Stroke. 2015;46(8):2124–8. doi: 10.1161/STROKEAHA.115.009707. [DOI] [PubMed] [Google Scholar]
- Huang X. PhD Thesis. Worcester Polytechnic Institute; Worcester, USA: 2009a. In Vivo MRI-Based Three-Dimensional Fluid-Structure Interaction Models and Mechanical Image Analysis for Human Carotid Atherosclerotic Plaques. [Google Scholar]
- Huang X, Yang C, Yuan C, Liu F, Canton G, Zheng J, Woodard PK, Sicard GA, Tang D. Patient-specific artery shrinkage and 3D zero-stress state in multi-component 3D FSI models for carotid atherosclerotic plaques based on in vivo MRI data. Mol Cell Biomech. 2009b;6(2):121–34. [PMC free article] [PubMed] [Google Scholar]
- Huang X, Yang C, Canton G, Ferguson M, Yuan C, Tang D. Quantifying effect of intraplaque hemorrhage on critical plaque wall stress in human atherosclerotic plaques using three-dimensional fluid-structure interaction models. J Biomech Eng. 2012;134(12):121004. doi: 10.1115/1.4007954. [DOI] [PMC free article] [PubMed] [Google Scholar]
- Huang X, Yang C, Zheng J, Bach R, Muccigrosso D, Woodard PK, Tang D. Higher critical plaque wall stress in patients who died of coronary artery disease compared with those who died of other causes: a 3D FSI study based on ex vivo MRI of coronary plaques. J Biomech. 2014a;47(2):432–7. doi: 10.1016/j.jbiomech.2013.11.007. [DOI] [PMC free article] [PubMed] [Google Scholar]
- Huang Y, Teng Z, Sadat U, Graves MJ, Bennett MR, Gillard JH. The influence of computational strategy on prediction of mechanical stress in carotid atherosclerotic plaques: comparison of 2D structure-only, 3D structure-only, one-way and fully coupled fluid-structure interaction analyses. J Biomech. 2014b;47(6):1465–7. doi: 10.1016/j.jbiomech.2014.01.030. [DOI] [PMC free article] [PubMed] [Google Scholar]
- Joshi AK, Leask RL, Myers JG, Ojha M, Butany J, Ethier CR. Intimal thickness is not associated with wall shear stress patterns in the human right coronary artery. Arterioscler Thromb Vasc Biol. 2004;24(12):2408–2413. doi: 10.1161/01.ATV.0000147118.97474.4b. [DOI] [PubMed] [Google Scholar]
- Leach JR, Rayz VL, Soares B, Wintermark M, Mofrad MR, Saloner D. Carotid atheroma rupture observed in vivo and FSI-predicted stress distribution based on pre-rupture imaging. Ann Biomed Eng. 2010;38(8):2748–2765. doi: 10.1007/s10439-010-0004-8. [DOI] [PMC free article] [PubMed] [Google Scholar]
- Li ZY, Howarth SP, Tang T, Graves MJ, U-King-Im J, Trivedi RA, Kirkpatrick PJ, Gillard JH. Structural analysis and magnetic resonance imaging predict plaque vulnerability: a study comparing symptomatic and asymptomatic individuals. J Vasc Surg. 2007;45(4):768–775. doi: 10.1016/j.jvs.2006.12.065. [DOI] [PubMed] [Google Scholar]
- Naghavi M, Libby P, Falk E, Casscells SW, Litovsky S, Rumberger J, Badimon JJ, Stefanadis C, Moreno P, Pasterkamp G, Fayad Z, Stone PH, Waxman S, Raggi P, Madjid M, Zarrabi A, Burke A, Yuan C, Fitzgerald PJ, Siscovick DS, de Korte CL, Aikawa M, Juhani Airaksinen KE, Assmann G, Becker CR, Chesebro JH, Farb A, Galis ZS, Jackson C, Jang IK, Koenig W, Lodder RA, March K, Demirovic J, Navab M, Priori SG, Rekhter MD, Bahr R, Grundy SM, Mehran R, Colombo A, Boerwinkle E, Ballantyne C, Insull W, Jr, Schwartz RS, Vogel R, Serruys PW, Hansson GK, Faxon DP, Kaul S, Drexler H, Greenland P, Muller JE, Virmani R, Ridker PM, Zipes DP, Shah PK, Willerson JT. From vulnerable plaque to vulnerable patient: a call for new definitions and risk assessment strategies: Part I. Circulation. 2003;108(14):1664–72. doi: 10.1161/01.CIR.0000087480.94275.97. [DOI] [PubMed] [Google Scholar]
- Nieuwstadt HA, Akyildiz AC, Speelman L, Virmani R, vanderLugt A, vander Steen AF, Wentzel JJ, Gijsen FJ. The influence of axial image resolution on atherosclerotic plaque stress computations. J Biomech. 2013;46:689–695. doi: 10.1016/j.jbiomech.2012.11.042. [DOI] [PubMed] [Google Scholar]
- Rothwell PM, Gutnikov SA, Warlow CP. European Carotid Surgery Trialist's Collaboration Reanalysis of the final results of the European Carotid Surgery Trial. Stroke. 2003;34(2):514–523. doi: 10.1161/01.str.0000054671.71777.c7. [DOI] [PubMed] [Google Scholar]
- Sadat U, Teng Z, Young VE, Zhu C, Tang TY, Graves MJ, Gillard JH. Impact of plaque haemorrhage and its age on structural stresses in atherosclerotic plaques of patients with carotid artery disease: an MR imaging-based finite element simulation study. Int J Cardiovasc Imaging. 2011;27(3):397–402. doi: 10.1007/s10554-010-9679-z. [DOI] [PubMed] [Google Scholar]
- Tang D, Yang C, Kobayashi S, Zheng J, Vito RP. Effect of stenosis asymmetry on blood flow and artery compression: a three-dimensional fluid-structure interaction model. Ann Biomed Eng. 2003;31(10):1182–1193. doi: 10.1114/1.1615577. [DOI] [PubMed] [Google Scholar]
- Tang D, Yang C, Zheng J, Woodard PK, Sicard GA, Saffitz JE, Yuan C. 3D MRI-based multicomponent FSI models for atherosclerotic plaques. Ann Biomed Eng. 2004;32(7):947–60. doi: 10.1023/b:abme.0000032457.10191.e0. [DOI] [PubMed] [Google Scholar]
- Tang D, Yang C, Mondal S, Liu F, Canton G, Hatsukami TS, Yuan C. A negative correlation between human carotid atherosclerotic plaque progression and plaque wall stress: in vivo MRI-based 2D/3D FSI models. J Biomech. 2008;41(4):727–36. doi: 10.1016/j.jbiomech.2007.11.026. [DOI] [PMC free article] [PubMed] [Google Scholar]
- Tang D, Teng Z, Canton G, Yang C, Ferguson M, Huang X, Zheng J, Woodard PK, Yuan C. Sites of rupture in human atherosclerotic carotid plaques are associated with high structural stresses: an in vivo MRI-based 3D fluid-structure interaction study. Stroke. 2009;40(10):3258–3263. doi: 10.1161/STROKEAHA.109.558676. [DOI] [PMC free article] [PubMed] [Google Scholar]
- Tang D, Kamm DR, Yang C, Zheng J, Canton G, Bach R, Huang X, Hatsukami ST, Zhu J, Ma G, Maehara A, Mintz SG, Yuan C. Image-based modeling for better understanding and assessment of atherosclerotic plaque progression and vulnerability: Data, modeling, validation, uncertainty and predictions. J Biomech. 2014;47(4):834–846. doi: 10.1016/j.jbiomech.2014.01.012. [DOI] [PMC free article] [PubMed] [Google Scholar]
- Teng Z, Canton G, Yuan C, Ferguson M, Yang C, Huang X, Zheng J, Woodard PK, Tang D. 3D critical plaque wall stress is a better predictor of carotid plaque rupture sites than flow shear stress: An in vivo MRI-based 3D FSI study. J Biomech Eng. 2010;132(3):031007. doi: 10.1115/1.4001028. [DOI] [PMC free article] [PubMed] [Google Scholar]
- Teng Z, Brown AJ, Calvert PA, Parker RA, Obaid DR, Huang Y, Hoole SP, West NE, Gillard JH, Bennett MR. Coronary plaque structural stress is associated with plaque composition and subtype and higher in acute coronary syndrome: the BEACON I (Biomechanical Evaluation of Atheromatous Coronary Arteries) study. Circ Cardiovasc Imaging. 2014a;7(3):461–70. doi: 10.1161/CIRCIMAGING.113.001526. [DOI] [PubMed] [Google Scholar]
- Teng Z, Zhang Y, Huang Y, Feng J, Yuan J, Lu Q, Sutcliffe MP, Brown AJ, Jing Z, Gillard JH. Material properties of components in human carotid atherosclerotic plaques: a uniaxial extension study. Acta Biomater. 2014b;10(12):5055–63. doi: 10.1016/j.actbio.2014.09.001. [DOI] [PMC free article] [PubMed] [Google Scholar]
- Underhill HR, Hatsukami TS, Fayad ZA, Fuster V, Yuan C. MRI of carotid atherosclerosis: clinical implications and future directions. Nat Rev Cardiol. 2010;7(3):165–173. doi: 10.1038/nrcardio.2009.246. [DOI] [PubMed] [Google Scholar]
- Yang C, Tang D, Yuan C, Hatsukami TS, Zheng J, Woodard PK. In Vivo/Ex Vivo MRI-Based 3D Non-Newtonian FSI Models for Human Atherosclerotic Plaques Compared with Fluid/Wall-Only Models. Comput Model Eng Sci. 2007;19(3):233–246. [PMC free article] [PubMed] [Google Scholar]
- Wang H, Wang L, Zheng J, Zhu J, Maehara A, Yang C, Bach R, Muccigrosso D, Mintz SG, Tang D. Using 2D in Vivo Ivus-based Models for Human Coronary Plaque Progression Analysis and Comparison with 3d Fsi Models. Procedia Eng. 2015;126:451–455. doi: 10.1016/j.proeng.2015.11.269. [DOI] [Google Scholar]
- Zhu C, Teng Z, Sadat U, Young VE, Graves MJ, Li ZY, Gillard JH. Normalized wall index specific and MRI-based stress analysis of atherosclerotic carotid plaques: a study comparing acutely symptomatic and asymptomatic patients. Circ J. 2010;74(11):2360–4. doi: 10.1253/circj.cj-10-0305. [DOI] [PubMed] [Google Scholar]


