

SUMMARY
Progenitor cells in the medical ganglionic eminence (MGE) and preoptic area (PoA) give rise to γ-aminobutyric acid (GABA)-ergic inhibitory interneurons that are distributed in the forebrain, largely in the cortex, hippocampus, and striatum. Two previous studies suggest that clonally related interneurons originating from individual MGE/PoA progenitors frequently form local clusters in the cortex. However, Mayer et al. and Harwell et al. recently argued that MGE/PoA-derived interneuron clones disperse widely and populate different forebrain structures. Here, we report further analysis of the spatial distribution of clonally related interneurons and demonstrate that interneuron clones do not non-specifically disperse in the forebrain. Around 70% of clones are restricted to one brain structure, predominantly the cortex. Moreover, the regional distribution of clonally related interneurons exhibits a clear clustering feature, which cannot occur by chance from a random diffusion. These results confirm that lineage relationship influences the spatial distribution of inhibitory interneurons in the forebrain.
ETOC BLURB
In this study, Sultan et al. analyzed GABAergic interneuron output by progenitors in the medial ganglionic eminence (MGE) and preoptic area (PoA) at the population and clonal levels, and found that clonally related interneurons do not non-specifically disperse, but frequently form local clusters, in the forebrain.
INTRODUCTION
GABAergic interneurons are responsible for providing complex inhibition to support circuit operation and function in the forebrain, including the cortex, hippocampus, and striatum. A majority of these inhibitory interneurons are produced by progenitor cells in the MGE/PoA that express the homeodomain transcription factor NKX2.1 (Butt et al., 2008; Fogarty et al., 2007; Gelman et al., 2009; Kessaris et al., 2006; Sussel et al., 1999; Tricoire et al., 2011; Xu et al., 2008). In the cortex, more than 70% of inhibitory interneurons originate from the MGE/PoA. They migrate tangentially over long distances to reach their final destination for circuit assembly (Ayala et al., 2007; Marin and Rubenstein, 2001, 2003). The tangential migration of newborn cortical interneurons has been considered to be largely random, as migrating interneurons repeatedly change directions in an unpredictable manner (Ang et al., 2003; Tanaka et al., 2009). This random diffusion mode of migration is thought to be essential for interneuron dispersion throughout the cortex, although how this random dispersion of cortical interneurons with an extraordinary degree of diversity in cellular properties contributes to organized neuronal circuits in the cortex is an outstanding question.
Previous developmental and genetic studies have suggested that the temporal and spatial origins of cortical interneurons affect their subtype specification and distribution (Butt et al., 2005; Fogarty et al., 2007; Inan et al., 2012; Miyoshi et al., 2007; Nery et al., 2002; Taniguchi et al., 2013; Tricoire et al., 2011; Wichterle et al., 2001; Xu et al., 2004). Interneurons originating from the MGE/PoA express parvalbumin or somatostatin, and exhibit an overall birth date-dependent inside-out laminar layout in the cortex; that is, the early born interneurons mostly reside in the deep layers, whereas the late born interneurons largely locate in the superficial layers (Anderson et al., 2002; Butt et al., 2005; Miyoshi et al., 2007). Moreover, interneurons arising from the caudal ganglionic eminence (CGE), which express the ionotropic serotonin receptor 5HT3a (5HT3aR) and account for the remaining 20–30% of the population, predominantly occupy the superficial layers (Lee et al., 2010; Miyoshi and Fishell, 2011; Nery et al., 2002). While little is known about the control of the precise localization of individual interneurons in the cortex, these observations suggest that the developmental program of cortical interneurons influences their spatial localization at the population level.
Along this line, two independent studies investigated for the first time the effect of lineage relationship on spatial distribution of individual cortical interneurons arising from the MGE/PoA at the single progenitor level (Brown et al., 2011; Ciceri et al., 2013). By exploiting retrovirus-mediated infection in conjunction with mouse genetics, Brown et al. and Ciceri et al. selectively labeled individual dividing progenitor cells in the ventricular zone (VZ) of the MGE/PoA at the embryonic stage and analyzed the spatial distribution of their interneuron progeny in the cortex. Brown et al. took advantage of the exquisite fidelity of the interaction between the subgroup A avian sarcoma leukosis virus (ASLV) and its cognate receptor TVA (Gilbert et al., 1994), and achieved this by crossing R26LSL-TVAiLacZ, a knock-in mouse line that expresses TVA in a Cre recombinase-dependent manner (Seidler et al., 2008), with an Nkx2.1-Cre transgenic mouse line (Xu et al., 2008). Individual dividing progenitor cells expressing TVA at the VZ surface were then labeled by in utero intraventricular injection of serially diluted RCAS (replication-competent ASLV long terminal repeat with splice acceptor) retroviruses expressing fluorescent proteins (i.e. enhanced green fluorescent protein, EGFP or mCherry) at embryonic day (E) 12.5 (Brown et al., 2011). Ciceri et al. achieved this by in utero intraventricular injection of low-titer retroviruses carrying a reversed and double-floxed cDNA sequence encoding a fluorescent protein into Nkx2.1-Cre mouse embryos (Ciceri et al., 2013). The distribution of clonally related interneurons in the cortex labeled at a very low density was examined at postnatal day (P) 7–10 or 21–30. In Brown et al., on average ~4 cortical interneurons (4.1±2.5, n=36 brains; out of 6,892.0±99.4 MGE/PoA-derived cortical interneurons in total, n=3 brains) per 70 μm brain section were labeled (Figures S1A and S1B). Contrary to what would be expected from a random diffusion (Ang et al., 2003; Tanaka et al., 2009), both studies reliably observed local interneuron clusters in the cortex (Brown et al., 2011; Ciceri et al., 2013).
Given that no previous study has ever described such clustering of interneurons in the cortex, Brown et al. adopted the same spatial and geometrical parameters that reliably captured cortical excitatory neuron clonal clusters to quantitatively access cortical interneuron clonal clusters (Brown et al., 2011). About 40–50% of clonally labeled cortical interneurons were found in local clusters. Moreover, at the population level, clonally labeled cortical interneurons exhibited substantially shorter nearest neighbor distances (NNDs) than randomly simulated datasets, suggesting a strong clustering feature in spatial distribution. Our original statement “clonally labeled interneurons did not randomly disperse but formed spatially isolated clusters that were often more than 500 μm apart” meant that individual clusters, but not interneurons within individual clusters, were often more than 500 μm apart (Brown et al., 2011). Ciceri et al. used the distance-based dendrogram analysis and also reliably identified local clusters of clonally labeled interneurons in the cortex (Ciceri et al., 2013). These local clusters observed in both studies consist of ~2–6 interneurons and occupy the same lamina (e.g. horizontal) or span different laminas (e.g. vertical) (Brown et al., 2011; Ciceri et al., 2013). Notably, Ciceri et al. reported a similar percentage of intra-laminar (i.e. within one lamina) or inter-laminar (i.e. across 2 or more laminas) interneuron clusters in the cortex; Yet, both Mayer et al. and Garcia et al. stated that exclusively (intra-)laminar clusters were observed in this study (Mayer et al., 2016; Garcia et al., 2016). The findings by Brown et al. and Ciceri et al. suggest that clonally related cortical interneurons arising from the MGE/PoA do not randomly disperse, but frequently form local clusters in the cortex.
This view has recently been challenged by Mayer et al. (Mayer et al., 2015) and Harwell et al. (Harwell et al., 2015), in which a similar strategy to selectively label individual dividing progenitors in the MGE/PoA as in Brown et al. (Brown et al., 2011) was adopted. However, instead of using fluorescent protein-expressing RCAS retroviruses, these two studies used an RCAS retrovirus library expressing membrane-bound GFP as well as a diverse set of 24 base pair oligonucleotide barcodes, which in principle permit tracing the progenitor origin of labeled interneurons up to 105 diversity (Fuentealba et al., 2015; Golden et al., 1995; Walsh and Cepko, 1992).
Such a barcoded retroviral library can undoubtedly provide fine resolution on clonal identity and be powerful in delineating lineage progression and organization. For example, the non-barcoded datasets in Brown et al. and Ciceri et al. do not permit the assessment of clonal relationship of interneurons located in different brain structures (Brown et al., 2011; Ciceri et al., 2013), whereas the barcoded datasets in principle allow the inference of clonal relationship of any neurons with a successful barcode recovery. On the other hand, the actual diversity and individual barcode representation of the library needs to be carefully assessed, as this information is essential for a reliable interpretation of experimental data (Kirkwood et al., 1992). For example, in Mayer et al., a total of 127 barcodes were successfully recovered in all three experimental brains (Mayer et al., 2015). Among them, ~2% of the barcodes were found in more than one brain, indicating that at least ~2 out of 100 barcodes are disproportionally overrepresented in the library. Should the barcodes in a library with a 105 diversity be equally represented, the probability of observing more than two barcodes twice in 127 samples is less than 0.003%. Similarly, in Harwell et al., ~6% (1 out of 16; the barcode of clone 6) of the recovered barcodes were found in more than one brain (Harwell et al., 2015). Therefore, the precise diversity and representation of the library itself remains to be determined. In addition, a rather high failure rate in barcode recovery (e.g. ~57%) (Harwell et al., 2015) makes the interpretation of any single barcoded cell difficult, as it may represent a real single cell with no sibling or a failure in recovering its sibling. This is especially relevant when clone size is small, as in the case of MGE/PoA-derived interneuron clones examined in Mayer et al. and Harwell et al. (on average less than 3 sibling interneurons per clone) (Harwell et al., 2015; Mayer et al., 2015). Therefore, in our view it is necessary to exclude the single barcoded cells with no real siblings from quantitative clonal analysis; yet, both Harwell et al. and Mayer et al. mixed the abundant single barcoded cells and/or the labeled cells without a successful barcode recovery with bona-fide clones with more than one cell sharing the same barcode in the distance and clustering analysis (Harwell et al., 2015; Mayer et al., 2015). In comparison, both Brown et al. and Ciceri et al. essentially recovered and analyzed all labeled interneurons in the cortex (Brown et al., 2011; Ciceri et al., 2013). Furthermore, transcriptional silencing of retroviral vectors may compromise the accuracy of clonal analysis (Cepko et al., 2000; Halliday and Cepko, 1992; McCarthy et al., 2001).
Setting aside these caveats, a barcode library provides single-cell resolution of the lineage relationship of interneurons upon a successful recovery of barcodes. Based on this line of analysis, Mayer et al. concluded that “clone dispersion occurs across large areas of the brain and is not restricted by anatomical divisions. As such, sibling interneurons can populate the cortex, hippocampus and striatum… Altogether, our findings uncover that lineage relationships do not appear to determine interneuron allocation to particular regions…” Similarly, Harwell et al. concluded that “…clonally related interneurons can be widely dispersed while unrelated interneurons can be closely clustered. These data suggest that migratory mechanisms related to the clustering of interneurons occur largely independent of their clonal origin.”
However, we found that these conclusions do not faithfully recapitulate the actual experimental data, partly due to an incomplete analysis and presentation of the datasets. Therefore, with the cooperation of the previous authors (Harwell et al., 2015; Mayer et al., 2015), we performed essentially the same but in-depth analysis of the barcoded datasets from these two studies as well as new experiments, with a particular focus on addressing the following two essential questions: (1) Do a majority of interneuron clones disperse across different anatomic divisions or brain structures? (2) Do interneuron clones in the same brain structure, predominantly the cortex, reliably exhibit a clustering feature in spatial distribution? Notably, neither Brown et al. nor Ciceri et al. concluded that the spatial clustering of clonally related interneurons confines them to specific functional boundaries or radial units in the cortex (Brown et al., 2011; Ciceri et al., 2013; Sultan et al., 2013).
Based on a comprehensive series of analyses, we found that a majority (~70%) of bona fide MGE/PoA-derived interneuron clones in the barcoded datasets do not disperse broadly or widely across different forebrain structural boundaries as stated by Mayer et al. and Harwell et al., but are restricted in one forebrain structure, predominantly the cortex. Moreover, ~60% of local interneuron clusters are clonally related and at least ~50% of interneuron clones form local clusters in the same forebrain structure. These results confirm that progenitor origin and lineage relationship influence the spatial distribution of forebrain interneurons arising from the MGE/PoA.
RESULTS
Interneuron Output in Different Forebrain Structures by MGE/PoA Progenitor Cells
NKX2.1-expressing progenitor cells in the MGE/PoA produce GABAergic interneurons that distribute to the cortex, hippocampus, and striatum, globus pallidus, amygdala, and olfactory bulb (Gelman et al., 2009; Kessaris et al., 2006; Xu et al., 2008). Do individual progenitor cells give rise to interneurons predominantly located in just one or several brain structures? To address this, we first examined the overall distribution of MGE/PoA-derived interneurons in the four main destined brain structures including the cortex, hippocampus, striatum, and globus pallidus. We crossed Nkx2.1-Cre mice with Ai9-tdTomato reporter mice and performed systematic three-dimensional stereological quantification of the numbers of tdTomato-expressing interneurons in these four different brain regions at P21 (Figures 1A and S2), when interneuron neurogenesis, migration, and apoptosis are complete (Bortone and Polleux, 2009; Marin and Rubenstein, 2001; Southwell et al., 2012). We found that the total number of MGE/PoA-derived interneurons in the cortex, hippocampus, striatum, and globus pallidus was 963,286±111,964, 57,500±3,364, 60,735±5,814, and 1,319±124, respectively (Figure 1B). These results showed that interneurons produced by NKX2.1-expressing MGE/PoA progenitors were mostly located in the cortex (88.9±1.8%), with a relative small fraction in the hippocampus (5.4±0.7%), or striatum (5.7±1.0%) (Figure 1C).
Figure 1. Interneuron output of the MGE/PoA progenitors in the forebrain; See also Figures S1 and S2.
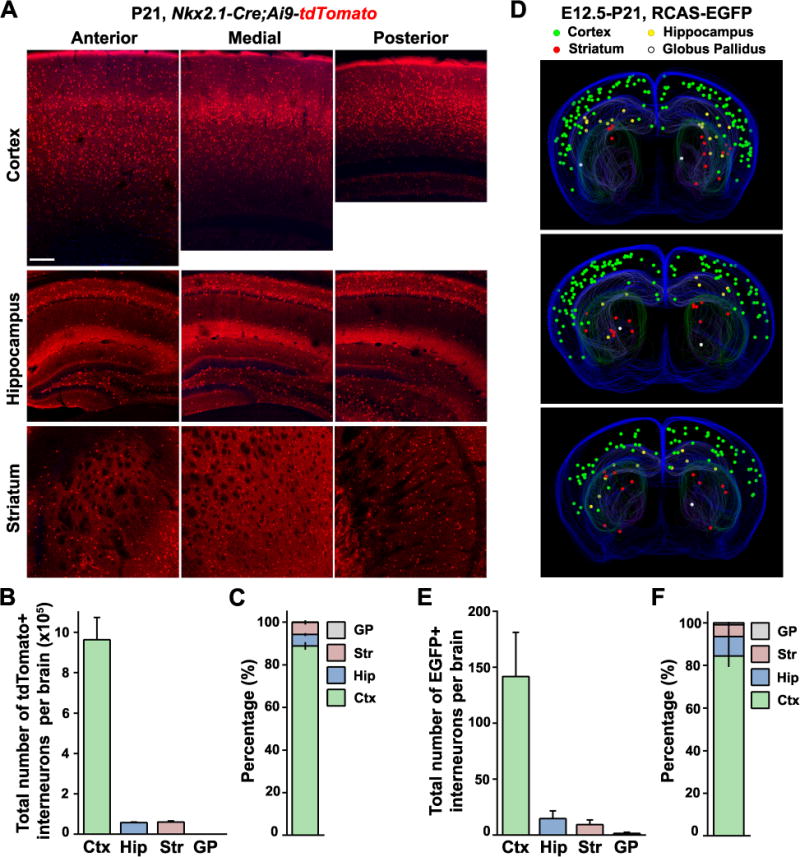
(A) Coronal sections of representative P21 Nkx2.1-Cre/Ai9-tdTomato brains showing tdTomato+ interneuron populations in the cortex (Ctx), hippocampus (Hip), and striatum (Str). Scale bar, 100 μm. (B–C) Quantification of the total number (B) and relative distribution (C) of tdTomato+ interneurons in the Ctx, Hip, Str and globus pallidus (GP). Bars represent mean ± S.D. (n=3 brains). (D) Three-dimensional stereological reconstructions of representative P21 brains that received intraventricular injection of low-titer RCAS retrovirus expressing EGFP at E12.5. Green, yellow, red, and white dots represent EGFP-labeled interneurons in the Ctx, Hip, Str, and GP, respectively. (E–F) Quantification of the total number (E) and relative distribution (F) of EGFP+ interneurons in the Ctx, Hip, Str, and GP labeled using in-utero intraventricular RCAS-EGFP injection at E12.5. Data are presented as mean ± SD (n=7 brains).
In the Nkx2.1-Cre/Ai9-tdTomato mice, the total number of tdTomato-expressing interneurons in each brain structure reflects the cumulative neurogenic output of MGE/PoA progenitor cells over the entire embryonic neurogenesis period. It is possible that dividing MGE/PoA VZ progenitor cells at a particular embryonic stage (e.g. E12.5, the main time point analyzed in Mayer et al. (Mayer et al., 2015) and Harwell et al. (Harwell et al., 2015)) generate interneurons preferentially located in one or more brain regions. To explicitly assess interneuron output of dividing MGE/PoA VZ progenitor cells at E12.5 in different brain structures, we performed in utero intraventricular injection of low titer RCAS retroviruses expressing EGFP into Nkx2.1-Cre/R26LSL-TVAiLacZ mice at E12.5, which selectively infected dividing VZ progenitor cells at the VZ surface as shown in our previous study (Brown et al., 2011) as well as in Mayer et al. (Mayer et al., 2015) and Harwell et al. (Harwell et al., 2015), and performed stereological quantification of the number of EGFP-expressing interneurons in different forebrain structures (Figure 1D). The total number of EGFP-expressing interneurons located in the cortex, hippocampus, striatum, and globus pallidus was 141.9±39.3, 14.7±6.9, 9.4±4.3, and 1.6±1.0, respectively (Figure 1E). These results showed that, similar to the total interneuron output by MGE/PoA progenitor cells, the majority of interneuron progeny of dividing MGE/PoA VZ progenitor cells at E12.5 was located in the cortex, with a relatively small fraction in the hippocampus or striatum (Figure 1F).
Do A Majority of Interneuron Clones Randomly and Widely Disperse across Different Forebrain Structures?
Having estimated the total output of interneurons in the cortex, hippocampus, striatum, and globus pallidus by all MGE/PoA progenitor cells (Figures 1A–C), and the interneuron output in different forebrain regions by dividing MGE/PoA VZ progenitor cells at E12.5 (Figures 1D–F), it became possible to estimate the fraction of interneuron clones that span one or more brain structures, based on the clone size and a non-specific wide dispersion. The Mayer et al. (Mayer et al., 2015) and Harwell et al. (Harwell et al., 2015) datasets with single cell resolution of clonal identity showed that the average size of MGE/PoA-derived interneuron clones was ~2.6 (2.6±1.1, n=32). If the observed 32 clones in Mayer et al. (Mayer et al., 2015) non-specifically and widely disperse in the four forebrain structures, the predicted probability of a clone spanning different brain structures based on the total population output is: cortex only, 74.0±7.6%; hippocampus only, 0.2±0.8%; striatum only, 0.2±0.8%; cortex-hippocampus, 11.5±5.5%; cortex-striatum, 12.3±5.8%; cortex-globus pallidus, 0.2±0.9%; hippocampus-striatum, 0.4±1.1%; and cortex-hippocampus-striatum, 1.1±1.8% (Figures 2A and S3A). Similarly, the expected probability based on the relative interneuron output by E12.5 dividing MGE/PoA VZ progenitor cells is: cortex only, 66.8±8.2%; hippocampus only, 0.5±1.2%; striatum only, 0.2±0.1%; cortex-hippocampus, 17.5±6.6%; cortex-striatum, 10.2±5.4%; cortex-globus pallidus, 2.2±2.6%; hippocampus-striatum, 0.6±1.4%; and cortex-hippocampus-striatum, 1.4±2.1% (Figures 2B and S3B). Interestingly, a substantially higher fraction of clones located only in the hippocampus or striatum were observed in Mayer et al. experimental dataset than in the predicted datasets based on a non-specific and wide dispersion model (Figures 2A, 2B, S3A, and S3B), suggesting that a significant number of MGE/PoA progenitors likely generate interneurons located selectively in the hippocampus or striatum.
Figure 2. MGE/PoA-derived interneuron clones in Mayer et al. do not randomly disperse in different forebrain structures, but are mostly located in the cortex or the cortex and hippocampus; See also Figures S2 and S3, and Table S1.
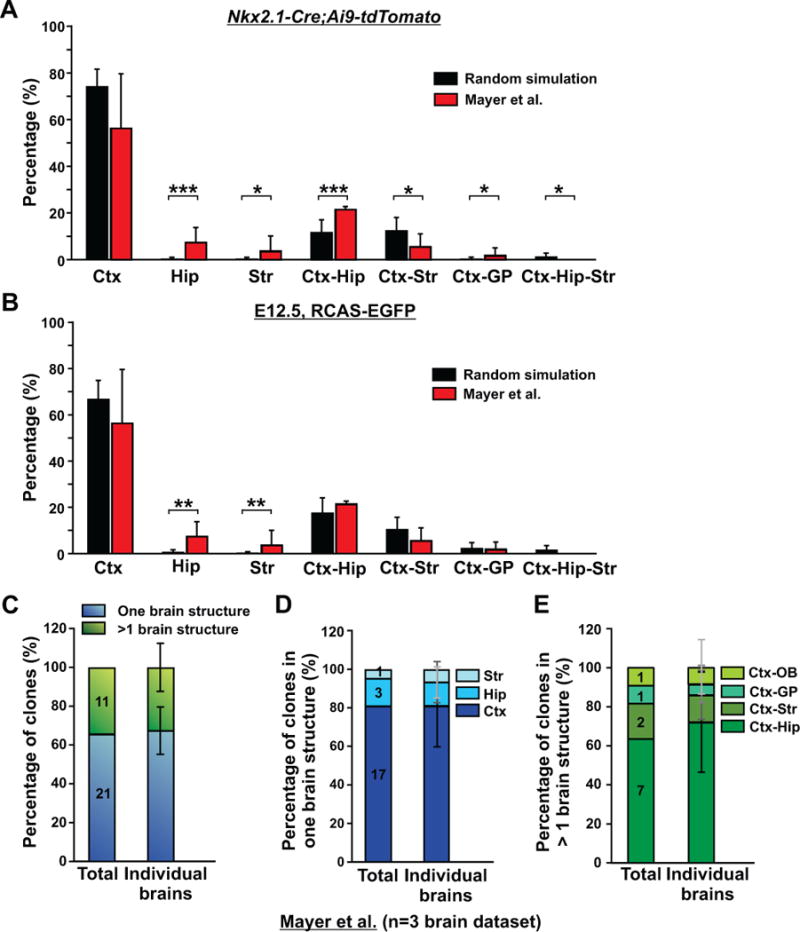
(A) Comparison of the fractions of clones located in the four brain structures (Ctx, Hip, Str, and GP) in the experimental data (red bars) with the predicted probabilities of clone distribution based on a random dispersion and the relative ratio of total MGE/PoA interneuron output to the four structures in P21 Nkx2.1-Cre/Ai9-tdTomato brains (black bars). Data are presented as mean ± S.D. (*, p< 0.05; ***, p<0.001). (B) Comparison of the fractions of clones located in the four brain structures (Ctx, Hip, Str, GP) in the experimental data (red bars) with the predicted probabilities of clone distribution based on a random dispersion and the relative ratio of the interneuron output of E12.5 dividing MGE/PoA VZ progenitor cells to the four structures labeled using in-utero intraventricular RCAS-EGFP injection (black bars). Data are presented as mean ± S.D. (**, p<0.01). (C) Quantification of the percentage of interneuron clones that are restricted to one brain structure (blue) or span more than one brain structure (green). Data are presented as mean ± S.D. (n=3 brains). (D) Quantification of the percentage of interneuron clones restricted to the cortex, hippocampus, or striatum (n=3 brains). (E) Quantification of the percentage of interneuron clones spanning different brain structures (n=3 brains). Ctx, cortex; Hip, hippocampus; Str, striatum; GP, globus pallidus; OB, olfactory bulb.
We also estimated clone distribution in different brain structures based on the regional distribution of clonally related interneurons with a successfully recovered barcode in Mayer et al., and found that there were significant differences between the experimental data and the predicted data based on a non-specific and wide dispersion (Figure S4), again indicating that regional distribution of clonally related interneurons in different forebrain structures is unlikely to be nonspecific. However, given the significantly incomplete barcode recovery, the regional distribution of labeled interneurons based on this experimental dataset is probably less accurate than the other two experimental datasets (Figure 1).
Notably, in Mayer et al. containing three reconstructed barcoded brain datasets (Mayer et al., 2015), more than 53% (17 out of 32) of interneuron clones were restricted to the cortex (Figure 2D) and more than 65% (21 out of 32) of clones were restricted to one brain structure (i.e. the cortex, hippocampus, or striatum only) (Figure 2C). For the remaining ~34% (11 out of 32) of clones spanning more than one brain structure, a majority (more than 60%; 7 out of 11) were in the cortex and hippocampus (also called the paleocortex) (Figure 2C and 2E), the two highly related brain regions developing as one continuous structure in the dorsal telencephalon that express a cohesive set of transcription factors including Emx1/2 and Pax6 (Hebert and Fishell, 2008). In fact, only ~12.5% (4 out of 32) of clones were dispersed in more than one developmentally unrelated brain structure such as the cortex and striatum, or the cortex and globus pallidus. Similar results were reported in Harwell et al. (Harwell et al., 2015). Specifically, 80% (12 out of 15 after error correction of the original dataset; 11 out of 15 before error correction; see Experimental Procedures for details) of clones were restricted to one brain structure (Figure 3), although there was only one reconstructed barcoded brain dataset (i.e. two hemispheres) in this study and the contours of different forebrain structures were not well delineated and aligned.
Figure 3. MGE/PoA-derived interneuron clones in Harwell et al. are mostly restricted to the cortex; See also Table S2.
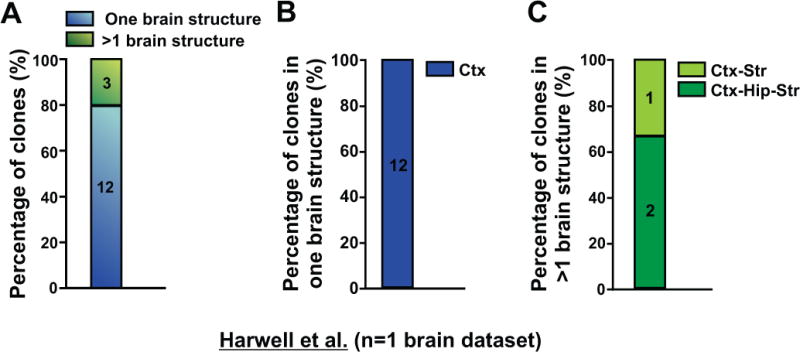
(A) Quantification of the percentage of clones that are either restricted to one brain structure (blue) or span more than one brain structure (green). (B) Quantification of the percentage of clones restricted to one brain structure (n=2 hemispheres). (C) Quantification of the percentage of clones spanning more than one brain structure (n=2 hemispheres). Ctx, cortex; Hip, hippocampus; Str, striatum.
Taken together, these results clearly suggest that interneuron clones originating from the MGE/PoA do not non-specifically and widely disperse in the forebrain. The vast majority of clones are restricted in the cortex, or the cortex and hippocampus, the two highly related brain structures in both development and function. Moreover, the clonal or progenitor origin likely influences the spatial distribution of sibling interneurons in different forebrain structures.
Do Interneuron Clones in the Same Brain Structure Form Clusters Reliably?
Live imaging studies showed that tangential migration of MGE/PoA-derived interneurons to the cortex/hippocampus appears to be random (Ang et al., 2003; Tanaka et al., 2009). Yet, Brown et al. and Ciceri et al. reliably observed local clusters of clonally labeled interneurons in the cortex (Brown et al., 2011; Ciceri et al., 2013). This lineage-dependent clustering feature is unexpected and can be a fundamental organizing principle of cortical interneurons. However, based on their analysis of interneuron clones in the same brain structure (predominantly the cortex) labeled by distinct barcodes, Mayer et al concluded that “while sibling interneurons may occasionally form coherent clusters, the final positions of clonally related interneurons are most often not constrained by lineal relationships or point of origin” (Mayer et al., 2015). Similarly, Harwell et al. concluded that “MGE interneurons derived from a common progenitor are widely dispersed across different regions of the brain and that the majority of clustered cells observed with sparse viral labeling are likely not clonally related” (Harwell et al., 2015).
Mayer et al. analyzed the clustering solely based on distance measurement (Mayer et al., 2015), which can be inaccurate for the following reasons. First, a clone forming a local cluster does not necessarily preclude the presence of any nearby non-clonally related interneurons (Figure S5A). In other words, interneuron clonal clusters may occupy the same or nearby space, which did appear in the experimental datasets (broken black lines, Figure 4A). Clustering in spatial distribution is relative to a wide and non-specific dispersion, but does not necessarily correspond to the absolute shortest distance between the data points per se. Second, distance measurement is strongly influenced by the total number of data points in individual datasets. The more data points, the shorter the distance in general between them. Therefore, it is crucial to take into consideration the total number of data points in each dataset. Mayer et al. and Harwell et al. included all the single barcoded cells and/or the labeled cells without a barcode that often outnumbered the bona fide clones (i.e. more than one cell sharing the same barcode) in the distance and/or clustering analysis, which distorts the outcome and interpretation (Harwell et al., 2015; Mayer et al., 2015).
Figure 4. Interneuron clones in Mayer et al. reliably form local clusters; See also Figure S5.
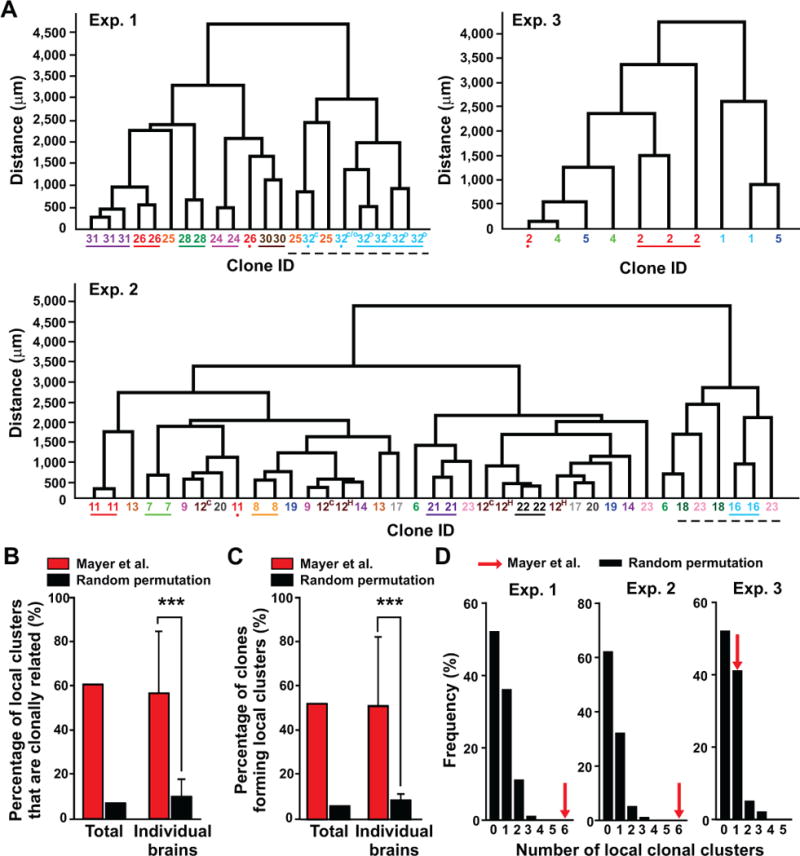
(A) Dendrograms of individual datasets containing multi-cell clones in the same brain structures according to their Euclidean distances. Numbers and colors indicate the lineal relationship between two or more cells based on the recovered barcodes. Colored lines below the numbers indicate spatially isolated clonal clusters. Colored dots mark a sibling neuron located away from the corresponding clonal cluster. Broken black lines indicate local clonal clusters occupying the same or nearby space. The superscript letters indicate the location of the same clone in different brain structures (C, cortex; H, hippocampus; O, olfactory bulb; C/O, cortex or olfactory bulb, uncertain based on the x-y-z spatial coordinates). (B) Quantification of the percentage of local clusters (i.e. the lowest hierarchical branch in the dendrogram) that are clonally related in the experimental dataset (red bars) compared with the percentage estimated from random permutations (i.e. reshuffling) of the clonal identity in the same dendrograms repeated for 100 rounds (black bars). Data are shown as the total percentage in the whole dataset as well as mean ± S.D. (n=3 brains) (***, p<0.001). (C) Quantification of the percentage of clones that form local clusters in the experimental dataset (red bars) compared with the percentage estimated from random permutations of the clonal identity in the same dendrograms repeated for 100 rounds (black bars). Data are shown as the total percentage in the whole dataset as well as mean ± S.D. (n=3 brains) (***, p<0.001). (D) Histograms showing the frequency of local clonal clustering estimated from random permutations of clones. Red arrows indicate the number of local clonal clusters observed in each of the three experimental datasets.
Even based on the Euclidean (i.e. straight-line) distance dendrogram analysis that Mayer et al. performed (Mayer et al., 2015), sibling interneurons in the same brain structure did not just “occasionally” form local clusters. We corrected several errors in the clonal composition and regional identity (Table S1; also see Experimental Procedures for details), and updated the dendrograms of all multi-cell clones that were restricted to one brain structure (Figure 4A). The average clone size in the same brain structure is ~2.4 (2.4±0.7, n=29). Notably, ~61% (14 out of 23; Exp. 1, 7 out of 8; Exp. 2, 6 out of 12; Exp. 3, 1 out of 3) of the closest local two-interneuron clusters (i.e. the lowest hierarchical branch in the dendrogram) were clonally related siblings (Figure 4B). In addition, ~52% (14 out of 27 clones including 21 multi-cell clones restricted to one brain structure as well as 6 additional multi-cell clones that spanned more than one brain structure but with 2 or more cells in one brain structure; Exp. 1, 6 out of 7; Exp. 2, 7 out of 16; Exp. 3, 1 out of 4) of sibling interneurons in the same brain structure formed the local closest cluster (Figure 4C). We also observed two or more clonal clusters occupying a similar local space (black broken lines, Figure 4A). Together, these results clearly suggest that the formation of local clonal clusters does not occur only occasionally, but is a reliable feature of MGE/PoA-derived interneurons.
To test whether this lineage-related spatial organization could occur by chance from a widely and non-specific distribution of clonally related interneurons, we performed random permutations (i.e. reshuffling) of clonal identity in individual experimental datasets for 100 rounds, and found that both the probability of observing clonally related local clusters and the probability of clones forming local clusters were substantially lower than those in the experimental datasets (Figures 4B and 4C). In fact, the chances of observing six local clusters of sibling interneurons in the randomly permutated datasets for Exp. 1 or 2 were zero (Figure 4D). The highest number of local clonal clusters that occurred in the permutated datasets was three and it occurred at a rate of 1 out of 100. These results suggest that the formation of local clonal clusters in the experimental datasets cannot occur by chance through a random and wide dispersion of sibling interneurons.
To further quantitatively analyze the spatial organization of interneuron clones, we examined the average intra-clonal and inter-clonal Euclidean distances in individual experimental datasets, which reflect the spatial segregation of individual clones (Figures S5B and 5A). Should individual clones be spatially segregated, the intra-clonal distance would be significantly shorter than the inter-clonal distance. We focused on the bona fide interneuron clones with more than one cell sharing the same barcode (i.e. no single barcoded cells or labeled cells without a successful barcode recovery included in the analysis). Indeed, in all three experimental datasets in Mayer et al. (Mayer et al., 2015), the average intra-clonal distance was consistently shorter than the average inter-clonal distance for the vast majority of clones when they were analyzed in individual brains (Figures 5A and 5B). Similar results were obtained when the clones were analyzed in individual hemispheres (Figures S6). These results suggest that in general clones are spatially segregated (i.e. clustered). Next, we compared the spatial distribution of the bona fide interneuron clones with that of all single barcoded cells in individual datasets by analyzing the average “inter-clonal” distances between individual clones and all single barcoded cells as a “clone”, as well as the average “intra-clonal” distances of all single barcoded cells (Figures 5A, 5B, and S6). These single barcoded, non-clonally related cells were born at a similar time as clonally related cells in the datasets, thereby serving as a good experimental control. The average “inter-clonal” distances of the total single barcoded cell clones were comparable to the average “intra-clonal” distance, consistent with the fact that the single barcoded cells are not obviously clustered. Moreover, the average “inter-clonal” distance of the total single barcoded cell clones was consistently longer than the intra-clonal distance of a vast majority of interneuron clones, confirming that clonally related interneurons are spatially clustered. As a result, the histogram of intra-clonal distances contained a significantly higher fraction of short distances than that of inter-clonal distances, as well as “inter-clonal” or “intra-clonal” distances of all single barcoded cells (Figure 5C). Taken together, these results clearly indicate that the spatial distribution of clonally related interneurons is fundamentally different from that of all single barcoded cells and reliably exhibits a clustering feature.
Figure 5. Interneuron clones in Mayer et al. are spatially segregated in the brain; See also Figures S5 and S6.
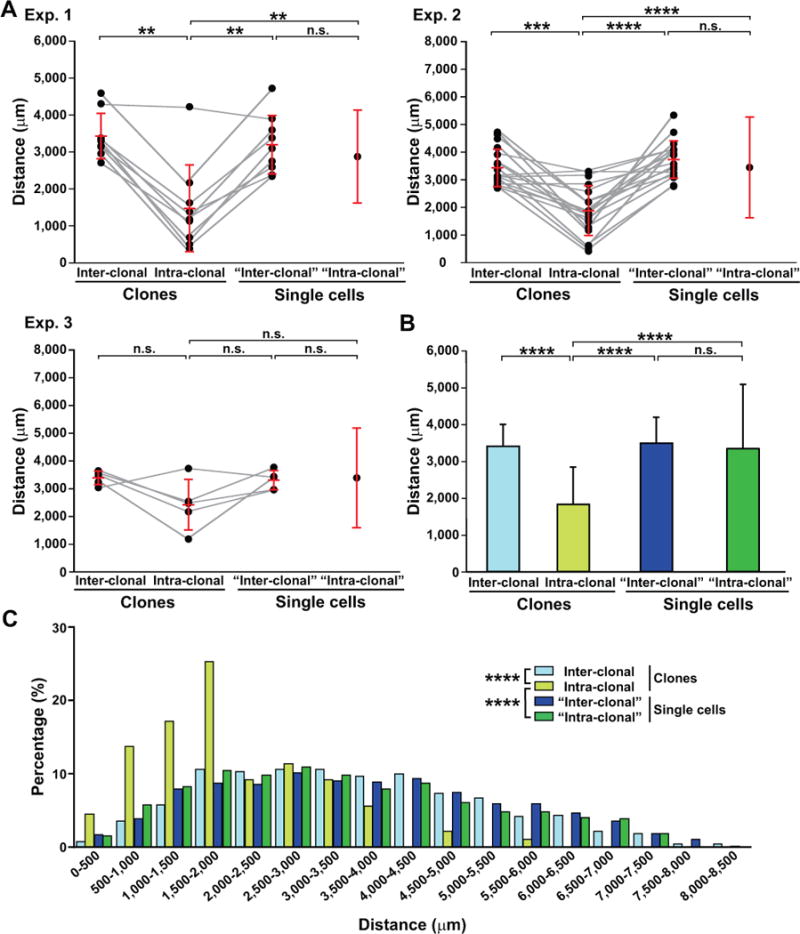
(A) Quantification of the average intra-clonal and inter-clonal Euclidean distances for individual clones in each experimental brain dataset. The “inter-clonal” and “intra-clonal” distances for single cells represent the average distance between individual clones and all single barcoded cells as a “clone”. Each black dot represents the average distance for an individual clone. Red lines represent mean ± S.D. (**, p<0.01; ***, p<0.001; ****, p<0.0001; n.s., not significant). (B) Quantification of the average inter-clonal and intra-clonal distances for all clones and single cells. Data are presented as mean ± S.D. (n=3 brains; ****, p<0.0001; n.s., not significant). (C) Histograms of inter-clonal and intra-clonal distances for clones and single cells in all experimental brains (n=3 brains; Chi-square test: ****, p<0.0001).
In Harwell et al. (Harwell et al., 2015), the quantitative analysis of the barcoded interneuron clones was based on a single brain dataset (i.e. two hemispheres) with a poor brain structure contour tracing and alignment (Figure S7; see Experimental Procedures). Notably, the original analysis showed that clonally labeled interneurons exhibited significantly shorter NNDs in the range of 200–500 μm than the spatially random simulated ones, indicating that clonally labeled interneurons display a clustering feature in spatial distribution. On the other hand, Harwell et al. compared the NNDs between sibling interneurons (n=39 interneurons/15 clones), single barcoded interneurons (i.e. unrelated, n=97 interneurons), or all labeled interneurons (with or without a recovered barcode; n=284 interneurons) in the whole brain or in the cortex only (siblings, n=31 interneurons; unrelated, n=80 interneurons; all, n=216 interneurons). Based on the observation that the NNDs between sibling interneurons were significantly larger than those between unrelated single barcoded interneurons, Harwell et al. concluded that “more closely clustered cells are derived from independent clonal lineages.” Given the NND measurement is strongly influenced by the total number of data points in the dataset (i.e. the more data points, the shorter NNDs in general), this line of analysis is clearly inaccurate in depicting the spatial distribution of clonally related or unrelated interneurons. For example, the NNDs of unrelated single barcoded interneurons were significantly larger than those of all labeled interneurons. Should clonally related interneurons be widely dispersed, all labeled interneurons including clonally related and unrelated interneurons are not expected to be more closely clustered than unrelated single barcoded interneurons. Similar issues existed in the NND and average distance analysis in Mayer et al. (Mayer et al., 2015).
To rigorously assess the spatial distribution of interneuron clones in the Harwell et al. brain dataset, we realigned the dataset (Figure S7), corrected the errors in clonal assignment and spatial coordinates of the labeled multi-cell clones (Table S2; also see Experimental Procedures), and performed the same set of quantitative analysis as for Mayer et al. datasets (Figure 6). The Euclidean distance dendrogram analysis of all multi-cell clones with two or more cells in one brain structure showed that 60% of local two-interneuron clusters (6 out of 10) were clonally related (Figures 6A and 6B) and that ~46% of sibling interneurons in the same brain structure (6 out of 13 including 12 clones restricted in one brain structure as well as one clone that spanned more than one brain structure but with two or more cells in one brain structure) formed local clusters (Figures 6A and 6C). This rate of local clonal cluster formation was much higher than that in the random dataset (Figures 6B–D). Moreover, we found that the intra-clonal distance was significantly shorter than the inter-clonal distance, or the “inter-clonal” or “intra-clonal” distance of all single barcoded cells for a majority of interneuron clones (Figure 6E). As a result, the overall intra-clonal distance was significantly shorter than inter-clonal distance or the “inter-clonal” or “intra-clonal” distance of all single barcoded cells (Figure 6F), indicating that interneuron clones in this single brain dataset also exhibit a clear clustering feature in spatial distribution.
Figure 6. Interneuron clones in Harwell et al. exhibit a clustering feature in spatial distribution; See also Figure S7 and Table S2.

(A) Dendrograms of the left and right hemispheres of the single barcoded experimental dataset according to the Euclidean distances of multi-cell clones in the same brain structure. Numbers and colors indicate the lineal relationship between two or more cells based on the recovered barcodes. Colored lines below the numbers indicate spatially isolated clonal clusters. Colored dots mark a sibling neuron located away from the corresponding clonal cluster. Broken black lines indicate local clonal clusters occupying the same or nearby space. (B) Quantification of the percentage of local clusters (i.e. the lowest hierarchical branch in the dendrogram) that are clonally related in the experimental dataset (red bars) compared with the percentage estimated from random permutations of the clonal identity in the same dendrograms repeated for 100 rounds (black bars). Data are shown as the total percentage in the whole dataset as well as mean ± S.D. (n= 2 hemispheres). (C) Quantification of the percentage of clones that form local clusters in the experimental dataset (red bars) compared with the percentage estimated from random permutations of the clonal identity in the same dendrograms for 100 rounds (black bars). Data are shown as the total percentage in the whole dataset as well as mean ± S.D. (n=2 hemispheres). (D) Histograms showing the frequency of local clonal clustering estimated from random permutations of clones. Red arrows indicate the number of local clonal clusters observed in the experimental dataset. (E) Quantification of the average intra-clonal and inter-clonal Euclidean distances for individual clones in each experimental dataset. The “inter-clonal” and “intra-clonal” distances for single cells represent the average distance between individual clones and all single barcoded cells as a “clone”. Each black dot represents the average distance for an individual clone. Red lines represent mean ± S.D. (*, p<0.05; ***, p<0.001; n.s., not significant). (F) Quantification of the average inter-clonal and intra-clonal distances for all clones and single cells. Data are presented as mean ± S.D. (n=2 hemispheres; *, p<0.05; **, p<0.01; ***, p<0.001; n.s., not significant).
DISCUSSION
We previously showed that the VZ progenitor cells in the MGE/PoA are radial glial cells in nature (Brown et al., 2011). They undergo asymmetric division at the VZ surface to self-renew and to simultaneously produce post-mitotic interneurons or intermediate progenitor cells that symmetrically divide in the subventricular zone to produce interneurons. The progeny of individual radial glial progenitor cells initially remain closely associated with their mother progenitor cells, forming a radially organized clonal cluster. Consistent with our findings, Mayer et al. and Harwell et al. also reported asymmetric radial glial progenitor cell division at the VZ surface and symmetric intermediate progenitor cell division in the subventricular zone, as well as radial arrays of clonal clusters in the MGE/PoA (Harwell et al., 2015; Mayer et al., 2015).
As development proceeds, newborn interneurons in the MGE/PoA migrate tangentially to the dorsal telencephalon including the cortex and hippocampus, or to the ventral telencephalon including the striatum and globus pallidus. Based on our systematic genetic tracing and stereological quantification, the vast majority (>90%) of interneuron progeny of MGE/PoA progenitor cells are destined for the cortex (80–85%) or hippocampus (5–10%). Consistent with this, Brown et al. showed that 96.1±0.2% interneuron progeny generated by dividing MGE/PoA VZ progenitors at E12.5 were found in the cortex or hippocampus (Brown et al., 2011). Without the single cell resolution in clonal identity, it is impossible to assess clonal relationship across different brain structures. Therefore, we focused our analysis in the cortex, which harbored the vast majority (~90%) of labeled interneurons (Brown et al., 2011). Similarly, Ciceri et al. focused on the examination of the cortex (Ciceri et al., 2013). The overall progenitor labeling strategy in Mayer et al. and Harwell et al. was the same as in our previous study (Brown et al., 2011; Harwell et al., 2015; Mayer et al., 2015). Consistent with this, the output and regional distribution of interneuron progeny was similar across all three studies. In addition, the overall labeling density of interneurons in the cortex was comparable between Brown et al. and Harwell et al. (Brown et al., 214.0±130.8 interneurons per brain, n=36 brains; Harwell et al., 216 interneurons, n=1 brain; Figures S1C–E). Mayer et al. did not explicitly report the exact regional identity of the single barcoded cells, nor any information (i.e. the number and location) on the labeled cells without a successful barcode recovery. To estimate the labeling density in the cortex of these datasets, we inferred the regional location of the single barcoded cells from the original reconstructed data and adjusted the “actual” labeling density based on ~57% barcode recovery failure rate reported in Harwell et al. (Harwell et al., 2015) (Figure S1C–E). While the average labeling density in the cortex in Brown et al. (214.4±130.8 interneurons per brain, n=36 brains) was higher than that in Mayer et al. (92.3±47.5 interneurons per brain, n=3 brains), a significant fraction (~47.2%; 17 out of 36) of the brains in Brown et al. had a comparable labeling density in the cortex to those in Mayer et al. Moreover, we found that the distribution of clonally labeled interneurons in the cortex across the range of labeling density in Brown et al. exhibited a similar clustering feature, as revealed by the NND analysis (Figure S1F).
Our previous clonal analysis and Ciceri et al. revealed local clusters of interneurons in the cortex (Brown et al., 2011; Ciceri et al., 2013), suggesting that clonally related interneurons form local clusters when they reach their final destination. The size of these local interneuron clusters (~2–6) matches with the overall size of interneuron clones (~2–6) detected in the barcoded datasets (Harwell et al., 2015; Mayer et al., 2015). The average size of MGE/PoA-derived interneuron clones is ~2.6 (Mayer et al., a total of 84 sibling interneurons in 32 multi-cell clones; Harwell et al., a total of 39 sibling interneurons in 15 multi-cell clones) (Harwell et al., 2015; Mayer et al., 2015). Given the capacity of radial glial progenitor cell asymmetric division and intermediate progenitor cell symmetric division in the MGE/PoA, the individual clone size is surprisingly small. The embryonic mosaic analysis of double markers (MADM) showed that the average clone size for a 3-day labeling period (i.e. E10-E13) was more than 20 cells (Mayer et al., 2015). It is expected that retroviral labeling only occurs in one of the two daughter cells of the dividing progenitor cells (i.e. half of the clone). Nonetheless, the actual clone size in the mature brain appeared significantly smaller than expected. In addition, the size of the clones labeled at E10.5 appeared to be the same as that labeled at E12.5, despite the fact that the size of embryonic E10-E13 clones (i.e. labeled at E10 and examined at E13) were larger than that of E10-E12 clones (i.e. labeled at E10 and examined at E12) (Harwell et al., 2015; Mayer et al., 2015). A number of possibilities may account for these unexpected observations, including incomplete sibling cell recovery, extensive cell death during postnatal development (Southwell et al., 2012), or silencing of retroviral insertion. Mayer et al. suggested a significant amount of retroviral silencing, although neither the average size nor the relative distribution of the clones was affected (Mayer et al., 2015). In contrast, Harwell et al. did not detect any significant retroviral silencing (Harwell et al., 2015). It is also possible that the current embryonic clonal analysis failed to document small clones. Future systematic dissection of progenitor behavior and neurogenesis in the MGE/PoA will help to resolve this.
Keeping these issues in mind, the barcoded datasets provide interesting insights on interneuron production and spatial distribution in the forebrain. Consistent with our previous observation (Brown et al., 2011), a substantial fraction of barcoded clones contained a mixture of parvalbumin- and somatostatin-expressing interneurons, confirming that a significant population of MGE/PoA progenitor cells is capable of producing different interneuron subtypes. Should lineage relationship have no influence on interneuron distribution, the relatively total interneuron output to different forebrain structures and the small clone size dictate that virtually all clones must be located in the cortex, the cortex and hippocampus, or the cortex and striatum. Interestingly, a significant fraction of clones was observed to be restricted to the hippocampus or striatum (Mayer et al., 2015), suggesting that some MGE/PoA progenitors specifically produce interneurons destined for these two brain structures. To our knowledge, no previous study has indicated this. While it is evident that the majority (~66% in Mayer et al. and 80% in Harwell et al.) of clones are located within one brain structure, e.g. the cortex, some are dispersed in more than one brain structure. However, this clonal dispersion largely occurs between the cortex and hippocampus, the two highly related forebrain structures emerging side-by-side in the dorsal telencephalon. The same tangential migration routes are responsible for interneuron distribution in the cortex and hippocampus (Ayala et al., 2007; Marin and Rubenstein, 2001, 2003). In comparison, only a small fraction (~12.5% in Mayer et al. and 20% in Harwell et al.) of clones is dispersed between developmentally unrelated brain structures such as the cortex and striatum, or globus pallidus, or olfactory bulb. Multiple progenitor cell domains with combinatorial expression of transcription factors in the MGE/PoA have previously been suggested (Flames et al., 2007). While it is unclear whether progenitor cells responsible for generating clones located in the same or different brain structures are distinct in their properties, our analysis clearly suggests that the distribution of lineage-related interneurons in different forebrain structures is not random.
Our previous study and Ciceri et al. found that interneurons labeled at clonal density frequently form local clusters in the cortex (Brown et al., 2011; Ciceri et al., 2013). Without single cell resolution of clonal identity, whether these clusters are truly clonally related remains unconfirmed. On the other hand, if clonally related interneurons with an average size of 2–3 cells are widely dispersed in the cortex, it is difficult to imagine that sparsely labeled interneurons at clonal density (e.g. ~4 labeled cortical interneurons per 70 μm brain section in Brown et al.) could ever frequently form local clusters. It has been postulated that interneurons generated from different progenitors at the same time might be exposed to similar environmental cues, thereby migrating to similar positions (Ciceri et al., 2013; Gil-Sanz and Muller, 2015). Given the extensive neurogenesis occurring in the MGE/PoA during the peak neurogenic phase (e.g. E12.5), a large cohort of interneurons is most probably generated at any particular moment. Therefore, it is unclear how a small number of interneuron progeny arising from sparsely labeled dividing progenitor cells could effectively form local clusters after an extensive tangential migration over days. In this context, it is remarkable that all four labeled interneurons in the olfactory bulb shared the same barcode, and their remaining two siblings were in a close proximity (Mayer et al., 2015). Retrovirus particle clumping has also been implicated to cause simultaneous infections of nearby dividing progenitor cells, whose progeny may then form local clusters in the cortex at the completion of their tangential migration. Should this be the case, it would argue that interneuron progeny distribution in the cortex is tightly coupled to their corresponding progenitor localization in the MGE/PoA, again suggesting that the progenitor origin influences cortical interneuron spatial distribution.
Harwell et al. reported local clusters of interneurons expressing EGFP or mCherry in brains infected with a mixture of retroviruses expressing EGFP or mCherry (Harwell et al., 2015). Based on this, it was concluded that the local interneuron clusters are mostly non-clonal. Surprisingly, in the example images of such a mixed cluster provided in Harwell et al., a majority of EGFP-expressing interneurons co-expressed mCherry, indicating that the labeling with mCherry is unlikely to have been at clonal density. Indeed, in our experiments using a mixture of serially diluted low-titer retroviruses expressing EGFP or mCherry, we rarely observed interneurons expressing both EGFP and mCherry, or mixed clusters of interneurons expressing EGFP or mCherry (Brown et al., 2011). We also rarely observed simultaneously labeled nearby dividing progenitor cells in the MGE/PoA VZ expressing EGFP and/or mCherry upon low-titer retrovirus injection at E12.5 or thereafter (Brown et al., 2011; Tan et al., 2016).
Even if we focus on the barcoded datasets, it is clear that local interneuron clonal clusters can be reliably found (Harwell et al., 2015; Mayer et al., 2015). About 60% of local two-interneuron clusters were clonally related and ~50–60% of interneuron clones in the same brain structure formed local clusters. This rate of local clonal cluster formation could not result from a random and wide dispersion of clonally related interneurons. The dendrogram-based detection of clonal clusters likely leads to an underestimation, because two small clonal clusters may occupy the same or nearby space, as shown in the barcoded experimental datasets (e.g. broken black lines in the dendrograms). This would compromise the identification of local clonal clusters simply based on the shortest distance assessment. The spatial distribution of individual interneuron clones was certainly not uniform. Some clones were distributed more widely than others, some local clonal clusters were tighter than others, and some clones were in proximity of other clones. In addition, a few clones appeared to form a local cluster with a distantly distributed sibling. Given that ~2–6% of barcodes are over-represented, it is formally possible that these split clones are partly due to multiple infections with virions having the same barcode. Regardless of individual clonal variability in spatial distribution, it is important to emphasize that at the population level, the intra-clonal distance of clonally related interneurons was significantly shorter than their inter-clonal distance, indicating that individual clones are spatially segregated. In contrast, non-clonally related single barcoded cells in the datasets did not exhibit this type of spatial segregation. These results suggest that at both individual clone and population levels, clonally related interneurons exhibit a clear clustering in spatial distribution.
Notably, Mayer et al. and Harwell et al. stated that the NND or average distance between clonally related interneurons is not statistically shorter than the NND or average distance between all labeled interneurons with a barcode (Harwell et al., 2015; Mayer et al., 2015). In Mayer et al., all the single barcoded cells without any true siblings were included in the inter-clonal (i.e. non-clones) distance analysis. Similarly, Harwell et al. included all the single barcoded cells and/or the labeled cells without a barcode in the inter-clonal (i.e. unrelated or all) distance analysis (Harwell et al., 2015). Given that these single or no barcoded cells have no authentic clonal sibling and often outnumber the bona fide clones in the datasets (~3 to 7 times more in some brains; e.g. in the single dataset in Harwell et al., 28 clonal siblings versus 188 single barcoded cells in the cortex), and their uncertainty in clonal nature (i.e. representing either a real single cell with no sibling or a failure in recovering the sibling), it appears inappropriate to combine them together with the bona fide clones for the distance and clustering analysis. However, Mayer et al. and Harwell et al. mixed these single or no barcoded cells together with the bona fide clones in the inter-clonal (i.e. non-clones, unrelated, or all) distance analysis in both the previous (Harwell et al., 2015; Mayer et al., 2015) and new (Mayer et al., 2016; Garcia et al., 2016) studies. We could not perform the exact same NND and/or clustering analysis for the barcoded datasets (Harwell et al., 2015; Mayer et al., 2015) as in our previous study (Brown et al., 2011), as the brain/cortical contours of the barcoded datasets were largely incomplete and imprecise. Garcia et al. stated that no clone in the barcoded datasets fit in the geometrical and spatial parameters (~300 × 1,500 × 210 μm3 for vertical clusters and ~800 × 200 × 210 μm3 for horizontal clusters) that we used previously to detect interneuron clusters in the cortex (Garcia et al., 2016). It is unclear how Garcia et al. estimated the cubic volume of the clones (~5 × 1010 μm3 on average) in the barcoded datasets, especially for the two or three-cell clones. Based on the Euclidean distance analysis, a number of bona fide barcoded cortical clones in Mayer et al. and Harwell et al. fit with our previous spatial parameters (Figure S8).
In summary, our data and analysis of the barcoded datasets demonstrate that sibling interneurons originating from individual MGE/PoA VZ progenitor cells do not randomly and widely disperse in the forebrain. They are predominantly restricted to the cortex, or the highly related cortex and hippocampus. Moreover, clonally related interneurons form local clusters in a reliable and nonrandom manner. These results are in general consistent with our previous study and Ciceri et al., and confirm that lineage relationship influences the spatial distribution of forebrain interneurons. Future efforts towards understanding the cellular and molecular basis and physiological significance of this lineage-related spatial organization of sibling interneurons will provide fundamental insight into interneuron production and function in the forebrain.
EXPERIMENTAL PROCEDURES
Animals
Nkx2.1-Cre (Xu et al., 2008) and R26LSL-TVAilacZ (Seidler et al., 2008) mice were kindly provided by Dr. Anderson (University of Pennsylvania) and Dr. Saur (Technische Universität München, Germany). Ai9-tdTomato mice were purchased from JAX mice (Stock No. 007909). For timed pregnancies, the plug date was designated as E0 and date of birth as P0. All experimental procedures were approved by the Institutional Animal Care and Use Committee (IACUC) of Memorial Sloan Kettering Cancer Center (MSKCC).
RCAS Production and In Utero Intraventricular Injection
RCAS-EGFP retrovirus was produced as previously described (Du et al., 2006), and serially diluted for clonal analysis. In utero intraventricular injection was carried out as previously described (Brown et al., 2011). In brief, the uterine horns of E12.5 pregnant Nkx2.1-Cre/R26LSL-TVAiLacZ mice were exposed. RCAS-EGFP retrovirus solution (~1.0 μL) with Fast Green (2.5 mg/mL, Sigma) was injected into the lateral ventricle through a beveled, glass micropipette (Drumond Scientific). Following injection, the peritoneal cavity was lavaged with warm phosphate-buffered saline (PBS, pH 7.4), the uterine horns were replaced, and the wound was closed.
Serial Sectioning, Three-Dimensional Reconstruction, and Stereological Analysis
P21 mice were perfused intracardially with 4% paraformaldahyde (PFA) in PBS (pH 7.4). The brains were dissected and post-fixed in the same fixation solution overnight at 4°C. Serial coronal sections (70 μm) of each brain were prepared using a vibratome (Leica Microsystems) and subjected to immunohistochemistry as previously described (Brown et al., 2011). The primary antibodies used were anti-GFP (Invitrogen, 1:2,000) and anti-RFP (Rockland, 1:1,000). Sections were mounted on glass slides, imaged using confocal microscopy (FV1000, Olympus), and reconstructed and stereologically analyzed using Neurolucida (MBF Bioscience). For three-dimensional reconstruction, each section (from rostral to caudal) was analyzed sequentially. The boundaries of the whole brain, cortex, hippocampus, striatum, globus pallidus, and the midline were manually traced and aligned. Individual labeled interneurons were marked by colored dots. For stereological analysis of Nkx2.1-Cre/Ai9-tdTomato brains, the density of tdTomato+ cells in three sections spanning the rostrocaudal axis of the cortex, hippocampus, or striatum, and one section spanning the globus pallidus were analyzed. Based on the volume of each brain region, the total number of tdTomato+ cells was calculated. Three brains were analyzed for Nkx2.1-Cre/Ai9-tdTomato experiments and seven brains were analyzed for E12.5 RCAS-EGFP experiments.
Simulation of Clonal Dispersion in Different Forebrain Structures
To simulate clonal dispersion in different forebrain structures from a random distribution, the same number of clones with the same number of neurons in each clone as in Mayer et al. (i.e. 32 clones including 21 two-cell clones, 6 three-cell clones, 3 four-cell clones, and 2 six-cell clones) were randomly distributed in the cortex, hippocampus, or striatum based on either the total interneuron output in different brain structures by MGE/PoA progenitor cells (i.e. Nkx2.1-Cre/Ai9-tdTomato dataset; Figures 2A and S3A), or the relative ratio of interneuron output in different brain structures by E12.5 MGE/PoA VZ dividing radial glial progenitor cells (i.e. E12.5 RCAS-EGFP dataset; Figures 2B and S3B), or the relative ratio of interneurons in different brain structures of all the clones in Mayer et al. (Figure S4). This simulation was repeated 10,000 times and the frequencies of clones located in different brain structures were calculated.
Error Correction, Euclidean Distance Calculation, Dendrogram Construction, and Permutation and Spatial Distribution Analysis
Notably, several errors regarding the clonal composition and/or regional identity in the original dendrogram analysis of Mayer et al. were corrected based on the raw Neurolucida reconstruction files (Table S1). Specifically, Clone 27 (Exp. 1) was a split clone with one cell in the cortex and one cell in the hippocampus, and thus should be removed from the dendrogram; Clone 32 (Exp. 1) contained 4 cells in the olfactory bulb, 1 cell in the olfactory bulb/cortex (i.e. unclear if it is in the olfactory bulb or cortex based on the x-y-z spatial coordinates), and 1 cell in the cortex; Clone 12 (Exp. 2) contained 3 cells in the cortex and 3 cells in the hippocampus. Thereby, all 6 cells should be included in the dendrogram. The Harwell et al. dataset contained a very limited and rough contour tracing of individual brain structures such as the cortex and hippocampus but no contour tracing of striatum for individual sections. For example, all sections were traced with a partial contour and the same exact contour was used for 2–26 adjacent sections – 50–650 μm thickness volume – or even non-adjacent sections (colored bars, Figure S7B). The contours were also not well aligned (Figures S7A and S7B). This contour approximation and misalignment led to inaccurate spatial coordinates of the labeled interneurons. Some cells were even located outside of the traced contours (Figure S7C). In addition, the regional and/or clonal identities of some cells were mis-assigned based on the raw Neurolucida reconstruction files (Table S2). In particular, the original striatal cell in clone 9 should be in the cortex, clone 16 originally marked with the regional identity of “other” should be in the cortex, the first cell in clone 13 should be the second cell in clone 12, and the first cell in clone 15 should be the second cell in clone 14. These errors were corrected and the datasets were realigned based on the pia and ventricle location before conducting the Euclidean distance analysis.
For each reconstructed barcoded dataset in Mayer et al. (i.e. three brain dataset) and Harwell et al. (i.e. one brain dataset – two hemispheres), the Euclidean (i.e. straight-line) distances between every pair of interneurons for all multi-cell clones in the same structure were then calculated using MATLAB software (Mathworks). The dendrograms were built based on a hierarchical, binary cluster tree using the linkage function. Random permutation/reshuffling of clonal identity of individual interneurons in each dendrogram was performed for 100 rounds. Intra-clonal and inter-clonal distances were calculated between every pair of sibling and non-sibling interneurons in each dataset (Figure S5). For “intra-clonal” and “inter-clonal” distance analysis, all single barcoded cells in individual datasets were considered as a “clone”. “Intra-clonal” distances were computed between all single barcoded interneurons and “inter-clonal” distances were computed between the single barcoded interneuron “clone” and other true interneuron clones in the same dataset.
Data are presented as mean ± SD, and statistical differences were determined using nonparametric statistical tests (i.e. Mann–Whitney test, Wilcoxon matched-pairs signed rank test, Kolmogorov-Smirnov test, or Chi-Square test). Statistical significance was set at p<0.05.
Supplementary Material
HIGHLIGHTS.
MGE/PoA-derived interneuron clones do not randomly disperse in the forebrain.
~70% of clones are restricted in one forebrain structure, predominantly the cortex.
~60% of local interneuron clusters are clonally related siblings.
At least ~50% of interneuron clones form local clusters.
Acknowledgments
We thank Drs. G. Fishell (New York University), C. Mayer (New York University), and C.C. Harwell (Harvard University) for sharing the original 3D reconstructed barcoded dataset files, Dr. S.A. Anderson (University of Pennsylvania) and Dr. D. Saur (Technische Universität München, Germany) for providing the Nkx2.1-Cre and LSL-R26TVAiLacZ mouse lines, respectively, and Dr. E.M. Ross (Weill Cornell Medical College), Dr. S.A. Anderson (University of Pennsylvania), B.D. Simons (University of Cambridge, United Kingdom), and members of the Shi laboratory for valuable discussion and input. This work was supported by grants from the National Institutes of Health (P01NS048120, R01DA024681, and R01MH101382 to S.-H.S., and P30CA008748 to Memorial Sloan Kettering Cancer Center), the National Natural Science Foundation of China (61572265 to Z.H. and 759881 to S.-H.S.), and a NYSTEM fellowship (C026879 to X.-J.Z).
Footnotes
Publisher's Disclaimer: This is a PDF file of an unedited manuscript that has been accepted for publication. As a service to our customers we are providing this early version of the manuscript. The manuscript will undergo copyediting, typesetting, and review of the resulting proof before it is published in its final citable form. Please note that during the production process errors may be discovered which could affect the content, and all legal disclaimers that apply to the journal pertain.
AUTHOR CONTRIBUTIONS
K.T.S., X.-J.Z., and S.-H.S designed the study. K.T.S. and X.-J.Z. collected the population and clonal output experimental data; Z.H. and K.H. performed the simulation analysis of the population dataset and quantitative analysis of the barcoded datasets with help from A.X.; K.T.S, X.-J.Z., and S.-H.S. wrote the paper with input from all authors.
References
- Anderson SA, Kaznowski CE, Horn C, Rubenstein JL, McConnell SK. Distinct origins of neocortical projection neurons and interneurons in vivo. Cereb Cortex. 2002;12:702–709. doi: 10.1093/cercor/12.7.702. [DOI] [PubMed] [Google Scholar]
- Ang ES, Jr, Haydar TF, Gluncic V, Rakic P. Four-dimensional migratory coordinates of GABAergic interneurons in the developing mouse cortex. The Journal of neuroscience: the official journal of the Society for Neuroscience. 2003;23:5805–5815. doi: 10.1523/JNEUROSCI.23-13-05805.2003. [DOI] [PMC free article] [PubMed] [Google Scholar]
- Ayala R, Shu T, Tsai LH. Trekking across the brain: the journey of neuronal migration. Cell. 2007;128:29–43. doi: 10.1016/j.cell.2006.12.021. [DOI] [PubMed] [Google Scholar]
- Bortone D, Polleux F. KCC2 expression promotes the termination of cortical interneuron migration in a voltage-sensitive calcium-dependent manner. Neuron. 2009;62:53–71. doi: 10.1016/j.neuron.2009.01.034. [DOI] [PMC free article] [PubMed] [Google Scholar]
- Brown KN, Chen S, Han Z, Lu CH, Tan X, Zhang XJ, Ding L, Lopez-Cruz A, Saur D, Anderson SA, et al. Clonal production and organization of inhibitory interneurons in the neocortex. Science. 2011;334:480–486. doi: 10.1126/science.1208884. [DOI] [PMC free article] [PubMed] [Google Scholar]
- Butt SJ, Fuccillo M, Nery S, Noctor S, Kriegstein A, Corbin JG, Fishell G. The temporal and spatial origins of cortical interneurons predict their physiological subtype. Neuron. 2005;48:591–604. doi: 10.1016/j.neuron.2005.09.034. [DOI] [PubMed] [Google Scholar]
- Butt SJ, Sousa VH, Fuccillo MV, Hjerling-Leffler J, Miyoshi G, Kimura S, Fishell G. The requirement of Nkx2-1 in the temporal specification of cortical interneuron subtypes. Neuron. 2008;59:722–732. doi: 10.1016/j.neuron.2008.07.031. [DOI] [PMC free article] [PubMed] [Google Scholar]
- Cepko CL, Ryder E, Austin C, Golden J, Fields-Berry S, Lin J. Lineage analysis with retroviral vectors. Methods in enzymology. 2000;327:118–145. doi: 10.1016/s0076-6879(00)27272-8. [DOI] [PubMed] [Google Scholar]
- Ciceri G, Dehorter N, Sols I, Huang ZJ, Maravall M, Marin O. Lineage-specific laminar organization of cortical GABAergic interneurons. Nature neuroscience. 2013;16:1199–1210. doi: 10.1038/nn.3485. [DOI] [PubMed] [Google Scholar]
- Du Z, Podsypanina K, Huang S, McGrath A, Toneff MJ, Bogoslovskaia E, Zhang X, Moraes RC, Fluck M, Allred DC, et al. Introduction of oncogenes into mammary glands in vivo with an avian retroviral vector initiates and promotes carcinogenesis in mouse models. Proc Natl Acad Sci U S A. 2006;103:17396–17401. doi: 10.1073/pnas.0608607103. [DOI] [PMC free article] [PubMed] [Google Scholar]
- Flames N, Pla R, Gelman DM, Rubenstein JL, Puelles L, Marin O. Delineation of multiple subpallial progenitor domains by the combinatorial expression of transcriptional codes. J Neurosci. 2007;27:9682–9695. doi: 10.1523/JNEUROSCI.2750-07.2007. [DOI] [PMC free article] [PubMed] [Google Scholar]
- Fogarty M, Grist M, Gelman D, Marin O, Pachnis V, Kessaris N. Spatial genetic patterning of the embryonic neuroepithelium generates GABAergic interneuron diversity in the adult cortex. J Neurosci. 2007;27:10935–10946. doi: 10.1523/JNEUROSCI.1629-07.2007. [DOI] [PMC free article] [PubMed] [Google Scholar]
- Fuentealba LC, Rompani SB, Parraguez JI, Obernier K, Romero R, Cepko CL, Alvarez-Buylla A. Embryonic Origin of Postnatal Neural Stem Cells. Cell. 2015;161:1644–1655. doi: 10.1016/j.cell.2015.05.041. [DOI] [PMC free article] [PubMed] [Google Scholar]
- Gelman DM, Martini FJ, Nobrega-Pereira S, Pierani A, Kessaris N, Marin O. The embryonic preoptic area is a novel source of cortical GABAergic interneurons. The Journal of neuroscience: the official journal of the Society for Neuroscience. 2009;29:9380–9389. doi: 10.1523/JNEUROSCI.0604-09.2009. [DOI] [PMC free article] [PubMed] [Google Scholar]
- Gil-Sanz C, Muller U. A New Chapter in the Life of Cajal’s Short-Axon Neurons: Separation of Interneuron Siblings after Birth. Neuron. 2015;87:909–911. doi: 10.1016/j.neuron.2015.08.031. [DOI] [PubMed] [Google Scholar]
- Gilbert JM, Bates P, Varmus HE, White JM. The receptor for the subgroup A avian leukosis-sarcoma viruses binds to subgroup A but not to subgroup C envelope glycoprotein. Journal of virology. 1994;68:5623–5628. doi: 10.1128/jvi.68.9.5623-5628.1994. [DOI] [PMC free article] [PubMed] [Google Scholar]
- Golden JA, Fields-Berry SC, Cepko CL. Construction and characterization of a highly complex retroviral library for lineage analysis. Proc Natl Acad Sci U S A. 1995;92:5704–5708. doi: 10.1073/pnas.92.12.5704. [DOI] [PMC free article] [PubMed] [Google Scholar]
- Halliday AL, Cepko CL. Generation and migration of cells in the developing striatum. Neuron. 1992;9:15–26. doi: 10.1016/0896-6273(92)90216-z. [DOI] [PubMed] [Google Scholar]
- Harwell CC, Fuentealba LC, Gonzalez-Cerrillo A, Parker PR, Gertz CC, Mazzola E, Garcia MT, Alvarez-Buylla A, Cepko CL, Kriegstein AR. Wide Dispersion and Diversity of Clonally Related Inhibitory Interneurons. Neuron. 2015;87:999–1007. doi: 10.1016/j.neuron.2015.07.030. [DOI] [PMC free article] [PubMed] [Google Scholar]
- Hebert JM, Fishell G. The genetics of early telencephalon patterning: some assembly required. Nat Rev Neurosci. 2008;9:678–685. doi: 10.1038/nrn2463. [DOI] [PMC free article] [PubMed] [Google Scholar]
- Inan M, Welagen J, Anderson SA. Spatial and temporal bias in the mitotic origins of somatostatin- and parvalbumin-expressing interneuron subgroups and the chandelier subtype in the medial ganglionic eminence. Cereb Cortex. 2012;22:820–827. doi: 10.1093/cercor/bhr148. [DOI] [PMC free article] [PubMed] [Google Scholar]
- Kessaris N, Fogarty M, Iannarelli P, Grist M, Wegner M, Richardson WD. Competing waves of oligodendrocytes in the forebrain and postnatal elimination of an embryonic lineage. Nat Neurosci. 2006;9:173–179. doi: 10.1038/nn1620. [DOI] [PMC free article] [PubMed] [Google Scholar]
- Kirkwood TB, Price J, Grove EA. The dispersion of neuronal clones across the cerebral cortex. Science. 1992;258:317–320. doi: 10.1126/science.1411530. [DOI] [PubMed] [Google Scholar]
- Lee S, Hjerling-Leffler J, Zagha E, Fishell G, Rudy B. The largest group of superficial neocortical GABAergic interneurons expresses ionotropic serotonin receptors. J Neurosci. 2010;30:16796–16808. doi: 10.1523/JNEUROSCI.1869-10.2010. [DOI] [PMC free article] [PubMed] [Google Scholar]
- Marin O, Rubenstein JL. A long, remarkable journey: tangential migration in the telencephalon. Nat Rev Neurosci. 2001;2:780–790. doi: 10.1038/35097509. [DOI] [PubMed] [Google Scholar]
- Marin O, Rubenstein JL. Cell migration in the forebrain. Annu Rev Neurosci. 2003;26:441–483. doi: 10.1146/annurev.neuro.26.041002.131058. [DOI] [PubMed] [Google Scholar]
- Mayer C, Jaglin XH, Cobbs LV, Bandler RC, Streicher C, Cepko CL, Hippenmeyer S, Fishell G. Clonally Related Forebrain Interneurons Disperse Broadly across Both Functional Areas and Structural Boundaries. Neuron. 2015;87:989–998. doi: 10.1016/j.neuron.2015.07.011. [DOI] [PMC free article] [PubMed] [Google Scholar]
- McCarthy M, Turnbull DH, Walsh CA, Fishell G. Telencephalic neural progenitors appear to be restricted to regional and glial fates before the onset of neurogenesis. J Neurosci. 2001;21:6772–6781. doi: 10.1523/JNEUROSCI.21-17-06772.2001. [DOI] [PMC free article] [PubMed] [Google Scholar]
- Miyoshi G, Butt SJ, Takebayashi H, Fishell G. Physiologically distinct temporal cohorts of cortical interneurons arise from telencephalic Olig2-expressing precursors. The Journal of neuroscience: the official journal of the Society for Neuroscience. 2007;27:7786–7798. doi: 10.1523/JNEUROSCI.1807-07.2007. [DOI] [PMC free article] [PubMed] [Google Scholar]
- Miyoshi G, Fishell G. GABAergic interneuron lineages selectively sort into specific cortical layers during early postnatal development. Cereb Cortex. 2011;21:845–852. doi: 10.1093/cercor/bhq155. [DOI] [PMC free article] [PubMed] [Google Scholar]
- Nery S, Fishell G, Corbin JG. The caudal ganglionic eminence is a source of distinct cortical and subcortical cell populations. Nat Neurosci. 2002;5:1279–1287. doi: 10.1038/nn971. [DOI] [PubMed] [Google Scholar]
- Seidler B, Schmidt A, Mayr U, Nakhai H, Schmid RM, Schneider G, Saur D. A Cre-loxP-based mouse model for conditional somatic gene expression and knockdown in vivo by using avian retroviral vectors. Proc Natl Acad Sci U S A. 2008;105:10137–10142. doi: 10.1073/pnas.0800487105. [DOI] [PMC free article] [PubMed] [Google Scholar]
- Southwell DG, Paredes MF, Galvao RP, Jones DL, Froemke RC, Sebe JY, Alfaro-Cervello C, Tang Y, Garcia-Verdugo JM, Rubenstein JL, et al. Intrinsically determined cell death of developing cortical interneurons. Nature. 2012;491:109–113. doi: 10.1038/nature11523. [DOI] [PMC free article] [PubMed] [Google Scholar]
- Sultan KT, Brown KN, Shi SH. Production and organization of neocortical interneurons. Frontiers in cellular neuroscience. 2013;7:221. doi: 10.3389/fncel.2013.00221. [DOI] [PMC free article] [PubMed] [Google Scholar]
- Sussel L, Marin O, Kimura S, Rubenstein JL. Loss of Nkx2.1 homeobox gene function results in a ventral to dorsal molecular respecification within the basal telencephalon: evidence for a transformation of the pallidum into the striatum. Development. 1999;126:3359–3370. doi: 10.1242/dev.126.15.3359. [DOI] [PubMed] [Google Scholar]
- Tan X, Liu WA, Zhang XJ, Shi W, Ren SQ, Li Z, Brown KN, Shi SH. Vascular Influence on Ventral Telencephalic Progenitors and Neocortical Interneuron Production. Dev Cell. 2016;36:624–638. doi: 10.1016/j.devcel.2016.02.023. [DOI] [PMC free article] [PubMed] [Google Scholar]
- Tanaka DH, Yanagida M, Zhu Y, Mikami S, Nagasawa T, Miyazaki J, Yanagawa Y, Obata K, Murakami F. Random walk behavior of migrating cortical interneurons in the marginal zone: time-lapse analysis in flat-mount cortex. J Neurosci. 2009;29:1300–1311. doi: 10.1523/JNEUROSCI.5446-08.2009. [DOI] [PMC free article] [PubMed] [Google Scholar]
- Taniguchi H, Lu J, Huang ZJ. The spatial and temporal origin of chandelier cells in mouse neocortex. Science. 2013;339:70–74. doi: 10.1126/science.1227622. [DOI] [PMC free article] [PubMed] [Google Scholar]
- Tricoire L, Pelkey KA, Erkkila BE, Jeffries BW, Yuan X, McBain CJ. A blueprint for the spatiotemporal origins of mouse hippocampal interneuron diversity. J Neurosci. 2011;31:10948–10970. doi: 10.1523/JNEUROSCI.0323-11.2011. [DOI] [PMC free article] [PubMed] [Google Scholar]
- Walsh C, Cepko CL. Widespread dispersion of neuronal clones across functional regions of the cerebral cortex. Science. 1992;255:434–440. doi: 10.1126/science.1734520. [DOI] [PubMed] [Google Scholar]
- Wichterle H, Turnbull DH, Nery S, Fishell G, Alvarez-Buylla A. In utero fate mapping reveals distinct migratory pathways and fates of neurons born in the mammalian basal forebrain. Development. 2001;128:3759–3771. doi: 10.1242/dev.128.19.3759. [DOI] [PubMed] [Google Scholar]
- Xu Q, Cobos I, De La Cruz E, Rubenstein JL, Anderson SA. Origins of cortical interneuron subtypes. The Journal of neuroscience: the official journal of the Society for Neuroscience. 2004;24:2612–2622. doi: 10.1523/JNEUROSCI.5667-03.2004. [DOI] [PMC free article] [PubMed] [Google Scholar]
- Xu Q, Tam M, Anderson SA. Fate mapping Nkx2.1-lineage cells in the mouse telencephalon. J Comp Neurol. 2008;506:16–29. doi: 10.1002/cne.21529. [DOI] [PubMed] [Google Scholar]
Associated Data
This section collects any data citations, data availability statements, or supplementary materials included in this article.