

Abstract
Purpose
To assess the long‐term effects of focal/grid laser treatment on the central visual field in subjects with clinically significant diabetic macular oedema (CSMO).
Methods
Twenty‐six subjects with CSMO were included in the study. Fundus photography, assessment of retinal thickness by time‐domain optical coherence tomography (OCT), measurement of visual acuity (VA) and standard automated perimetry of the central 10° of the visual field were performed at baseline before focal/grid laser treatment and thereafter at four follow‐up visits 6 months apart, when the laser treatment was also repeated in subjects with persistent oedema. Changes in VA and retinal thickness between baseline and study end at 24‐month follow‐up were calculated. Trends in changes in the visual field were assessed by linear regression of number of significantly depressed test points over time.
Results
On average after the laser treatment, retinal thickness decreased by 17% and VA decreased by three letters. In most eyes, visual fields were stable over time: the mean of the trend slopes (0.05 points/month) did not differ significantly from 0 (p = 0.63). The number of depressed test points at follow‐up was not correlated with either the total number of laser effects or the number of laser sessions.
Conclusion
Focal/grid laser treatment for CSMO did not affect retinal sensitivity in the central visual field in the subjects included in this 2‐year follow‐up study.
Keywords: clinically significant diabetic macular oedema, photocoagulation, retinal sensitivity, standard automated perimetry, visual fields
Introduction
Diabetic macular oedema is associated with increased vascular leakage in the central part of the retina, and it is a feared complication of diabetes mellitus. For decades, diabetic macular oedema has been treated with focal/grid photocoagulation (ETDRS‐Group 1987) in which laser shots are applied directly to leaking microaneurysms (focal treatment) or are delivered in a grid pattern on the thickened oedematous part of the retina (grid treatment). In many subjects with diabetic macular oedema, both of the mentioned modalities are often required and are performed during the same treatment session.
During focal treatment, laser energy is absorbed by haemoglobin (Carr & Talley 1995), which results in thrombus formation, contraction of the vessel wall, and subsequent decreased leakage. By comparison, the beneficial clinical effects of grid treatment are probably triggered in the retinal pigment epithelium (Peyman et al. 1984). Unfortunately, the energy absorbed by the retinal pigment epithelium can also dissipate to adjacent structures (e.g. the neuroretina), which can in turn cause decreased retinal sensitivity, a known side‐effect of panretinal photocoagulation for proliferative diabetic retinopathy (Fong et al. 2007). In such photocoagulation, the retina is exposed to laser shots outside the vessel arcades, with a much larger number of shots compared to focal/grid treatment, in which shots are applied within the vessel arcades. Previous studies of change in retinal sensitivity after focal/grid photocoagulation have used a short follow‐up time and have provided conflicting results. For example, Greenstein et al. (2000) found little or no change in retinal sensitivity 2–3 months after treatment, whereas Striph et al. (1988) observed decreased sensitivity after 2–4 months.
To explain the long‐term effects of focal/grid photocoagulation on retinal sensitivity, we studied consecutively recruited diabetic subjects with widely varying severity of clinically significant macular oedema (CSMO) for 24 months after focal/grid photocoagulation.
Material and Methods
Subjects
From April 2006 to April 2008, diabetic subjects regularly attending the Department of Ophthalmology at Skåne University Hospital in Malmö, Sweden, were consecutively invited to participate in the present study at the time they were diagnosed with CSMO. Exclusion criteria were having any disease other than diabetic retinopathy that could impact visual function, being unable to perform reliable visual field tests or having previously received laser or intravitreal treatment in the examined eye.
Fundus photography, optical coherence tomography (OCT) and measurements of best‐corrected visual acuity (VA), visual fields, blood glucose and HbA1c were performed at baseline and at each of the four follow‐up visits conducted at 6‐month intervals, which also included a clinical examination using biomicroscopy and a contact fundus lens. Data on diabetes duration and on diabetes and blood pressure treatment were collected at baseline. Informed consent was obtained from all participants, and the study was approved by the Ethics Committee of Lund/Malmö and followed the tenets of the Declaration of Helsinki.
Fundus photography
Clinically significant diabetic macular oedema (ETDRS‐Group 1991) was confirmed by 35° macular stereo fundus photography of the central field performed through dilated pupils using a retinal camera (Topcon 50 DX; Topcon, Tokyo, Japan). Fundus photographs were examined by one of the authors (EA) in a masked manner on a light box using a stereo viewer (Carl Zeiss Meditec Inc., Dublin, CA, USA).
Laser treatment
All subjects were treated using a frequency‐doubled Nd:YAG laser (Visulas 532; Carl Zeiss Meditec Inc.; duration 0.1 second, spot size 100 μm, performed by author EA). Leaking microaneurysms and areas of diffuse leakage identified on fluorescein angiograms were treated focally and/or in a grid‐like pattern and with adequate power to obtain greyish lesions with blurred margins (Fig. 1). If biomicroscopic assessment using a contact lens revealed persistent oedema, treatment was repeated after 6, 12, and/or 18 months (EA).
Figure 1.
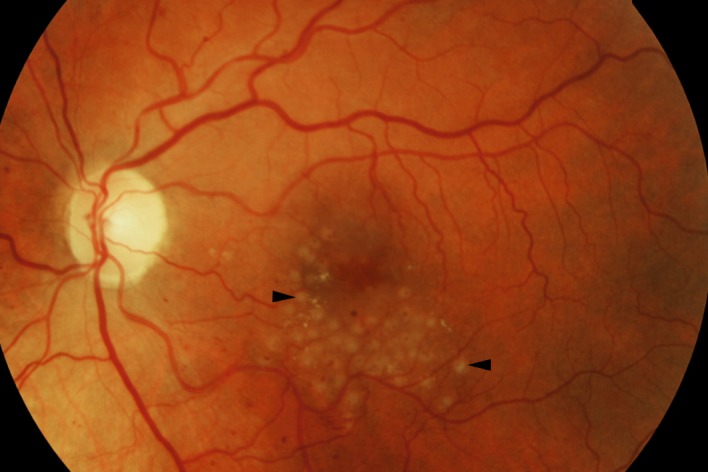
Fundus image demonstrating focal/grid photocoagulation burns (black arrowheads). Image captured 15 min after treatment. At that time‐point, a slight expansion of the laser lesions had occurred.
Optical coherence tomography
Retinal thickness was measured by time‐domain OCT (stratus oct software version 4.0.1; Carl Zeiss Meditec Inc.) using the macular thickness map protocol, which generates a retinal thickness map in nine subfields from six consecutive radial B‐scans centred on the fovea. The mean thickness of each subfield was calculated by interpolation between the radial scans and then presented in a circle diagram according to the ETDRS grid (ETDRS‐Group 1991) and colour‐coded to indicate the percentile range compared with the age‐matched normative database. Thickened subfields on OCT were defined as above the 99th percentile.
To assess the lateral expansion of the oedema in the individual subjects and in the entire cohort over time, we counted the number of thickened subfields per subject and also the number of subjects with the respective thickened subfields. Thickness measurements for each subfield at baseline were compared with values obtained at 24 months.
As recommended by the manufacturer of the OCT, images with a signal strength of less than five were discarded.
Best‐corrected visual acuity
Best‐corrected VA was established after clinical subjective refraction using ETDRS charts at a distance of 4 m and was expressed as the logarithm of minimum angle of resolution (LogMAR scores) (Ferris et al. 1982).
Perimetry
The central 10° of the visual field was examined by standard automated perimetry (SAP) using the 10‐2 SITA standard algorithm of the Humphrey Field Analyzer 750 (HFA; Carl Zeiss Meditec Inc.). The 10‐2 test point pattern includes 68 test points covering the central 10° with a resolution of 2° between test points. A training session was performed within 3 days of baseline to minimize perimetric learning effects. Visual fields with a rate of false‐positive responses exceeding 15% were considered to be unreliable. The HFA provides interpretation tools for SAP, such as probability maps flagging test points that are significantly depressed below normal limits. We counted the number of significantly depressed points at the p < 0.01 level that were flagged in the total deviation probability maps.
Statistics
One eye of each subject was included in the analysis. Changes in VA and in retinal thickness were calculated as the difference between the measurements recorded at baseline and at 24 months. The occurrence and location of depressed points in visual fields at the p < 0.01 level were assessed at baseline and at all follow‐up visits. Trends in visual fields were analysed by linear regression of the number of significantly depressed points at the p < 0.01 level over time. The distribution of the trend slopes was plotted, and one‐sample t‐test was applied to determine whether the mean of the slopes differed from zero. Effect of the total number of laser shots on the visual field trend slopes was calculated by linear regression. Statistical calculations were performed using r software version 3.0.3 (R Foundation for Statistical Computing, Vienna, Austria).
Results
Subjects
Of the 36 subjects invited to participate in our study, 31 agreed to take part, five declined, and two were excluded (one due to pituitary adenoma and the other due to cerebral infarction). Thus 29 subjects entered the study. However, two moved out of the area after baseline examination and another moved after 6 months, and hence, 26 subjects completed the 24‐month follow‐up. Subjects who were younger than 30 years at the time of diabetes diagnosis and were on insulin treatment were considered to have type 1 diabetes, and the remaining subjects were regarded as having type 2 disease. Baseline characteristics are shown in Table 1.
Table 1.
Subject characteristics at baseline
| Diabetes type 1/type 2 (n/n) | 7/22 |
| Gender (male/female) | 17/12 |
| Age (years) | 56 (22–77) |
| Age at onset of diabetes (years) | 41 (5–72) |
| Duration of diabetes (years) | 15 (0–48) |
| HbA1c (mmol/l) | 7.65 (5.30–10.40) |
| Blood glucose (mmol/l) | 9.3 (6.5–22.3) |
| Antihypertensive treatment (n) | 17 |
Data are expressed as median (min–max), and n indicates number of subjects. Missing data: HbA1c, n = 3; blood glucose, n = 4; antihypertensive treatment, n = 1.
Microvascular abnormalities and laser treatment
At baseline, the microvascular abnormalities resulting in CSMO ranged from hard exudates located within 500 μm of the fovea and combined with a few leaking microaneurysms (Fig. 2) to widespread hard exudates, leaking microaneurysms and capillaries throughout the macular region (Fig. 3).
Figure 2.
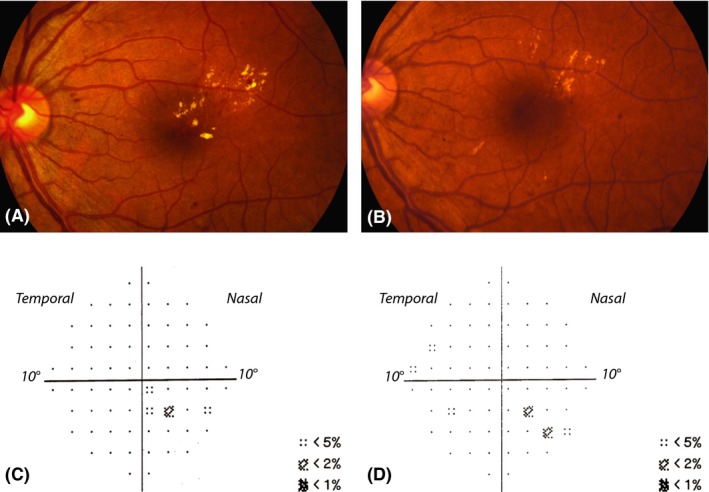
Fundus images demonstrating clinically significant diabetic macular oedema with hard exudates within 500 μm of the centre of the fovea combined with microaneurysms at baseline before treatment (A) and 24 months after treatment (B). Visual acuity was 1.2 Snellen at baseline and 1.1 Snellen at 24 months. This subject required only one treatment (33 laser shots). Total deviation probability maps at baseline (C) and after 24 months (D) reflect no points significantly depressed below p < 0.01, but do indicate small clusters of points depressed at the p < 0.02 and p < 0.05 levels corresponding to the location of the oedema both at baseline and 24 months after treatment.
Figure 3.

Fundus images demonstrating clinically significant diabetic macular oedema with widespread hard exudates combined with leaking microaneurysms and capillaries at baseline before laser treatment (A) and 24 months after treatment (B). Visual acuity was 1.0 Snellen at both time‐points. This subject required only one treatment (94 laser shots). Total deviation probability maps at baseline (C) and after 24 months (D) show, respectively, a total of 30 and 22 points significantly depressed below the p < 0.05 levels, and, more importantly, two points and one point below the p < 0.01 level. The depressed points correspond to the location of the oedema both at baseline and 24 months after treatment.
Of the 26 subjects who completed the study, 12 required only one laser treatment, whereas the other 14 required retreatment due to persistence or relapse of oedema during the 24‐month period. Ten subjects received a second laser treatment: nine of them at 6 months and one at 18 months. Two subjects were given a third treatment at 12 months, and two received a fourth treatment at 18 months. The number of retreatments required decreased with each follow‐up visit. In one of the subjects who had focal/grid treatment repeated at 6 months, a total of 324 laser shots (the highest number in the entire cohort) were applied in the macular region, and this subjects also required panretinal photocoagulation at 21 months due to fairly rapid progression from moderate to proliferative retinopathy.
Laser energy ranged from 60 to 140 mW in the focal/grid treatments given to the subjects in this study.
Retinal thickness assessed by OCT
Baseline OCT measurements for five of the 26 subjects were excluded due to low signal strength. For the remaining 21 subjects, the magnitude of oedema at baseline was highly variable and did not exceed the age‐correlated normal upper limits for retinal thickness in all cases. Hence the total number of thickened subfields per subject varied from none to all nine (median two), and there was involvement of the central subfield in seven subjects. Figure 4A illustrates the number of subjects with thickening in the respective subfields at baseline.
Figure 4.

Diagrams illustrating the number of subjects with retinal thickening in the different subfields shown by optical coherence tomography at baseline (A) and the median age‐normalized change in thickness (in microns) in each subfield at 24 months (B). (All left eyes were converted to right eyes for illustrative purposes).
After 24 months, the total number of thickened subfields per subject varied between zero and seven, the median number decreased marginally to one, and there was involvement of the central subfield in six subjects. Figure 4B shows the reduction in thickness in each subfield from baseline to study end.
To assess change in retinal thickness over time, we compared subfields above the 99th percentile at baseline with corresponding subfields at 24 months. This showed that, on average, thickness decreased by 49 μm in all subfields in 19 subjects and in some but not all subfields in two subjects. One of those two individuals had nine thickened subfields at baseline and three at 24 months, and the thickness of one of the subfields increased by 80 μm (this was the subject who required panretinal photocoagulation at 21 months, as described above). The second subject had six thickened subfields at baseline and three at 24 months, and this individual also had one subfield with the same thickness at baseline and follow‐up.
Considering all 26 subjects, the average decrease in thickness was 17% (57 μm) in the thickest subfield and 6% (14 μm) in the central subfield (Table 2).
Table 2.
Median values for number of laser treatments and laser shots, and thickest subfield thickness and central subfield thickness (measured by optical coherence tomography) at baseline and at 24 months shown for the 26 subjects that completed follow‐up
| Baseline | 24 months | |
|---|---|---|
| Number of laser treatments | 2 (1–4) | |
| Number of laser shots | 48 (10–181) | 75 (15–324) |
| Thickest subfield thickness (μm) | 331 (260–594) | 274 (221–332) |
| Central subfield thickness (μm) | 249 (187–501) | 235 (172–354) |
Best‐corrected visual acuity
At baseline, median VA was 0.00 LogMAR (range 0.50 to −0.20), corresponding to 1.00 (0.32–1.58) Snellen (Table 3). On average, VA increased by three letters in eight subjects, remained unchanged in four subjects and declined by four letters in 14 subjects. Considering the entire cohort, the average decrease in VA was approximately three letters.
Table 3.
Median best‐corrected visual acuity in LogMAR (a) and Snellen (b) at baseline and 24‐month follow‐up (minimum to maximum values within parentheses) shown for all subjects and excluding outliers, and considering involvement or non‐involvement of the central subfield in the optical coherence tomography grid map
| Baseline | 24 months | |
|---|---|---|
| (a) | ||
| All subjects (n = 26) | 0.00 (0.50 to −0.20) | 0.05 (0.74 to −0.14) |
| Without outliers (n = 24) | −0.02 (0.28 to −0.20) | 0.00 (0.26 to −0.14) |
| Central subfield involved (n = 7) | 0.23 (0.5 to −0.08) | 0.17 (0.74 to −0.02) |
| Central subfield not involved (n = 14) | −0.06 (0.20 to −0.20) | 0.03 (0.26 to −0.14) |
| (b) | ||
| All subjects (n = 26) | 1.00 (0.32–1.58) | 0.89 (0.18–1.38) |
| Without outliers (n = 24) | 1.05 (0.52–1.58) | 1.00 (0.55–1.38) |
| Central subfield involved (n = 7) | 0.59 (0.32–1.20) | 0.68 (0.18–1.05) |
| Central subfield not involved (n = 14) | 1.15 (0.63–1.58) | 0.93 (0.55–1.38) |
n = number of subjects.
When comparing baseline VA with VA at 24 months, we found a clear difference between the 14 subjects without and the seven subjects with increased thickness of the central subfield. Two outliers were identified. The first outlier had a VA of 0.50 LogMAR (0.32 Snellen) at baseline, which deteriorated to 0.94 LogMAR (0.11 Snellen) at 18 months and 0.74 LogMAR (0.18 Snellen) at 24 months (again, this was the above‐mentioned subject requiring panretinal photocoagulation at 21 months). The second outlier had a VA of 0.40 LogMAR (0.40 Snellen) at baseline, which had worsened to 0.62 LogMAR (0.24 Snellen) at 18 months but had improved to 0.42 LogMAR (0.38 Snellen) at the 24‐month follow‐up.
Perimetry
All visual field tests had <15% false‐positive responses and were therefore considered reliable. At baseline, there was a median of 2 (range 0–23) significantly depressed points per visual field. Also at baseline, 12 subjects had no depressed points, nine subjects had clusters corresponding to the area of macular oedema, and five had non‐corresponding clusters. At 24 months, the median number of significantly depressed points was 3 (range 0–52) in the entire cohort. Considering the 12 subjects with no depressed points at baseline, at the end of the study eight of them still had no depressed points, whereas the remaining four had 1–9 depressed points, which corresponded to the laser‐treated area in only one subject.
As shown in Fig. 5, the trend slopes did not differ significantly from zero (mean 0.05, p = 0.63), and the standard deviation was small (0.5). In all but two subjects, there was only a negligible change in visual fields after laser treatment. In one of these two outliers, who was also identified as an outlier with respect to VA, the number of significantly depressed points in the visual fields was 20 at baseline but 63 at 18 months and 52 at 24 months (this was the subject that required panretinal photocoagulation at 21 months). In the other outlier, the visual fields showed improvement in the number of significantly depressed points, which decreased from 20 at baseline to three at 12 months and zero at both 18 and 24 months. However, it should be noted that this subject had six significantly depressed points at the training session prior to the baseline visit, and thus, it is unlikely that the baseline field test was actually representative of the baseline status in this individual.
Figure 5.

Changes in visual fields. The x‐axis indicates the regression slope of the number of depressed points for each subject over time, and hence, a positive slope implies worsening and a negative slope improvement. There was no difference in slope between those who received laser treatment only once (n = 12) and those given the treatment on more than one occasion (n = 14). Two outliers were observed.
The number of retreatments had no impact on the number of points with depressed sensitivity at follow‐up (Fig. 5). Moreover, after excluding the one outlier who received a total of 324 laser shots and developed severe ischaemic retinopathy, we found no correlation between the total number of laser shots and the trend slopes for depressed points over time; the regression coefficient was 0 (p = 0.82), and the coefficient of determination (R 2) was 0.002. When this outlier was included in the calculations, the correlation was significant (p = 0.04), with a regression coefficient of 0.004. This observation indicates that 100 additional laser shots would increase the number of significantly depressed points by 0.4 per month, and thus, a significant but very marginal effect would be explained by the outlier who received 324 laser shots.
Discussion
The main purpose of this prospective, descriptive study was to investigate the long‐term effect of focal/grid laser treatment on the central 10° of the visual field in subjects with CSMO. In line with our previous studies (Bengtsson et al. 2005; Agardh et al. 2006), we found that CSMO was associated with very few, if any, significantly depressed points. The laser treatment reduced the thickness of the retina and lateral expansion of the oedema, but did not increase the number of depressed points. Also, over the follow‐up period, there was a slight decline in VA although visual fields were stable, and hence, our results suggest that focal/grid laser photocoagulation does not lead to decreased retinal sensitivity, at least not during the first 2 years after treatment.
We investigated retinal sensitivity in the central 10° of the visual field, which represents the macular area between the vascular arcades, and the size of the OCT grid map commonly used to describe the thickness of retinal subfields corresponds to the same area. The SAP 10‐2 algorithm uses the Goldmann III stimulus, which is 0.43° with 2° spacing and thus analogous to a retinal image size of approximately 130 and 600 μm spacing in an emmetropic eye when using Listing's reduced eye model (Katz & Kruger 1998). In our study, the number of laser shots ranged from 15 to 324 in a combined focal and grid pattern; hence, considering a square grid, 15 shots would have resulted in coverage of approximately 700 × 700 μm and thereby encompassed any potentially damaged area of the neuroretina. Accordingly, any decrease in retinal sensitivity caused by photocoagulation using our laser settings should have been detected, even in the subject who required the least number of shots.
Although the number of participants was small, the subjects were representative in terms of the severity of macular oedema (i.e. they had from mild to severe CSMO) and widely varying VA. Nearly half of the cohort required only one laser treatment, whereas the rest needed up to three retreatments. It is likely that VA would have been better at follow‐up if the subjects had also been given injections of antivascular endothelial growth factor (anti‐VEGF). However, during the current study period, focal/grid laser was the only available treatment option for CSMO, because anti‐VEGF therapy was off‐label and not yet recommended by the Swedish Medical Product Agency. In addition, time‐domain OCT was the only OCT technique available at the department at the start of our investigation. Nevertheless, measurements made using time‐domain OCT have been shown to be strongly correlated with those provided by the newer spectral‐domain OCT instruments (Forte et al. 2009).
Few investigations have examined the effects of focal/grid laser treatment on retinal sensitivity using SAP, and the results obtained have been based on short follow‐up times and have been inconclusive. Greenstein et al. (2000) showed no change in retinal sensitivity at 12 weeks, whereas Striph et al. (1988) and Shimura et al. (2004) reported decreased retinal sensitivity up to 4–6 months after laser treatment. Striph and colleagues used 200–500 laser shots per subject and a spot size of 200 μm outside the parafoveal region, which might have contributed to collateral damage of the neuroretina that affected visual fields. Shimura and co‐workers used 30‐2 SAP, which constitutes 6° between the stimuli, corresponding to 12 points presented in the central 10° of a total of 76 points in the whole 30‐2 SAP layout. In as much as the subjects in the latter study had also received panretinal photocoagulation, the decrease in retinal sensitivity within the central 30° may not have been related to either macular oedema or the focal laser treatment. In the present investigation, panretinal photocoagulation was required in one subject due to proliferative retinopathy. This subject exhibited VA and visual field deterioration during the study period prior to the panretinal photocoagulation, possibly due to the development of ischaemic retinopathy or to the number of focal/grid laser shots applied (156 at baseline and an additional 168 at 6 months), which was the highest used in the cohort. However, it should be noted that the visual field evaluated in the subject receiving the next highest number of shots (181 at baseline and 109 at 6 months) was stable during the course of the study.
Although we were not able to demonstrate that the focal/grid treatment caused visual field defects, it cannot be excluded that methods other than standard perimetry such as microperimetry (Midena & Vujosevic 2012) or electroretinogram techniques (Barber et al. 2012) could have detected possible damage. There are studies on functional loss in diabetic macular oedema applying those techniques, but to our knowledge, only one study has shown functional loss after conventional laser treatment using microperimetry (Vujosevic et al. 2010) and one using electroretinography (Greenstein et al. 2000). To determine whether those techniques are more sensitive and better suited than visual field testing with SAP for detection of laser‐induced damage in the macula, it would be necessary to conduct prospective comparative studies.
In conclusion, we found that focal/grid photocoagulation of CSMO did not affect retinal sensitivity for up to 2 years after the treatment, which is the longest follow‐up reported so far. We studied consecutively recruited diabetic subjects with varying degrees of macular oedema and VA, and the results indicate that focal/grid photocoagulation causes only minimal or no damage to the neuroretina. It is likely that intravitreal injections of anti‐VEGF would have improved the VA outcome in the subjects with a poorer VA at baseline (Virgili et al. 2014), but the possibility that such treatment has long‐term side‐effects on the visual field has not yet been explored.
This study was supported by grants from Lund University, the Skåne University Hospital Foundation, the Järnhardt Foundation, the Eye Foundation, the Foundation for Visually Impaired in Former Malmöhus län, and the Carmen and Bertil Regnér Foundation.
References
- Agardh E, Stjernquist H, Heijl A & Bengtsson B (2006): Visual acuity and perimetry as measures of visual function in diabetic macular oedema. Diabetologia 49: 200–206. [DOI] [PubMed] [Google Scholar]
- Barber JA, Robinson WF & Jackson GR (2012): Neurodegeneration in diabetic retinopathy In: Tombran‐Tink J, Barnstable CJ. & Gardner TW. (eds). Visual dysfunction in diabetes. New York: Springer; 189–209. [Google Scholar]
- Bengtsson B, Heijl A & Agardh E (2005): Visual fields correlate better than visual acuity to severity of diabetic retinopathy. Diabetologia 48: 2494–2500. [DOI] [PubMed] [Google Scholar]
- Carr LW 3rd & Talley DK (1995): Laser‐tissue interactions. Optom Clin 4: 17–31. [PubMed] [Google Scholar]
- ETDRS‐Group (1987): Treatment techniques and clinical guidelines for photocoagulation of diabetic macular edema. Early Treatment Diabetic Retinopathy Study Report Number 2. Early Treatment Diabetic Retinopathy Study Research Group. Ophthalmology 94: 761–774. [DOI] [PubMed] [Google Scholar]
- ETDRS‐Group (1991): Grading diabetic retinopathy from stereoscopic color fundus photographs–an extension of the modified Airlie House classification. ETDRS report number 10. Early Treatment Diabetic Retinopathy Study Research Group. Ophthalmology 98: 786–806. [PubMed] [Google Scholar]
- Ferris FL 3rd, Kassoff A, Bresnick GH & Bailey I (1982): New visual acuity charts for clinical research. Am J Ophthalmol 94: 91–96. [PubMed] [Google Scholar]
- Fong DS, Girach A & Boney A (2007): Visual side effects of successful scatter laser photocoagulation surgery for proliferative diabetic retinopathy: a literature review. Retina 27: 816–824. [DOI] [PubMed] [Google Scholar]
- Forte R, Cennamo GL, Finelli ML & de Crecchio G (2009): Comparison of time domain Stratus OCT and spectral domain SLO/OCT for assessment of macular thickness and volume. Eye 23: 2071–2078. [DOI] [PubMed] [Google Scholar]
- Greenstein VC, Chen H, Hood DC, Holopigian K, Seiple W & Carr RE (2000): Retinal function in diabetic macular edema after focal laser photocoagulation. Invest Ophthalmol Vis Sci 41: 3655–3664. [PubMed] [Google Scholar]
- Katz M & Kruger PB (1998): The human eye as an optical system, Chapter 33. In: Tasman W. (ed.). Duane's clinical ophthalmology. Philadelphia: Lippincott; 1–56. [Google Scholar]
- Midena E & Vujosevic S (2012): Visual psychophysics in diabetic retinopathy In: Tombran‐Tink J, Barnstable CJ. & Gardner TW. (eds). Visual dysfunction in diabetes. New York: Springer; 69–103. [Google Scholar]
- Peyman GA, Raichand M & Zeimer RC (1984): Ocular effects of various laser wavelengths. Surv Ophthalmol 28: 391–404. [DOI] [PubMed] [Google Scholar]
- Shimura M, Yasuda K, Nakazawa T, Ota S & Tamai M (2004): Effective treatment of diffuse diabetic macular edema by temporal grid pattern photocoagulation. Ophthalmic Surg Lasers Imaging 35: 270–280. [PubMed] [Google Scholar]
- Striph GG, Hart WM Jr & Olk RJ (1988): Modified grid laser photocoagulation for diabetic macular edema. The effect on the central visual field. Ophthalmology 95: 1673–1679. [DOI] [PubMed] [Google Scholar]
- Virgili G, Parravano M, Menchini F & Evans JR (2014): Anti‐vascular endothelial growth factor for diabetic macular oedema. Cochrane Database Syst Rev 10: CD007419. [DOI] [PubMed] [Google Scholar]
- Vujosevic S, Bottega E, Casciano M, Pilotto E, Convento E & Midena E (2010): Microperimetry and fundus autofluorescence in diabetic macular edema: subthreshold micropulse diode laser versus modified early treatment diabetic retinopathy study laser photocoagulation. Retina 30: 908–916. [DOI] [PubMed] [Google Scholar]