

Summary
Switchgrass (Panicum virgatum L.) is considered a model herbaceous energy crop for the USA, for its adaptation to marginal land, low rainfall and nutrient‐deficient soils; however, its low biomass yield is one of several constraints, and this might be rectified by modulating plant growth regulator levels. In this study, we have determined whether the expression of the Zea mays gibberellin 20‐oxidase (ZmGA20ox) cDNA in switchgrass will improve biomass production. The ZmGA20ox gene was placed under the control of constitutive CaMV35S promoter with a strong TMV omega enhancer, and introduced into switchgrass via Agrobacterium‐mediated transformation. The transgene integration and expression levels of ZmGA20ox in T0 plants were analysed using Southern blot and qRT‐PCR. Under glasshouse conditions, selected transgenic plants exhibited longer leaves, internodes and tillers, which resulted in twofold increased biomass. These phenotypic alterations correlated with the levels of transgene expression and the particular gibberellin content. Expression of ZmGA20ox also affected the expression of genes coding for key enzymes in lignin biosynthesis. Our results suggest that the employment of ectopic ZmGA20ox and selection for natural variants with high level expression of endogenous GA20ox are appropriate approaches to increase biomass production of switchgrass and other monocot biofuel crops.
Keywords: gibberellin, gibberellin 20‐oxidase, biofuel, biomass, switchgrass
Introduction
Biofuels are an important component of the energy sources of the planet, and there is great need for developing biofuel feedstock crops (Carroll and Somerville, 2009; Sticklen, 2008). Switchgrass (Panicum virgatum L.) was the first plant selected for bioenergy by U.S. Department of Energy in the 1990s (McLaughlin and Kszos, 2005). This perennial C4 grass has high productivity across different environments and is adapted to marginal land, low rainfall regions and nutrient‐deficient soil (Fike et al., 2006). Switchgrass produces net positive renewable energy and has positive environmental benefits (Schmer et al., 2008). U.S. Department of Energy and U.S. Department of Agriculture have projected a national goal for biofuel to supply 20% transportation fuels by 2030. About 1 billion dry tons of biomass will be annually required for the goal, of which one‐third of the biomass will come from perennial feedstock such as switchgrass. Therefore, increasing biofuel crop yields is a major goal of U.S. biomass energy research programme (Sanderson et al., 2006). Numerous factors affecting plant biomass production have been studied and applied in attempts to gain higher crop vegetative yields (Demura and Ye, 2010). Of these, manipulation of endogenous plant hormone contents is one of the most effective ways to improve plant growth, development and biomass.
Gibberellins (GAs) comprise a large family of diterpenoid carboxylic acids of more than one hundred compounds currently known in higher plants, fungi and bacteria (Hedden and Phillips, 2000; Olszewski et al., 2002; Yamaguchi et al., 2014, 2008). In higher plants, GA1, GA3, GA4 and GA7 are the most common active GAs that control diverse processes of plant growth and development. The complex pathways of bioactive GA biosynthesis in higher plant require three different classes of enzymes and the participation of different cell components (Olszewski et al., 2002; Yamaguchi et al., 2014). In the cytoplasm, the last steps of GA biosynthesis are catalysed by GA20‐oxidase (GA20ox) and GA3‐oxidase (GA3ox) to form various GA intermediates and mature bioactive GAs (Hedden and Phillips, 2000; Olszewski et al., 2002). GA20‐oxidase, a multifunctional enzyme, catalyses several sequential reactions in the formation of inactive gibberellins (GA9, GA20); then, GA3ox introduces a 3β‐hydroxyl group to form the mature products (Yamaguchi et al., 2014).
GA20ox is encoded by genes that have been cloned from various dicots (Carrera et al., 2000; Eriksson et al., 2000; Kang et al., 1999; Phillips et al., 1995) and monocots (Du et al., 2009; Toyomasu et al., 1997). The ectopic expression of genes coding for GA20ox has been shown to increase the levels of bioactive GAs and to affect plant growth and morphology. For example, overexpression of GA20ox caused a higher level of GA4 in Arabidopsis thaliana and consequently to accelerate elongated hypocotyls of seedlings, increasing shoot growth and early flowering (Croker et al., 1999). Overexpression of GA20ox in potato resulted in taller plants and longer leaf petioles (Carrera et al., 2000). Ectopic expression of Arabidopsis GA20ox increased bioactive GAs in transgenic tobacco, leading to increased plant growth and biomass production (Biemelt et al., 2004). In citrus, overexpression of GA20ox modified plant architecture. Transgenic citrus plants had much longer thorns and typical organs at juvenile stages. In addition, higher levels of active GA1 were also observed in these plants (Fagoaga et al., 2007). In hybrid aspen (Eriksson et al., 2000), ectopic expression of GA20ox gene increased growth rate and biomass, and caused more and longer fibres compared to wild‐type plants.
In rice, Ayano et al. (2014) showed that expression of GA20ox correlated with GA1 and GA4 content and has a role in internode elongation, but most studies in monocots have focused on down‐regulation of GA20ox gene to reduce plant height and increase reproductive yields (Sasaki et al., 2002). Overall, these results indicate that altering the expression of GA20ox changes GA levels, and consequently also plant growth, development and biomass production.
Here, we report that the expression of ZmGA20ox cDNA in switchgrass results in elevation of bioactive GA levels and altered plant architecture with longer internodes, leaves and increased fresh and dry biomass. Moreover, the expression of ZmGA20ox was found to affect expression of genes in lignin biosynthesis. Our results suggested that ectopic ZmGA20ox is a viable approach for increased biomass for biofuel production by switchgrass and possibly other energy monocots.
Results
Generation of transgenic switchgrass plants with ZmGA20ox
Using binary construct for overexpression of ZmGA20ox and Agrobacterium‐mediated transformation, more than 20 transgenic switchgrass events were produced and confirmed based on the leaf painting and genomic PCR using specific primers for ZmGA20ox and hptII genes (Figures 1 and S1, and Table S1). After 2 months of growth under glasshouse conditions, phenotypic differences became obvious among the transgenic events compared to WT control plants. All transgenic events exhibited longer tillers (Figures 2, 3 and 4) and could be divided into four groups: group 1—more tillers but the same growth as WT; group 2—more tillers and much faster growth than WT; group 3—fewer tillers and much faster growth than WT; and group 4—very thin leaves and more tillers and much faster growth than WT. Groups 1–4 exhibited 12.7%, 39.8%, 47.1% and 80% increase in tiller height, respectively, as compared to WT (Figure 3). The longer tillers of transgenic plants were the results of longer internodes and leaves, typical of morphological changes caused by GA3. Group 1 plants displayed less change in internode and leaf elongation than remaining groups. Of all groups, group 4 had the largest increase in leaf (42.7%) and internode (approximately 120%) length (Figures 3 and 4).
Figure 1.

Schematic of the T‐DNA region of the binary construct for switchgrass transformation. 35S Poly A: CaMV35 poly A terminator; hptII: hygromycin phosphotransferase II gene; CaMV35S, CaMV35S promoter; ZmGA20ox, Z. mays Gibberellin (GA) 20‐oxidase; OCS poly A, octopine synthase terminator.
Figure 2.
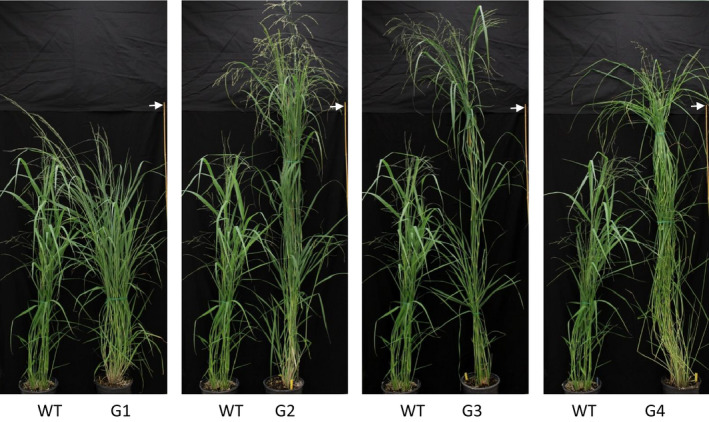
Switchgrass phenotypes. G1‐G4, transgenic groups 1–4, respectively; WT, wild‐type control. Arrow indicates height measurement (bar = 180 cm).
Figure 3.
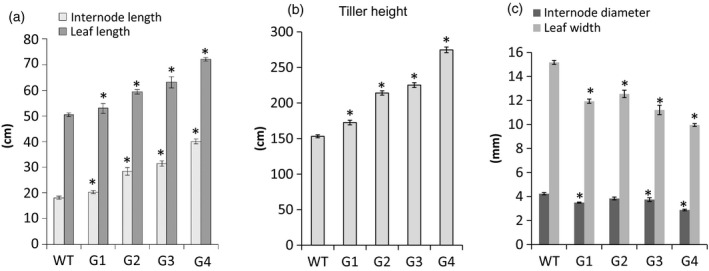
Morphology of T0 transgenic plants. G1‐G4, transgenic groups 1–4, respectively; WT, wild‐type control. *Significant difference at P < 0.05.
Figure 4.
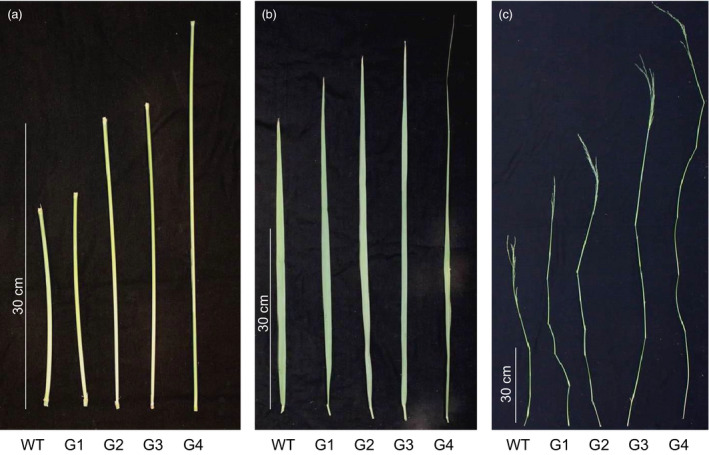
T0 plant morphology. (a) Internodes; (b) leaves; (c) tillers. G1‐G4, transgenic groups 1–4; WT, wild‐type.
All transgenic switchgrass plants exhibited a reduction in internode diameter and leaf width. The internode diameter of transgenic plants was reduced to between 2.90 mm and 3.84 mm compared to 4.23 mm of WT plants (Figures 3 and 4). The average leaf width of transgenic plants was between 10 mm (group 4) and 12.5 mm (group 2), whereas that of WT plants was 15.2 mm. There was a correlation between the increase in internode and leaf length and the reduction in internode diameter and leaf width of transgenic plants except for group 1. Transgenic plants of this group showed a significant reduction in internode diameter as compared to group 2. Interestingly, a substantial increase in the number of tillers appears to be compensated by the decreased internode diameter and leaf width. Other groups displayed similar growth phenotypes, that is the longer leaves and internodes were compensated by the narrow leaves and small internode diameters. In addition, group 4 exhibited a weak tiller phenotype that could not stand up well. Curling leaves also occurred in plants of this group.
Effects of ectopic ZmGA20ox on growth rate, biomass and flowering time
ZmGA20ox transgenic switchgrass plants exhibited increased growth rate, especially during vegetative development stage, and faster tiller emergence and elongation were observed in all transgenic lines. For tiller number, groups 2, 3 and 4 transgenic and WT plants had no significant difference in the number of tillers of each plant. By contrast, group 1 transgenic plants had a remarkable increase in the number of tillers (by approximately 130%) compared to WT plants (Table 1). Interestingly, all transgenic groups showed increases in both fresh and dry biomass weight, but a 19.7%–34.8% reduction in fresh to dry weight ratios, respectively. Specifically, groups 1, 2 and 3 displayed a 1.8‐ to twofold increase in the whole dry biomass as compared to WT plants, whereas group 4 had insignificant increase in dry biomass. To reconfirm the faster growth of transgenic plants, the tillers were cut and the growth rates measured again. One month after cutting back, tillers of ectopic ZmGA20ox plants were 50.5%–86.9% higher than WT plants (Figure S2).
Table 1.
Tiller number and biomass
| Groups | Tiller number | Dry weight (g) | Fresh/dry ratio |
|---|---|---|---|
| WT | 23.7 | 50.7 | 4.51 |
| G1 | 54.5a | 108.9a | 3.01a |
| G2 | 31.5 | 103.1a | 3.31a |
| G3 | 17.3 | 94.2a | 2.94a |
| G4 | 28.8 | 80.6 | 3.62a |
Significance relative to wild‐type at P ≤ 0.05.
Switchgrass flowering was observed at the R1 stage of individual tiller (Hardin et al., 2013), but flowering times were not correlated with faster growth rate. At 12 weeks under glasshouse condition, wild‐type plants exhibited more than 17% flowering tillers, but for transgenic plants, that varied from 0% to 10.6% (Figure S4). Flowering tillers of wild‐type switchgrass reached a peak (96%–100%) at 17 weeks. However, the rate of flowering tillers of transgenic switchgrass gradually increased and ranged from 48.1% to 70.2%.
Cell size changed in ZmGA20ox transgenic plants
We examined the effect of ZmGA20ox overexpression on internode cell size of transgenic plants from group 4 using fluorescence microscopy (Figure 5). Both longitudinal and cross sections of transgenic plant (G4‐1) showed smaller pith and xylem cells, and transgenic xylem cells displayed 22.8% reduction in average cell size, while the reduction in pith cell size was 36.6% as compared to wild‐type plants (Table 2). These data were consistent with decreased tiller thickness and smaller internode diameter. There was no difference in the vascular bundle distribution in stems and the pith cell length between transgenic plants and wild‐type control (Figure 5 and Table 2). Both wild‐type and transgenic plants exhibited three circles of vascular bundles in the cross section of fully elongated internodes at the same developmental stage. Therefore, the longer internodes and leaves of ZmGA20ox transgenic plants could be caused by the increase in cell division at the position of leaf divisional zones and intercalary meristems.
Figure 5.
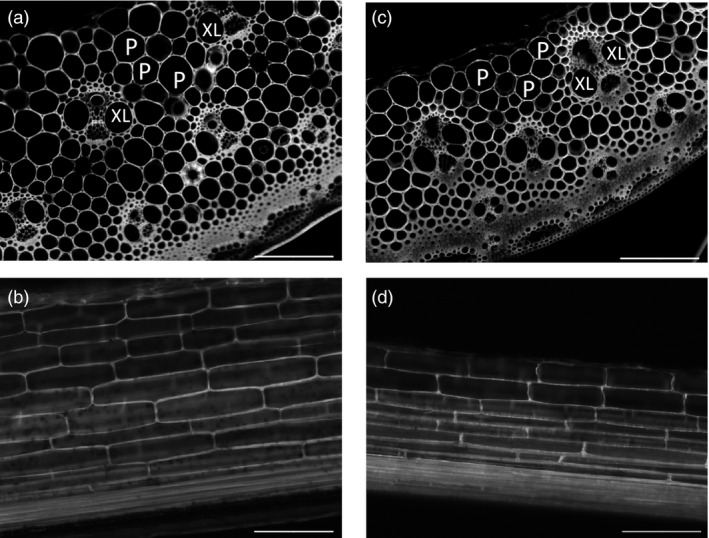
Fluorescent microscopy of plant tissues. P, pith cells; XL, xylem cells. (a) and (b). Cross and longitudinal sections of wild‐type internodes, respectively. (c) and (d). Cross and longitudinal sections of transgenic internodes, respectively. Bar: 200 μm at 10× magnification.
Table 2.
Cell measurements
| Plants | Number of Pith cells/mm2 | Pith cell length (μm) | Xylem cell size (μm2) |
|---|---|---|---|
| WT | 440.31 ± 10.20 | 247.47 ± 6.3 | 3773.78 ± 73.24 |
| G4‐1 | 694.62 ± 35.44a | 243.43 ± 6.6 | 2914.67 ± 77.05a |
Significance relative to wild‐type at P ≤ 0.01.
Transgenic phenotypes correspond to GA20ox transcript and GAs levels
Transgene integration patterns of various phenotypic groups were analysed. Several events in each group were randomly selected for Southern blot using ZmGA20ox and hptII partial open‐reading frames as probes, respectively. Genomic DNA was digested with restriction enzyme BamHI, which cuts once within the T‐DNA region, allowing identification of different events and estimation of the number of transgene copies (Figures 1 and 6). When the hptII probe was used, varying banding patterns were shown in transgenic samples, whereas no hybridizing band was detected in wild‐type plants (Figure 6a). However, when the ZmGA20ox probe was used, besides varying molecular weight bands corresponding to the transgene, a 4‐kb hybridizing band was shown in all samples including wild‐type plant. This band is believed to be the endogenous GA20ox gene which shares a high degree of sequence homology with ZmGA20ox (Figure 6b).
Figure 6.
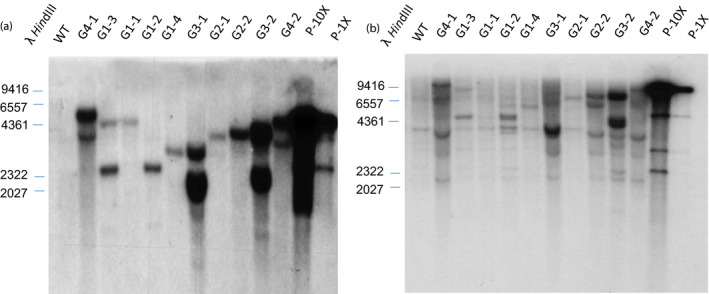
Southern blot analysis of T0 events using hptII probe (a) and GA20ox probe (b), WT, wild‐type control; G1‐G4, random samples from various groups; P‐10X and P‐1X, plasmid digestion representing 10× and 1× genome equivalents.
We analysed transgene expression and GA levels using a representative event from each group. RNA samples isolated from whole tillers at elongation stage E1 of these events were used for cDNA synthesis, and then for both RT‐PCR and quantitative real‐time PCR (qRT‐PCR) with GA20ox primers (Table S1). The RT‐PCR and qRT‐PCR results were consistent, showing increases in the transcript abundance of transgenic events from the four main groups (Figure 7). Transgenic event G1‐3 showed 4.4‐fold increase in the transcription level of GA20ox compared to WT control, while that for other events ranged from 16.3‐ to 17.7‐fold. These results agreed with the phenotypic changes of these transgenic groups as described above. No significant difference in the transcript abundances was found between transgenic lines among groups 2, 3 and 4.
Figure 7.
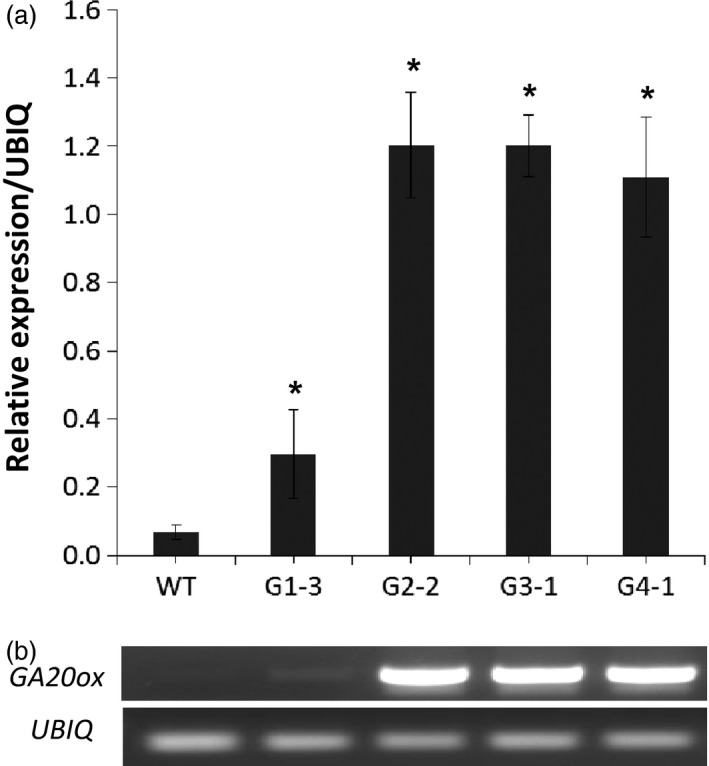
Transcript abundance of GA20ox in representative event of each group (G1‐3, G2‐2, G3‐1, and G4‐1) compared to wild‐type (WT). Quantitative real‐time PCR analysis of GA20ox transcript levels (a) and RT‐PCR gel analysis of GA20ox and UBIQ transcripts (b). *Significant relative to WT (P < 0.05).
We then analysed GA in ZmGA20ox transgenic events, and focused on GA1 and GA4, two bioactive GAs in higher plants (Table 3). The levels of endogenous GAs were correlated to the degrees of altered transgenic phenotypes. Wild‐type and G1‐3 plants had very low levels of GA1 and GA4 that could not be detected by our current GAs detection system. A high concentration of GA4 (7.4 ng/g) was recorded, whereas GA1 was not detectable in transgenic event G2‐2. Both GA1 and GA4 were detected in transgenic events G3‐1 and G4‐1 at high levels. Importantly, the highest content of bioactive GAs occurred in G4‐1 transgenic plant that had the most significant alteration of phenotype. Furthermore, a higher concentration of GA4 than GA1 was found in all GA‐detectable transgenic plants.
Table 3.
Concentration of bioactive gibberellins (GAs) in whole tiller at E1 stagea
| GAs | WT | G1‐3 | G2‐1 | G3‐1 | G4‐1 |
|---|---|---|---|---|---|
| GA1 | n.d. | n.d. | n.d. | 1.2 ± 0.12 | 1.6 ± 0.12 |
| GA4 | n.d. | n.d. | 7.4 ± 0.94 | 4.3 ± 0.40 | 10.5 ± 0.92 |
Concentration in nanograms per gram fresh weight, as means of three independent measurements.
nd, not detectable.
Effects of ectopic ZmGA20ox on lignin gene expression
To explore whether changes in GA20ox expression affected lignin biosynthesis, transcripts of three genes coding for enzymes in lignin biosynthesis pathway were analysed by qRT‐PCR. Of these, 4CL (4‐coumarate: CoA ligase) is an enzyme in the early steps of this pathway, while cinnamyl alcohol dehygrogenase (CAD) and caffeic acid 3‐O‐methyltransferase (COMT) catalyse the final steps of monolignol biosynthesis. In group 4 transgenic plants (G4‐1), GA20ox expression level correlated with transcript levels of lignin genes, showing a significant increase in the transcript abundance of all three lignin genes (Figure 8). However, remaining groups had only a minor change in the expression levels of these lignin genes. For example, in group 2 plants (G2‐2), the expression of 4CL gene was clearly increased, but CAD and COMT expressions had no significant change. The phloroglucinol‐HCl staining for lignin was associated with an altered expression of pathway‐specific genes (Figure S3). Much higher lignin accumulation was observed in internode cross sections of transgenic group 4, where lignin staining was exhibited not only in sclerenchyma cell walls but also clearly in parenchyma cell walls. Compared to wild‐type, transgenic group 1 did not show a clear change in lignin accumulation. In addition, groups 2 and 3 had a slight increase in lignin content.
Figure 8.
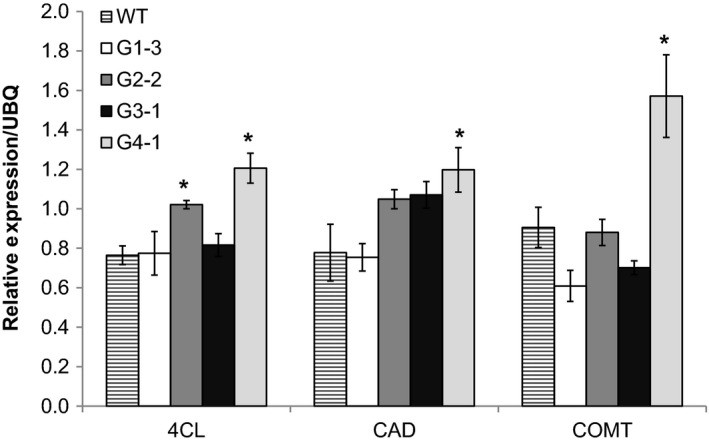
Relative expressions of lignin genes in transgenic switchgrass and wild‐type by qRT‐PCR. 4CL, 4‐coumarate:CoA ligase; CAD, cinnamyl alcohol dehygrogenase; COMT, caffeic acid 3‐O‐methyltransferase. *Significant relative to wild‐type (P < 0.05).
Discussion
GA20 oxidase is a key enzyme in the pathways of bioactive GA biosynthesis in higher plants, and its overexpression has been shown to alter plant phenotypes and to increase relative growth rates in many plant species. Biomass improvement by modulation of GA20ox genes has been achieved in some dicot plants such as tobacco and hybrid aspen (Biemelt et al., 2004; Eriksson et al., 2000). In this study, the observed alteration of plant architecture of transgenic switchgrass with the ZmGA20ox gene under the control of the CaMV35S promoter resembled that in dicots (Biemelt et al., 2004; Carrera et al., 2000; Croker et al., 1999; García‐Hurtado et al., 2012), maize (Voorend et al., 2015) as well as that of exogenous applications of GA3 to other monocots (Tsai and Arteca, 1985). These architecture changes included longer leaves, internodes and tillers but smaller leaves and internode diameters compared to wild‐type control plants. These morphological changes were highly corresponded with the expression of GA20ox and bioactive GA levels, which were higher than the wild‐type control. Furthermore, varied phenotypes of these groups were correlated to the different contents and forms of bioactive GAs, respectively. Finally, higher biomass and reduced dry‐fresh weight ratios were obtained in all transgenic plants. The present work is the first study to report the ectopic expression of GA20ox in switchgrass for improving biomass.
Bioactive GA1 and GA4 are produced at the final stage of GA biosynthesis catalysed through two parallel pathways, involving 13‐hydroxylation and the non‐13‐hydroxylation (Vidal et al., 2001). Higher contents of GA1 than GA4 were shown in the GA20ox overexpressing transgenic citrus (Citrus sinensis) (Fagoaga et al., 2007) and Populus (Eriksson et al., 2000). In contrast, ectopic GA20ox in potato (Solanum tuberosum) displayed much higher contents of GA4 in apical shoots (Carrera et al., 2000). The same result was obtained in both shoots and fruits of transgenic tomato (Solanum lycopersicum). The phenotypes of GA20ox transgenic tomato plants were due to the increase of bioactive GA4 content (García‐Hurtado et al., 2012), whereas both GA4 and GA1 had function in internode elongation of deepwater rice (Ayano et al., 2014). In the current study, the same altered phenotypes were exhibited by G2‐2 and G3‐1 lines, even though the lower content of GA4 but higher level of GA1 occurred in the G3‐1 line. In addition, the largest phenotypic alteration of transgenic line G4‐1 was consistent with the highest levels of GA1 and GA4 (Table 3). These data indicate that the elongated phenotypes of ZmGA20ox transgenic switchgrass resulted from the activation of both bioactive GAs.
Longer internodes in CcGA20ox1 overexpression citrus could be correlated to cell divisions (Fagoaga et al., 2007). Similar results were observed in the transgenic AtGA20ox Populus trees (Eriksson et al., 2000). By contrast, transgenic AtGA20ox tobacco plants showed longer shoots that resulted from both cell divisions and elongation (Biemelt et al., 2004). The occurrence of cell division and elongation events corresponded to the regions of active GA biosynthesis and signalling (Kaneko et al., 2003). Moreover, in the study of GA biosynthesis and signal transduction in rice, Ayano et al. (2014) found that internode elongation was induced by the accumulation of GA during submergence. The activation of intercalary meristem located in the nodes was proposed as a driving force in internode elongation. GA levels were suggested to regulate the growth of maize leaves by spatial control of cell division (Nelissen et al., 2012). In our study, no difference in the length of pith cells between transgenic lines and wild‐type control plant was found. Therefore, the elongated internodes and leaves of ZmGA20ox transgenic plants were possibly consequences of the increased cell divisions in the leaf divisional zones, leaf primordia and intercalary meristems under higher levels of GAs (Figure 5 and Table 2).
Gibberellin deficiency by ectopic expression of GA2ox promoted earlier tiller formations, and higher tiller number was indicated in rice (Lo et al., 2008) and switchgrass (Wuddineh et al., 2015). However, the number of switchgrass tillers was not correlated with the GA levels. The semi‐dwarf switchgrass lines showed an increase in tiller number, whereas dwarf lines displayed a reduction in number of tillers per plant relative to wild‐type controls (Wuddineh et al., 2015). On the other hand, GAs were shown to increase tiller numbers of Welsh onion by initiating and promoting axillary bud development (Yamazaki et al., 2015). In addition, Ni et al. (2015) reported that GAs induced the formation of secondary buds as well as promoted shoot branching of some perennial woody plants by synergistically acts with cytokinin. In our study, there was no significant difference in tiller number between transgenic groups showing high levels of GAs and nontransgenic wild‐type plants. However, a remarkable increase in the number of tillers was observed in transgenic group 1, which showed a slight increase in GA20ox transcript abundance. To reconcile the effects upon switchgrass tillering by different levels of GA deficiency (semi‐dwarf and dwarf switchgrass) (Wuddineh et al., 2015), it is possible that switchgrass tiller formation and development may be impacted by different levels and components of bioactive GAs.
The overexpression of GA20ox in Arabidopsis promoted flowering (Blázquez and Weigel, 2000; Rieu et al., 2008). By contrast, GAs were indicated to inhibit flowering in grapevine (Boss and Thomas, 2002) and a similar observation was made in tomato (García‐Hurtado et al., 2012). Recently, Yamaguchi et al. (2014) reported that GA inhibits switch flower formation in Arabidopsis by interactions with genes promoting floral fate such as the EUI‐LIKE P450 A1 gene (ELA1), LEAFY transcription factor (LFY) and also DELLA proteins. The up‐regulation of ELA1 and LFY reduces the levels of GAs such as GA4. In our study, ZmGA20ox transgenic switchgrass exhibited a slight delay of flowering time compared to wild‐type control plants (Figure S4). Therefore, high levels of GAs, especially GA4, may negatively affect switchgrass flower formation. This speculation could be supported by the correlation between the slow flowering and the high GA4 contents in transgenic lines G2‐2 and G4‐1 (Figure S4 and Table 3). Moreover, no effect on flowering was observed in some plant species as a result of either GA abundance (Gallego‐Giraldo et al., 2007) or GA deficiency (Dijkstra et al., 2008). Therefore, the role of GAs on flowering varies and depends on the species. More research needs to be conducted to understand this complex mechanism.
Biomass yield and quality traits are two important criteria in selecting switchgrass for biofuel production. In our study, we found the association between the altered lignin gene expression, the lignin staining results and the levels of bioactive GAs in ectopic ZmGA20ox transgenic switchgrass. In transgenic group 4 (line G4‐1), the stronger lignin gene expression and histological staining correlated with the higher contents of GA1 and GA4. This observation is consistent with the results of lignin deposition study in tobacco under the GA20ox overexpression and different GA3 concentration treatments (Biemelt et al., 2004). Interestingly, in our study, some transgenic groups showed increased biomass production while displaying no significant change in lignin genes expression.
In summary, this is the first study on the effects of ectopic GA20ox expression on morphology and biomass of switchgrass. ZmGA20ox transgenic plants exhibited drastic alterations in plant phenotypes resulting in longer leaves and internodes. The increased growth rate caused increased fresh and dry biomass, and demonstrates a means to improve the biomass production of this feedstock and possible other cellulosic crops. Furthermore, the insignificant increase of lignin gene expression and lignin contents in those good phenotype groups should be desirable as bioenergy feedstock. Thus, the expression of ectopic GA20 oxidase could be a good experimental approach to benefit biomass production of monocot plants. Results from this study also implies that the use of variation in the natural GA20ox gene expression would be a viable means to select for improved varieties with higher biomass, avoiding the outcrossing risk of transgenic switchgrass pollen.
Experimental procedures
Vector construction and plant transformation
The open‐reading frame (1116 bp) of Zea mays GA20 oxidase (ZmGA20ox) from Genbank (NM_001112453.1) coding for 311 amino acids was synthesized by GenScript (Piscataway, NJ, USA). The EcoRI/HindIII fragment encompassing the ZmGA20ox gene and 35S promoter plus TMV Omega enhancer sequence was inserted into binary vector pCAMBIA1300 to generate transgenic T‐DNA construct (Figure 1), which was mobilized into Agrobacterium tumefaciens strain AGL1 for switchgrass transformation by the protocol of Li and Qu (2011) with modifications. Embryogenic calli were induced from mature seeds of switchgrass cultivar Alamo. Hygromycin B (Invitrogen™ Life Technologies, Carlsbad, CA, USA) was added to selected medium at 50 mg/L.
Growth condition, leaf painting, sample collection and measurement
Transgenic switchgrass events were grown in glasshouses with day/night temperatures of 28/21°C, a photoperiod of 16 h light/8 h dark, in 3‐gal pots containing Promix soil supplemented by Osmocote (14‐14‐14) (Hummert International, Earth City, MO). Leaf painting was carried out by swiping 1 g/L hygromycin B solution onto the upper suffice of a leaf, and results were recorded 1 week later (Figure S1). The phenotypic data including the morphology of leaves, internodes and tillers were collected at R1 stage (Hardin et al., 2013). Internodes (I3 and I4) and their leaves were subjected to phenotypic observations. The above‐ground tissues were harvested when 50% of tillers reached R2 stage for biomass measurements. Dried weight was calculated after switchgrass samples were dried in an oven at 45°C for 96 h.
PCR and Southern blot
Gene‐specific primers (Table S1) were used for PCRs to confirm the presence of transgenes, and Southern blots were used to confirm their integration into the genome. Genomic DNA was extracted from switchgrass leaf tissue using a CTAB procedure modified from (Dellaporta et al., 1983). For Southern blot analysis, 30 μg purified DNA was digested by a restriction enzyme that cut once within the T‐DNA region. Digested DNA fragments were fractionated on a 2.0% agarose gel prior to transfer to Zeta‐Probe® GT nylon membrane (Bio‐Rad, Hercules, CA, USA). DNA was fixed to nylon membrane by UV cross‐link. Hybridization and membrane washing were conducted based on the Zeta‐Probe® GT manufacturer's instructions at 65°C. Prime‐It® RmT Random Primer Labeling Kit (Stratagene, La Jolla, CA, USA) was used to generate 32P‐labelled probes of ZmGA20ox (from synthetic transgene template) or hptII (from pCAMBIA1300 vector).
Quantitative real‐time PCR
Total RNA was extracted from a whole tiller of wild‐type and transgenic switchgrass plants at elongation E1 stage (Hardin et al., 2013) using TRIZOL® Reagent according to the manufacture's protocol (Invitrogen™ Life Technologies). The isolated RNA was treated with DNase‐I (InvitrogenTM Life Technologies) to remove genomic DNA contamination. The first‐strand cDNA was synthesized from the DNase‐treated RNA using M‐MLV Reverse Transcriptase and Oligo‐dT primer (Promega, Madison, WI, USA). RT‐PCR was carried out using specific primers for ZmGA20ox gene (Table S1). qRT‐PCR was conducted using iQ™ SYBR® Green Supermix (Bio‐Rad). The data were normalized using the levels of switchgrass ubiquitin (UBQ) transcripts (Xu et al., 2011). The primers used for qRT‐PCR were the same as described above for RT‐PCR (Table S1). Transcript abundance was quantified using three independent biological replicates.
Microscopy and cell size measurement
Images of cross and longitudinal sections of fully elongated internodes were captured under Olympus IX70 Inverted Microscope with ORCA‐ER Digital Camera fluorescence optics at 10×. Images were analysed by MetaMorph Microscopy Automation and Image Analysis software to identify cell size, length and number.
Lignin staining
For lignin staining, internode samples were collected at reproduction developmental stage (R1). Internode were cut by Vibratome series 3000 to generate 60 μm cross sections and cleared by ethanol overnight. Cleared sections were immersed in 1% chloroglucinol staining solution (in 2 : 1 ethanol/HCl) for 2 min (Baum, 2008; Bart et al., 2010; Wuddineh et al., 2015). The cross sections were placed on microscopy slides and covered by coverslip. The edges of the slides were sealed with commercial sealant and examined under Leica DM 5500B Compound Microscope with Leica DFC290 Color Digital Camera at 10×.
GA quantification
Gibberellins were extracted in cold methanol:isopropanol:acetic acid (20:79:1, v/v/v) from samples spiked with deuterium‐labelled internal standards of GA1 (D2‐GA1; Olkemim Ltd, Olomouc, Czech Republic). After centrifugation at 16 000 g, the supernatants were collected and pellet extraction repeated. The pooled supernatants were evaporated and the resulting pellet re‐dissolved in 200 μL of 30% methanol. Chromatographic separation of metabolites was accomplished using a 3C18‐EP‐120 column (0.5 mm × 100 mm; Eksigent, Dublin, CA, USA) using a mobile gradient of 85% solvent A (0.1% acetic acid in HPLC‐grade water, v/v) to 95% solvent B (0.1% acetic acid in 90% acetonitrile, v/v) in 6 min at a flow rate of 15 μL/min. A 6500‐QTRAP (AB Sciex, Foster city, CA, USA) was used to acquire MS spectra. Parameters for analysis were set as follows: ESI in the negative mode (TurboIonSpray), capillary voltage −4500, nebulizer gas 25 arbitrary units (a.u.), heater gas 25 a.u., curtain gas 10 a.u., collision activation dissociation −2 and temperature 250°C. Gibberellins GA1 and GA4 were detected using multiple reaction monitoring (MRM) transitions that were optimized using the standards (GA1 and GA4; Olkemim Ltd) and the deuterium‐labelled standard. Concentrations were determined from standard curves of known GA concentrations.
Data analysis
Comparisons between transgenic and wild‐type control plants were made by Turkey's least significant difference procedure using one‐way ANOVA and t‐test in SPSS software (ver.20; Chicago, IL). Standard errors are provided for statistical diagrams as appropriate. The asterisks on the bars in the figures and the tables indicate a significant difference from the wild‐type controls at P < 0.05 or 0.01 levels.
Supporting information
Figure S1 Switchgrass leaf painting using hygromycin B.
Figure S2 Effects of ZmGA20ox overexpression on plant growth rate.
Figure S3 Lignin staining of internode cross sections. (a) Wild‐type; (b) G1‐3; (c) G2‐2; (d) G3‐1; (e) G4‐1.
Figure S4 Flowering time of ZmGA20ox overexpression plants.
Table S1 Primers used in this study.
Acknowledgements
The authors thank Dr. William Folk for proofreading of the manuscript and helpful suggestions, and Drs. David Braun and David Mendoza for helpful discussions. Thanks are also extended to Neng Wan (Dr. Zhang's lab) for his help with glasshouse work, Dr. Sophie Alvarez and the Proteomics Facility at The Donald Danforth Plant Science Center, St. Louis, MO, for assistance with the mass spectrometry (supported by NSF Grant No. DBI‐1427621 for acquisition of the QTRAP LC‐MS/MS), and the Molecular Cytology Core at University of Missouri for microscopy analysis. P.T. Do was supported by the Vietnam Educational Foundation. The authors have no conflict of interest to declare.
References
- Ayano, M. , Kani, T. , Kojima, M. , Sakakibara, H. , Kitaoka, T. , Kuroha, T. , Angeles‐Shim, R.B. et al. (2014) Gibberellin biosynthesis and signal transduction is essential for internode elongation in deepwater rice. Plant Cell Environ. 37, 2313–2324. [DOI] [PMC free article] [PubMed] [Google Scholar]
- Bart, R.S. , Chern, M. , Vega‐Sánchez, M.E. , Canlas, P. and Ronald, P.C . (2010). Rice Snl6, a cinnamoyl‐CoA reductase‐like gene family member, is required for NH1‐mediated immunity to Xanthomonas oryzae pv. oryzae . PLoS Genet. 6, e1001123. [DOI] [PMC free article] [PubMed] [Google Scholar]
- Baum, S. (2008) Preparation of Arabidopsis tissue sections of fixed material. CSH Protoc. 10, 1101. [DOI] [PubMed] [Google Scholar]
- Biemelt, S. , Tschiersch, H. and Sonnewald, U. (2004) Impact of altered gibberellin metabolism on biomass accumulation, lignin biosynthesis, and photosynthesis in transgenic tobacco plants. Plant Physiol. 135, 254–265. [DOI] [PMC free article] [PubMed] [Google Scholar]
- Blázquez, M.A. and Weigel, D. (2000) Integration of floral inductive signals in Arabidopsis. Nature, 404, 889–892. [DOI] [PubMed] [Google Scholar]
- Boss, P.K. and Thomas, M.R. (2002) Association of dwarfism and floral induction with a grape “green revolution” mutation. Nature, 416, 847–850. [DOI] [PubMed] [Google Scholar]
- Carrera, E. , Bou, J. , García‐Martínez, J.L. and Prat, S. (2000) Changes in GA 20‐oxidase gene expression strongly affect stem length, tuber induction and tuber yield of potato plants. Plant J. 22, 247–256. [DOI] [PubMed] [Google Scholar]
- Carroll, A. and Somerville, C. (2009) Cellulosic biofuels. Annu. Rev. Plant Biol. 60, 165–182. [DOI] [PubMed] [Google Scholar]
- Coles, J.P. , Phillips, A.L. , Croker, S.J. , García‐Lepe, R. , Lewis, M.J. and Hedden, P. (1999) Modification of gibberellin production and plant development in Arabidopsis by sense and antisense expression of gibberellin 20‐oxidase genes. Plant J. 17, 547–556. [DOI] [PubMed] [Google Scholar]
- Dellaporta, S.L. , Wood, J. and Hicks, J.B. (1983) A plant DNA minipreparation: version II. Plant Mol. Biol. Report. 1, 19–21. [Google Scholar]
- Demura, T. and Ye, Z.‐H. (2010) Regulation of plant biomass production. Curr. Opin. Plant Biol. 13, 298–303. [DOI] [PubMed] [Google Scholar]
- Dijkstra, C. , Adams, E. , Bhattacharya, A. , Page, A.F. , Anthony, P. , Kourmpetli, S. , Power, J.B. et al. (2008) Over‐expression of a gibberellin 2‐oxidase gene from Phaseolus coccineus L. enhances gibberellin inactivation and induces dwarfism in Solanum species. Plant Cell Rep. 27, 463–470. [DOI] [PubMed] [Google Scholar]
- Du, J. , Yao, Y. , Ni, Z. and Sun, Q. (2009) Cloning and characterization of an up‐regulated GA 20‐oxidase gene in hybrid maize. Prog. Nat. Sci. 19, 161–166. [Google Scholar]
- Eriksson, M.E. , Israelsson, M. , Olsson, O. and Moritz, T. (2000) Increased gibberellin biosynthesis in transgenic trees promotes growth, biomass production and xylem fiber length. Nat. Biotechnol. 18, 784–788. [DOI] [PubMed] [Google Scholar]
- Fagoaga, C. , Tadeo, F.R. , Iglesias, D.J. , Huerta, L. , Lliso, I. , Vidal, A.M. , Talon, M. et al. (2007) Engineering of gibberellin levels in citrus by sense and antisense overexpression of a GA 20‐oxidase gene modifies plant architecture. J. Exp. Bot. 58, 1407–1420. [DOI] [PubMed] [Google Scholar]
- Fike, J.H. , Parrish, D.J. , Wolf, D.D. , Balasko, J.A. , Green, J.T. , Rasnake, M. and Reynolds, J.H. (2006) Long‐term yield potential of switchgrass‐for‐biofuel systems. Biomass Bioenergy, 30, 198–206. [Google Scholar]
- Gallego‐Giraldo, L. , García‐Martínez, J.L. , Moritz, T. and López‐Díaz, I. (2007) Flowering in tobacco needs gibberellins but is not promoted by the levels of active GA1 and GA4 in the apical shoot. Plant Cell Physiol. 48, 615–625. [DOI] [PubMed] [Google Scholar]
- García‐Hurtado, N. , Carrera, E. , Ruiz‐Rivero, O. , López‐Gresa, M.P. , Hedden, P. , Gong, F. and García‐Martínez, J.L. (2012) The characterization of transgenic tomato overexpressing gibberellin 20‐oxidase reveals induction of parthenocarpic fruit growth, higher yield, and alteration of the gibberellin biosynthetic pathway. J. Exp. Bot. 63, 5803–5813. [DOI] [PubMed] [Google Scholar]
- Hardin, C.F. , Fu, C. , Hisano, H. , Xiao, X. , Shen, H. , Stewart, C.N. Jr , Parrott, W. et al. (2013) Standardization of switchgrass sample collection for cell wall and biomass trait analysis. Bioenergy Res. 6, 755–762. [Google Scholar]
- Hedden, P. and Phillips, A.L. (2000) Gibberellin metabolism: new insights revealed by the genes. Trends Plant Sci. 5, 523–530. [DOI] [PubMed] [Google Scholar]
- Kaneko, M. , Itoh, H. , Inukai, Y. , Sakamoto, T. , Ueguchi‐Tanaka, M. , Ashikari, M. and Matsuoka, M. (2003) Where do gibberellin biosynthesis and gibberellin signaling occur in rice plants? Plant J. 35, 104–115. [DOI] [PubMed] [Google Scholar]
- Kang, H.‐G. , Jun, S.‐H. , Kim, J. , Kawaide, H. , Kamiya, Y. and An, G. (1999) Cloning and molecular analyses of a gibberellin 20‐oxidase gene expressed specifically in developing seeds of watermelon. Plant Physiol. 121, 373–382. [DOI] [PMC free article] [PubMed] [Google Scholar]
- Li, R. and Qu, R. (2011) High throughput Agrobacterium‐mediated switchgrass transformation. Biomass Bioenergy, 35, 1046–1054. [Google Scholar]
- Lo, S.‐F. , Yang, S.‐Y. , Chen, K.‐T. , Hsing, Y.‐I. , Zeevaart, J.A. , Chen, L.‐J. and Yu, S.‐M. (2008) A novel class of gibberellin 2‐oxidases control semidwarfism, tillering, and root development in rice. Plant Cell, 20, 2603–2618. [DOI] [PMC free article] [PubMed] [Google Scholar]
- McLaughlin, S.B. and Kszos, L.A. (2005) Development of switchgrass (Panicum virgatum) as a bioenergy feedstock in the United States. Biomass Bioenergy, 28, 515–535. [Google Scholar]
- Nelissen, H. , Rymen, B. , Jikumaru, Y. , Demuynck, K. , Van Lijsebettens, M. , Kamiya, Y. , Inzé, D. et al. (2012) A local maximum in gibberellin levels regulates maize leaf growth by spatial control of cell division. Curr. Biol. 22, 1183–1187. [DOI] [PubMed] [Google Scholar]
- Ni, J. , Gao, C. , Chen, M.‐S. , Pan, B.‐Z. , Ye, K. and Xu, Z.‐F. (2015) Gibberellin promotes shoot branching in the perennial woody plant Jatropha curcas. Plant Cell Physiol. 56, 1655–1666. [DOI] [PMC free article] [PubMed] [Google Scholar]
- Olszewski, N. , Sun, T. and Gubler, F. (2002) Gibberellin signaling biosynthesis, catabolism, and response pathways. Plant Cell Online, 14, S61–S80. [DOI] [PMC free article] [PubMed] [Google Scholar]
- Phillips, A.L. , Ward, D.A. , Uknes, S. , Appleford, N.E. , Lange, T. , Huttly, A.K. , Gaskin, P. et al. (1995) Isolation and expression of three gibberellin 20‐oxidase cDNA clones from Arabidopsis. Plant Physiol. 108, 1049–1057. [DOI] [PMC free article] [PubMed] [Google Scholar]
- Rieu, I. , Ruiz‐Rivero, O. , Fernandez‐Garcia, N. , Griffiths, J. , Powers, S.J. , Gong, F. , Linhartova, T. et al. (2008) The gibberellin biosynthetic genes AtGA20ox1 and AtGA20ox2 act, partially redundantly, to promote growth and development throughout the Arabidopsis life cycle. Plant J. 53, 488–504. [DOI] [PubMed] [Google Scholar]
- Sanderson, M.A. , Adler, P.R. , Boateng, A.A. , Casler, M.D. and Sarath, G. (2006) Switchgrass as a biofuels feedstock in the USA. Can. J. Plant Sci. 86, 1315–1325. [Google Scholar]
- Sasaki, A. , Ashikari, M. , Ueguchi‐Tanaka, M. , Itoh, H. , Nishimura, A. , Swapan, D. , Ishiyama, K. et al. . (2002) Green revolution: a mutant gibberellin‐synthesis gene in rice. Nature, 416, 701–702. [DOI] [PubMed] [Google Scholar]
- Schmer, M.R. , Vogel, K.P. , Mitchell, R.B. and Perrin, R.K. (2008) Net energy of cellulosic ethanol from switchgrass. Proc. Natl Acad. Sci. 105, 464–469. [DOI] [PMC free article] [PubMed] [Google Scholar]
- Sticklen, M.B. (2008) Plant genetic engineering for biofuel production: towards affordable cellulosic ethanol. Nat. Rev. Genet. 9, 433–443. [DOI] [PubMed] [Google Scholar]
- Toyomasu, T. , Kawaide, H. , Sekimoto, H. , von Numers, C. , Phillips, A.L. , Hedden, P. and Kamiya, Y. (1997) Cloning and characterization of a cDNA encoding gibberellin 20‐oxidase from rice (Oryza sativa) seedlings. Physiol. Plant. 99, 111–118. [Google Scholar]
- Tsai, D.‐S. and Arteca, R.N. (1985) Effects of root applications of gibberellic acid on photosynthesis and growth in C3 and C4 plants. Photosynth. Res. 6, 147–157. [DOI] [PubMed] [Google Scholar]
- Vidal, A.M. , Gisbert, C. , Talon, M. , Primo‐Millo, E. , Lopez‐Diaz, I. and Garcia‐Martinez, J.L. (2001) The ectopic overexpression of a citrus gibberellin 20‐oxidase enhances the non‐13‐hydroxylation pathway of gibberellin biosynthesis and induces an extremely elongated phenotype in tobacco. Physiol. Plant. 112, 251–260. [DOI] [PubMed] [Google Scholar]
- Voorend, W. , Nelissen, H. , Vanholme, R. , De Vliegher, A. , Van Breusegem, F. , Boerjan, W. , Roldán‐Ruiz, I. et al. (2015) Overexpression of GA20‐OXIDASE1 impacts plant height, biomass allocation and saccharification efficiency in maize. Plant Biotechnol. J. , doi: 10.1111/pbi.12458. [DOI] [PMC free article] [PubMed] [Google Scholar]
- Wuddineh, W.A. , Mazarei, M. , Zhang, J. , Poovaiah, C.R. , Mann, D.G. , Ziebell, A. , Sykes, R.W. , Davis, M.F. , Udvardi, M.K. and Stewart, C.N. (2015) Identification and overexpression of gibberellin 2‐oxidase (GA2ox) in switchgrass (Panicum virgatum L.) for improved plant architecture and reduced biomass recalcitrance. Plant Biotechnol. J. 13, 636–647. [DOI] [PubMed] [Google Scholar]
- Xu, B. , Escamilla‐Treviño, L.L. , Sathitsuksanoh, N. , Shen, Z. , Shen, H. , Zhang, Y.H. , Dixon, R.A. et al. (2011) Silencing of 4‐coumarate:coenzyme A ligase in switchgrass leads to reduced lignin content and improved fermentable sugar yields for biofuel production. New Phytol. 192, 611–625. [DOI] [PubMed] [Google Scholar]
- Yamaguchi, N. , Winter, C.M. , Wu, M.‐F. , Kanno, Y. , Yamaguchi, A. , Seo, M. and Wagner, D. (2014) Gibberellin acts positively then negatively to control onset of flower formation in Arabidopsis. Science, 344, 638–641. [DOI] [PubMed] [Google Scholar]
- Yamaguchi, S. (2008) Gibberellin metabolism and its regulation. Annu Rev Plant Biol. 59, 225–251. [DOI] [PubMed] [Google Scholar]
- Yamazaki, H. , Shiraiwa, N. , Itai, A. and Honda, I . (2015). Involvement of gibberellins in the regulation of tillering in welsh onion (Allium fistulosum L.). Hort. J, 84, 334–341. [Google Scholar]
Associated Data
This section collects any data citations, data availability statements, or supplementary materials included in this article.
Supplementary Materials
Figure S1 Switchgrass leaf painting using hygromycin B.
Figure S2 Effects of ZmGA20ox overexpression on plant growth rate.
Figure S3 Lignin staining of internode cross sections. (a) Wild‐type; (b) G1‐3; (c) G2‐2; (d) G3‐1; (e) G4‐1.
Figure S4 Flowering time of ZmGA20ox overexpression plants.
Table S1 Primers used in this study.