Abstract
Tumor acidosis is a consequence of altered metabolism, which can lead to chemoresistance and can be a target of alkalinizing therapies. Noninvasive measurements of the extracellular pH (pHe) of the tumor microenvironment can improve diagnoses and treatment decisions. A variety of noninvasive imaging methods have been developed for measuring tumor pHe. This review provides a detailed description of the advantages and limitations of each method, providing many examples from previous research reports. A substantial emphasis is placed on methods that use MR spectroscopy and MR imaging, including recently developed methods that use chemical exchange saturation transfer MRI that combines some advantages of MR spectroscopy and imaging. Together, this review provides a comprehensive overview of methods for measuring tumor pHe, which may facilitate additional creative approaches in this research field.
1. Introduction
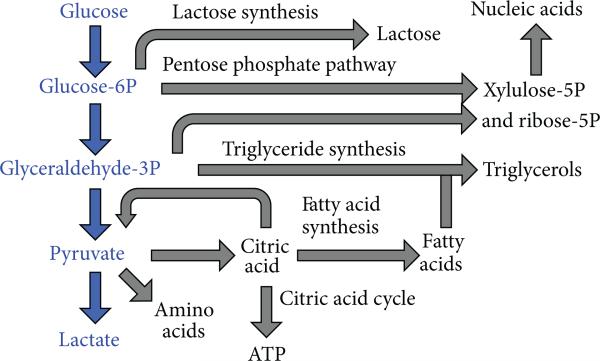
An emerging hallmark of cancer is the dysregulation of cellular energetics, which involves reprograming cellular energy metabolism to most effectively support neoplastic proliferation [1]. Under aerobic conditions, normal cells convert glucose to pyruvate via glycolysis in the cytoplasm and thereafter dispatch the pyruvate to the oxygen-consuming mitochondria to produce carbon dioxide and ATP (Figure 1) [2]. Under anaerobic conditions, pyruvate is converted to lactic acid in the cytosol. This anaerobic metabolism is inefficient as it produces ~18-fold fewer ATP molecules relative to mitochondrial oxidative phosphorylation. Warburg first reported that cancer cells limit their energy metabolism largely to glycolysis, even in the presence of oxygen [3]. Despite lower energy production efficiency, increased glycolysis allows the diversion of glycolytic intermediates into various biosynthetic pathways, including those generating nucleosides and amino acids [4]. This in turn facilitates the biosynthesis of the macromolecules and organelles required for assembling new cells, supporting the active cell proliferation in neoplastic disease.
Figure 1.
Schematic of glycolysis and associated metabolic pathways that create biomolecules for tumor growth. Adapted from [2].
The consequence of increased intracellular production of lactic acid is extracellular tumor acidosis. To maintain an intracellular pH (pHi) that is slightly alkaline (~pH 7.4), tumor cells upregulate several proton extrusion mechanisms such as the Na+/H+ exchanger (NHE), HCO3− transporter, carbonic anhydrase IX, vacuolar-ATPase, and the H+/K+ ATPase [5, 6]. Excess protons are excreted into the extracellular matrix, causing the extracellular pH (pHe) of the tumor microenvironment to become acidic. In certain tumor types such as human MCF-7 mammary carcinoma, the pHe has been measured to be as low as pH 6.44 [6]. Chronic exposure to acidic pHe has been reported to promote invasiveness and metastatic behavior in several tumor types [7–9].
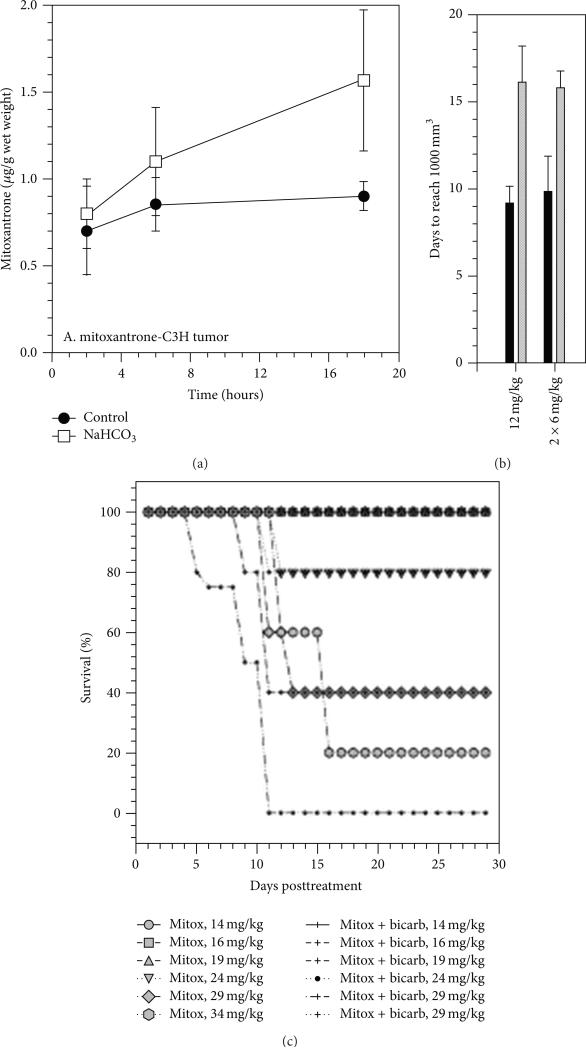
Most chemotherapeutic agents enter cancer cells via passive diffusion across the cell membrane, which requires the agent to be in a nonionized form. Thus, the cell toxicities of weak-base drugs such as daunorubicin, doxorubicin, and mitoxantrone are greatly reduced under acidic conditions [10–12] (Figure 2). When the pH drops below the pKa of these weak bases, they become predominantly protonated and positively charged and are therefore less permeable to cell membranes, resulting in cellular drug resistance. Conversely, weak acid chemotherapeutic drugs such as chlorambucil, cyclophosphamide, and 5-fluorouracil have higher cytotoxicity at lower pH [12]. Hence, knowing the pHe of the tumor microenvironment can enable physicians to select the best chemotherapy based on tumor pHe and provide personalized chemotherapy for each individual patient.
Figure 2.
Tumor acidosis causes chemoresistance against weak-base drugs. (a) Uptake and retention of mitoxantrone, a weak-base drug, was greater in C3H tumor tissue that was neutralized with sodium bicarbonate. (b) Mitoxantrone treatment (1 dose of 12 mg/kg or 2 doses of 6 mg/kg) caused a greater growth delay when sodium bicarbonate neutralized the tumor acidosis. (c) Sodium bicarbonate also improved survival with mitoxantrone treatment. Reproduced with permission from [10].
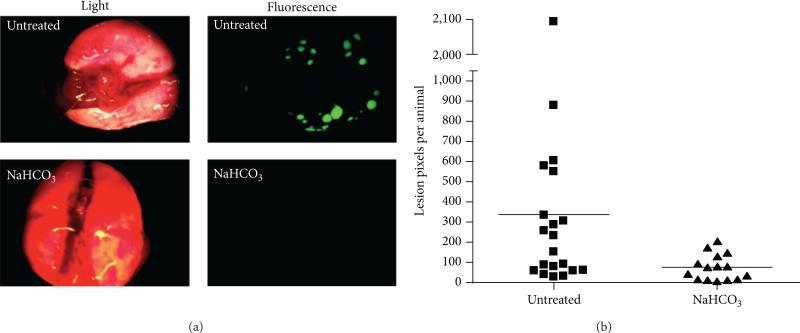
Research has been conducted to investigate alkalinizing therapy as an option to increase tumor pHe that can enhance chemotherapy and counteract acid-mediated invasion and metastasis. In vitro results have shown that the cytotoxicity of doxorubicin has 2.25-fold enhancement when the pH of the cell culture media was raised from 6.8 to 7.4 [13]. In the same study, 200 mM bicarbonate in drinking water was introduced ad libitum to a mouse model of MCF-7 mammary carcinoma. In vivo results showed that the tumor volume of the MCF-7 tumors in mice treated with both bicarbonate and doxorubicin were significantly smaller than mice treated with only doxorubicin (P < 0.03). In another study, bicarbonate treatment was also shown to reduce the formation of spontaneous metastases, with fewer metastatic lung lesions and longer survival times in mouse models of MDA-MB-231 metastatic breast cancer [14] (Figure 3). Computer simulations showed that the addition of a moderate amount of bicarbonate in blood that is ~40% higher than normal serum concentration can reduce the amount of intratumoral and peritumoral acidosis and can almost completely eliminate tumor invasion [15]. Therefore, being able to accurately monitor pHe in tumors and normal tissues will greatly aid in evaluating the utility of alkalinizing treatment for cancer care.
Figure 3.
Treatment of a mouse model of β-galactosidase-labeled MDA-MB-231 mammary carcinoma with 200 mM NaHCO3 ad libitum for 60 days resulted in lower lung metastases as evidenced by (a) β-galactosidase-induced fluorescence staining of lung lesions and (b) the number of lesion pixels per animal. Reproduced with permission from [14].
2. Imaging Methods to Measure In Vivo pH
A variety of biomedical imaging methods have been developed in an attempt to measure tumor pHe (Table 1). Each method has shown a remarkable ability to produce quantitative measurements during in vivo studies, although the accuracies of these quantitative measurements have been difficult to confirm, due to a lack of a “gold standard”. Perhaps more importantly, most of these methods have disadvantages which complicate or eliminate the possibility that the method can be translated to the radiology clinic to diagnose cancer patients. The following descriptions provide a summary of each method, including advantages and disadvantages.
Table 1.
Summary of pH measurement methods with various instruments.
| Method | Sampling time Spatial resolution Agent [C] |
Advantages and disadvantages | Reference |
| Microelectrode | Fast, sec Localized measurement No agent required |
Fast; accurate if calibrated with an external buffer Limited to surface-accessible tumors; requires MRI to guide electrodes into tumors |
[16–18] |
| Fluorescence imaging | Fast, sec 5 μm μM–nM |
Sensitive; low cost; can be used during clinical fluorescence guided surgery Limited to surface-accessible tumors |
[14,19–21, 25–29] |
| PET | 10 min 2 mm nM |
Fast; whole body imaging Requires radioactive isotope; coarse resolution; and limited accuracy |
[22–24, 31] |
| 1H MRS | >30 min 1mm3 mM |
Simultaneous measurement of pHe and detection of metabolites Poor sensitivity; some agents are pH buffers that change tissue pHe |
[34, 39, 40] |
| 31P MRS | 40 min 1cm3 mM |
Can simultaneously measure pHi and pHe Requires a 31P MRI transceiver coil |
[41, 43–46] |
| 19F MRS | 5 min 1cm3 μM–mM |
Fast; good sensitivity Requires a 19F MRI transceiver coil |
[42, 47, 49] |
| Hyperpolarized 13C MRS | 5 sec 0.375 mm3 mM |
Very fast Requires a 13C MRI transceiver coil; requires a hyperpolarizer instrument Short hyperpolarized 13C life time; Measures pHi and pHe |
[48] |
| pH dependent T1 relaxation | <1 min 0.1 mm3 mM |
Fast; high resolution Requires a cocktail of contrast agents |
[50–53] |
| CEST MRI | ~5 min μm–mm mM |
Good specificity Poor sensitivity |
[37] |
3. pH Measurements with Methods other than MRI
3.1. pH Electrode
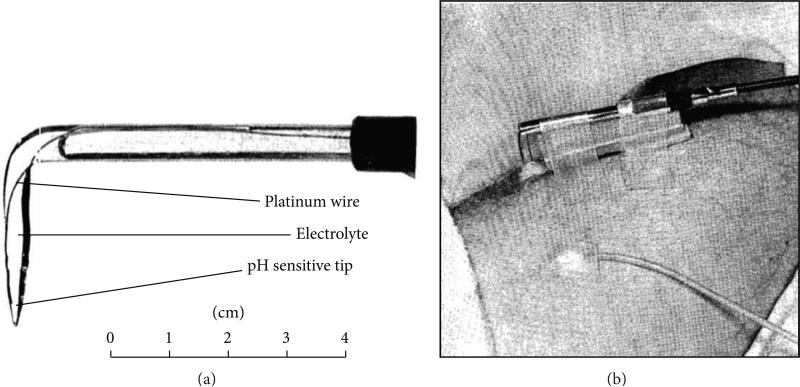
The traditional ion-selective glass electrode is one of the first types of instrumentation that was used to measure pH in a human tumor. Although the use of an electrode is not an imaging method, pH measurements with an electrode are useful to compare to measurements made with noninvasive imaging methods. The pH of surface tumors such as malignant melanomatosis can be measured using a pH electrode because these tumors are easily accessible to the percutaneous technique [16]. At the completion of each procedure, the nodule has to be excised to avoid the possibility of tumor fungating. More recently, a needle-shaped pH electrode has been developed to minimize the invasiveness and improve the speed of this technique (Figure 4). The pH measurement is assumed to be accurate because this micro-electrode can be accurately calibrated with external buffer solutions. The spatial resolution depends on the number of insertions and the spacing between each insertion into the solid tumor, which has ranged between 4 and 20 insertions at 0.5–1.0 cm intervals in tumor studies with canines [17]. When the tumor is not on the surface, an additional localizer step such as MRI is required to locate the tumor and assist the placement of the pH electrode into the tumor and to direct the electrodes away from necrotic areas in the tumor. Due to inevitable tissue damage during electrode insertion into tissue, the measured pH must be a weighted average of pHi and pHe and may also be affected by potential damage to microvasculature [18].
Figure 4.
A pH microelectrode for measuring in vivo tumor pH. (a) A photo of an angled glass electrode with a platinum wire and 0.1 N hydrochloric acid electrolyte. (b) The microelectrode was inserted into a melanoma nodule of a patient, stabilized with sponge rubber between the skin and electrode shaft, and secured with adhesive tape. A calomel reference electrode was secured to the skin. Adapted from [16] with permission.
3.2. Optical Imaging with Fluorescence
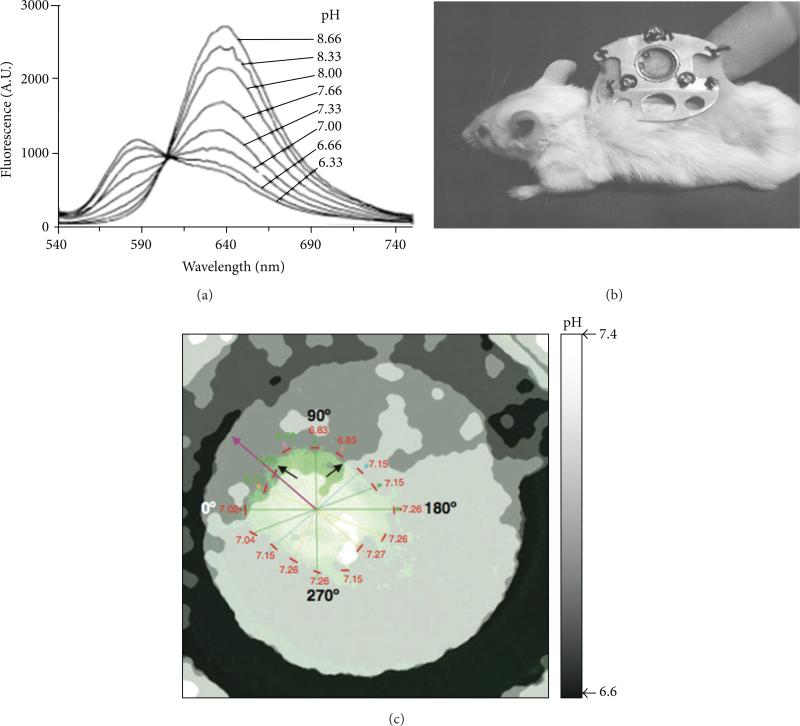
Optical imaging with a fluorescence dye is a low cost imaging tool with great versatility. A fluorescence agent can be engineered to couple with a peptide, antibody, or other biomolecule, which can bind to a tumor biomarker and enhance selectivity for tumor tissue [25]. The pH can be measured independent of concentration by assessing the ratio of fluorescence signals at different emission wavelengths (Figure 5) [19–21, 26] or at different fluorescence lifetimes [27]. Near-infrared (NIR) light at 700–900 nm wavelength is preferred for in vivo imaging because NIR light can propagate through tissue to a depth of approximately one centimeter and still be adequately detected relative to background signals, due to lower tissue absorption and autofluorescence in this wavelength regime [25]. Optical imaging has high sensitivity and can detect nanomolar concentrations of agents. It also has good temporal resolution on the order of seconds [14, 26, 28, 29]. Surface-accessible tumors can be imaged at excellent micronscale spatial resolution. Based on these merits, preclinical optical imaging has been applied to surface-accessible tumors such as the rabbit ear chamber [29] and window chamber models of mammary carcinoma [14], and optical imaging has been used during image-guided surgery that provides access to the surface of tumors [30]. However, optical imaging cannot interrogate tumors that are located in deep tissues, which severely limits the utility of this imaging method for measuring tumor pHe. Furthermore, lower optical signals generated from deeper regions of surface-accessible tumors can weigh the measurement to the characteristics of the tumor surface. For these reasons, pHe measurements with optical imaging have not been translated to routine clinical use.
Figure 5.
Fluorescence imaging of tumor pHe. (a) The emission spectrum of SNARF-1 dye shows that pH is correlated with the ratio of the fluorescence signal at 570/650 nm. (b) A window chamber model can access a solid tumor growing under a coverslip in a skinfold. (c) The parametric map of pHe was determined from the ratio of fluorescence signals of SNARF-1 dye in an in vivo window chamber model of a HCT116-GFP tumor. Black and purple arrows indicate acidic environment toward which the tumor is growing. The pHe values of the tumor edge are listed near short red lines. Reproduced with permission from [19–21].
3.3. Positron Emission Tomography
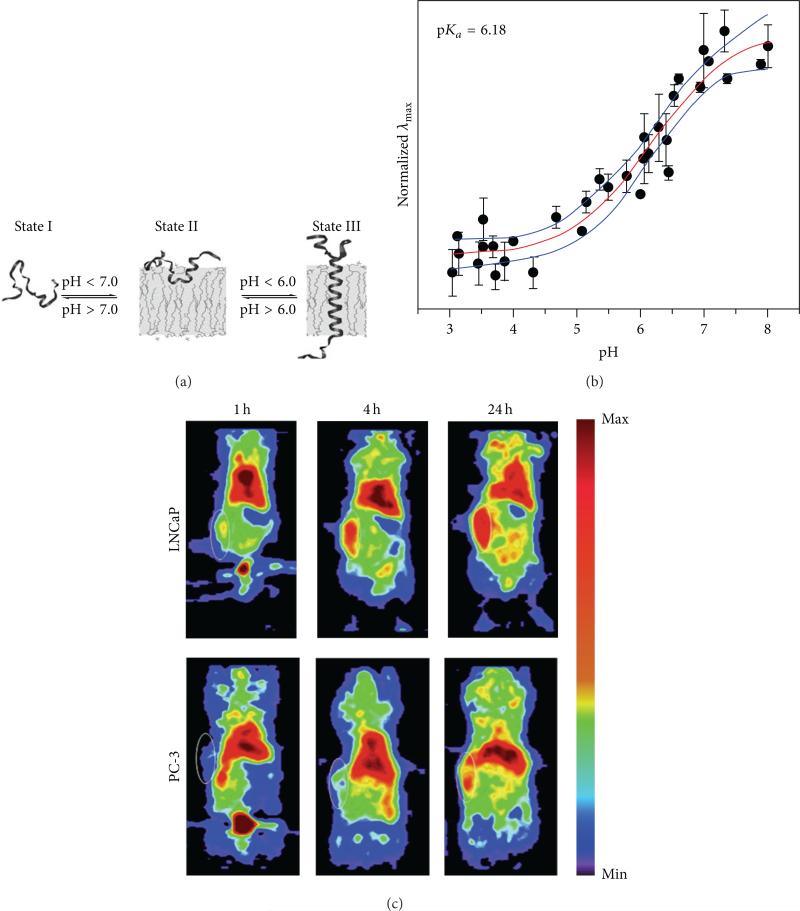
Positron emission tomography (PET) is a widely used molecular imaging modality in both clinical and research settings. Whole-body PET imaging of mice can be performed in less than 10 minutes. To image tumor pHe with PET, a 64Cu radioactive nuclide has been conjugated to the pH low insertion peptide (pHLIP), which folds to form an α-helix and inserts itself into cell membranes when the tumor pHe is acidic (Figure 6) [22–24, 31]. This method has high sensitivity and therefore can produce images with an administration of agent as low as ~0.01 ng/kg of mouse weight. Higher retention of the agent within the tumor has been shown to correlate with lower acidity [22]. However, this method depends on an equilibrium between the peptide conformations that can and cannot insert into a cell membrane, and therefore the fraction of membrane-inserted peptide has a sigmoidal relationship with pH. This causes the pH measurement to be semiqualitative instead of quantitative. Furthermore, PET has spatial resolution of ~2 mm [32] and may not be as applicable to measure pH in small tumors such as tumors in lymph nodes and may not be able to adequately assess tumor heterogeneity.
Figure 6.
PET imaging of tumor pHe. (a) A pHLIP peptide inserts into cell membranes in low pHe conditions. (b) PET imaging of 64Cu-DOTA-pHLIP showed higher uptake and retention in a subcutaneous mouse model of LNCaP relative to PC-3, indicating that the LNCaP tumor model had lower pHe. MR spectroscopy confirmed that the average pHe values of the LNCap and PC-3 tumor models were 6.78 ± 0.29 and 7.23 ± 0.10, respectively. White circles show the locations of the subcutaneous tumors. (c) A membrane-insertion of a variation of pHLIP shows a sigmoidal dependence on pH. Reproduced with permission from [22–24].
3.4. Electron Paramagnetic Resonance
Electron paramagnetic resonance (EPR) spectroscopy is a technique for studying material with unpaired electrons. Because most stable molecules have all of their electrons paired, only a few molecules are sensitive to EPR. This limitation also means that EPR offers great specificity and there is no competing background signal [35]. The use of pH-sensitive nitroxides offers a unique opportunity for noninvasive assessment of pH values from 0 to 14 in living animals with sensitivity in the μM regime [36]. The pH can be determined by measuring the frequency separation of the spectral peaks or by quenching the EPR signal within a pH-dependent polymer (Figure 7) [33]. Unfortunately, tissues must be irradiated with high power to perform EPR studies, which limits this technique to the study of small animal models and peripheral human tissues.
Figure 7.
EPR imaging of pH. The nitroxide radical TEMPO shows strong EPR signals in solution, which are quenched when TEMPO is encapsulated in a nanoparticle. (a) Degradation of the nanoparticle at low pH dequenches the EPR signals from TEMPO. (b) No change in the nanoparticle at neutral pH retains the EPR-quenched state. (c) Phantom images demonstrate that the difference in pH can be spatially localized. Reproduced with permission from [33].
4. Magnetic Resonance Based Methods other than CEST MRI
Magnetic resonance imaging (MRI) and MR spectroscopy (MRS) are excellent whole-body imaging tools that provide excellent soft tissue contrast with little radiation exposure. Beyond anatomical information, recent MRI and MRS developments have focused on providing environmental biomarker evaluations (pH, temperature, and oxygen) and molecular information (proteins, enzyme activity, gene expression, metabolites, and metal ions) [37]. In recent years, innovations in MR instrumentation have drastically improved spatial and temporal resolution, and it is now possible to image in vivo tissues with ~0.1 mm spatial resolution.
4.1. Magnetic Resonance Spectroscopy
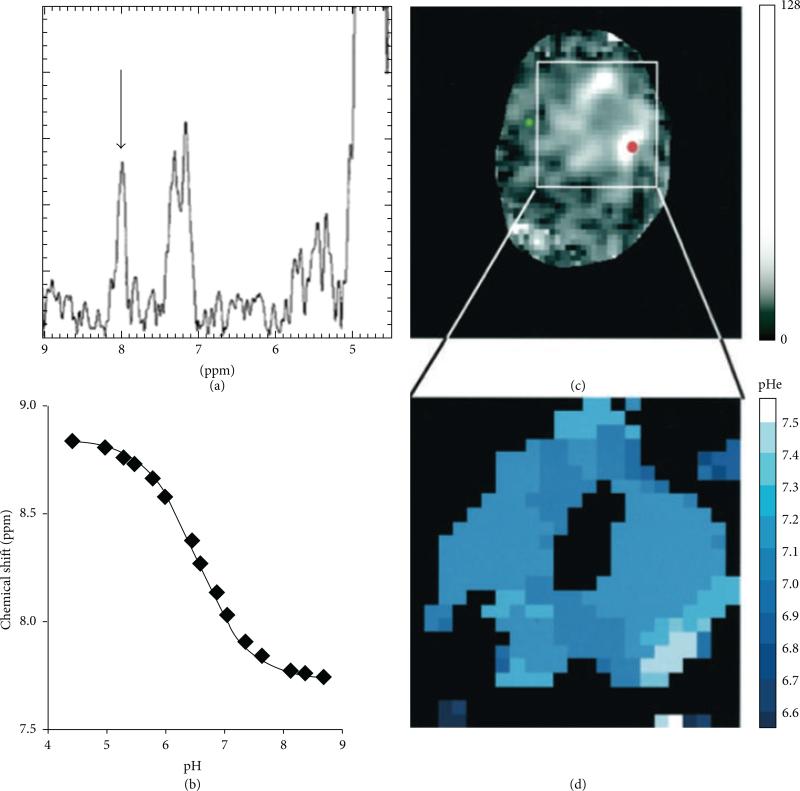
Magnetic resonance spectroscopy (MRS) has been used for more than three decades to examine metabolite distributions among living cells and tissues. The most common applications of in vivo MRS are used to detect endogenous signals from 1H, 31P, or 23Na [38]. 1H MRS is the most favorable spectroscopic method because 1H has the highest inherent sensitivity with 99.98% natural abundance and the highest gyromagnetic ratio of stable isotopes [39], and most clinical MR instruments have the capability to detect 1H MR signals. Furthermore, the most atoms in the human body are hydrogen atoms, 67% by atomic percent. Tumor pHe can be measured by detecting endogenous metabolites that have chemical shifts that are sensitive to pH. For example, pH is correlated with the chemical shift difference between the two protons on histidine, both of which are pH-sensitive. Such analyses do not require known concentrations of histidine [40]. Another example is (±)2-imidazole-1-yl-3-ethoxycarbonylpropionic acid (IEPA), which can measure pH by comparing the pH-dependent chemical shift of one proton with the pH-independent chemical shift of a second proton in the same molecule (Figure 8) [34]. Thus a ratio of the two chemical shifts correlates with pH in a concentration independent manner. However, the use of IEPA to measure pHe is questionable, because IEPA is a pH buffer and can alter the pHe by interfering with the clearance of extracellular proton to the blood stream.
Figure 8.
1H MR spectroscopic imaging of tumor pHe. (a) The 1H spectrum from within a glioma showed the chemical shift of the IEPA H2 resonance (arrow), (b) which is correlated with pH as shown by an in vitro titration. (c) A parametric map of IEPA signal amplitudes showed accumulation of the agent in the glioma. (d) A parametric map of pHe was determined from the chemical shift of the IEPA H2 resonance and the correlation shown in (b). Reproduced with permission from [34].
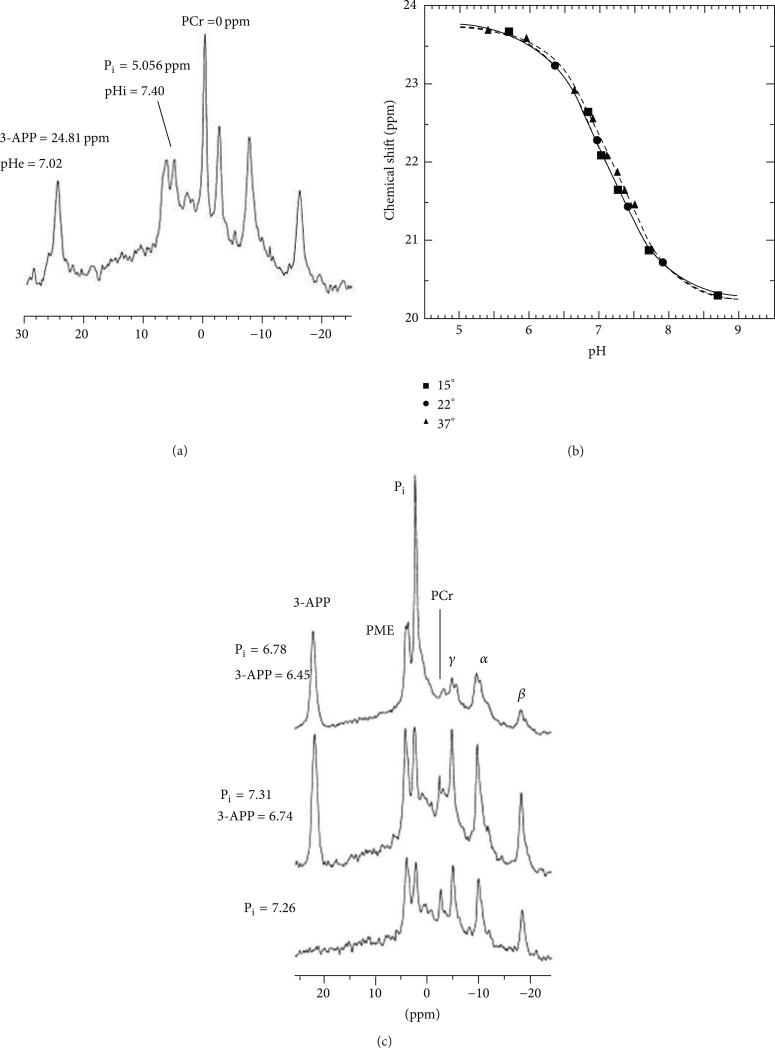
31P MRS has been used to measure the chemical shift of endogenous inorganic phosphate (Pi). However, this chemical shift is weighted to reporting the pHi rather than the pHe, because ~2-3 mM of Pi is in the intracellular compartment and only ~1 mM is in the extracellular compartment [39]. The exogenous contrast agent 3-aminopropylphosphonate (3-APP) can be used to measure pHe via 31P MRS (Figure 9) [41]. The chemical shift of 3-APP is referenced to the chemical shift of the alpha peak of APT or GPC and therefore information about the concentration of 3-APP is not required. Furthermore, 3-APP has low toxicity and can measure pHe within a physiological range of pH 6 to 8. This method of analysis allows simultaneous pHe and pHi measurements with 3-APP and Pi [43, 44] and has been used to study alkalosis and acidification of tumor models [45, 46]. This method has been a popular choice as a cross-reference when developing new methods to measure pHe [22, 47, 48].
Figure 9.
31P MR spectroscopy of tumor pHe. (a) The 31P spectrum from mouse leg muscle injected with 3-APP can measure extracellular pH (pHe) from the 3-APP chemical shift and can measure intracellular pH (pHi) from the chemical shift of inorganic phosphate (Pi). (b) The 31P chemical shift of 3-APP is correlated with pH as shown by an in vitro titration. (c) The pHe and pHi measured with 3-APP and Pi in a tumor before (bottom) and after (middle) injection of 3-APP, and after euthanasia (top). Reproduced with permission from [41].
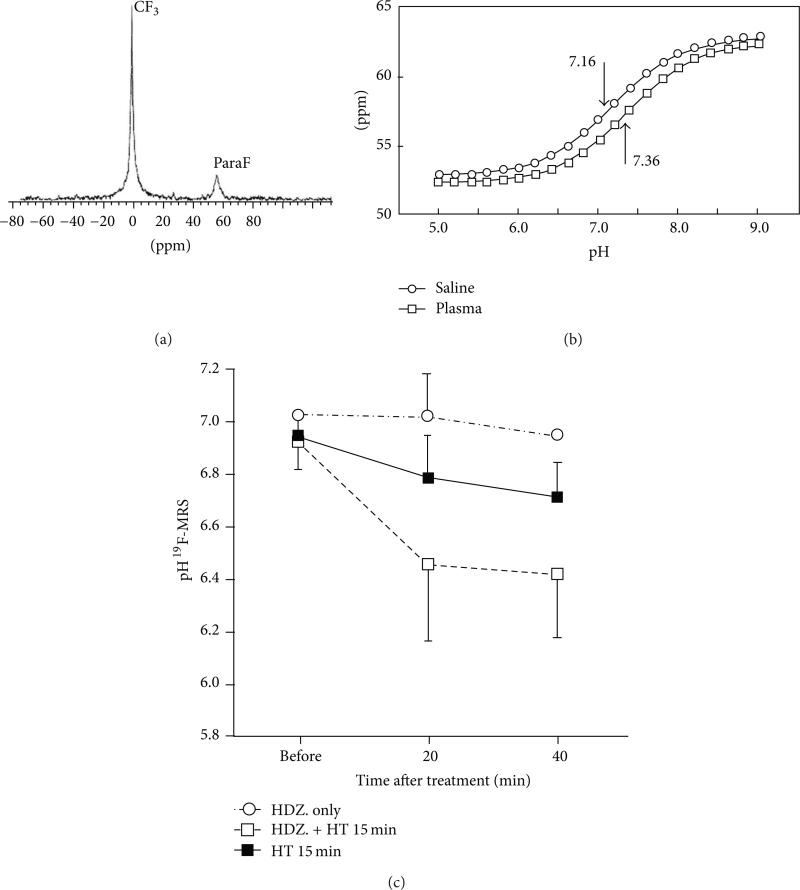
Even though 31P MRI has 100% natural abundance, its signal sensitivity relative to 1H MRI signals is only 6.6%. For comparison, 19F is 100% naturally abundant and has a MR sensitivity of 83% relative to 1H [39]. Furthermore 19F MRS has a relatively large chemical shift difference and an almost lack of endogenous MR signal in normal tissues. The fluorinated compound ZK-150471 emits two 19F MR signals that have a frequency difference which is dependent on pH (Figure 10) [42]. This 19F agent has been used to detect changes in tumor pHe in response to treatment with hydralazine and/or heating. In a study that compared 19F and 31P MRS at a 1 cm3 spatial resolution, 31P MRS required ~40 min of acquisition time, while its counterpart 19F MRS only required ~5 min [47]. However, pH-sensitive 19F contrast agents have practical problems that limit in vivo use, such as the instability of some fluorinated compounds and nonspecific accumulation in normal tissues, which can result in low sensitivity in the tumor tissue. To improve stability and specificity, 19F contrast agents can be encapsulated into nanogels that specifically target a tumor. The diameter of the nanogel is pH-sensitive, and indirectly measuring a change in diameter via 19F MRS provides a pH measurement [49]. In addition, the accuracy of pHe measurements with 19F agents may be questionable, partly due to many potential biomolecular interactions with the agent that can change the chemical shift of the 19F nucleus.
Figure 10.
19F MR spectroscopy of tumor pHe. (a) The 19F MR spectrum of ZK-150471 shows two peaks. (b) The chemical shift difference of these two peaks is correlated with pH. (c) The average pHe measured with 19F MRS showed a decrease after heating with and without 5 mg/kg hydralazine. Reproduced with permission from [42].
Despite the promise of 31P and 19F MRS for measuring tumor pHe, these MRS methods have many detriments for clinical use. Most clinical MRI instruments do not have the capability to measure isotopes other than 1H. A typical 1H MRS result requires a long acquisition time greater than 30 min and provides only coarse resolution of approximately 1 cm3. Due to the low signal to noise ratio (SNR), MRS requires a high degree of magnetic field homogeneity and minimal movement [39]. Over the years, strategies have been developed to reduce acquisition time and/or to increase spatial resolution. For example, point resolved spectroscopy (PRESS) [69] and stimulated echo acquisition mode (STEAM) [70] have been developed to enable simultaneous acquisition of spectra from multiple volumes at 1 mm3 spatial resolution. However, the relationship between SNR, spatial resolution, and acquisition time are dictated by the physics of the nuclear spins and electronics. Hence, improved resolution or reduced acquisition time is always associated with reductions in SNR. For example, a 40 mL voxel interrogated with a clinical 1.5 T MRI instrument requires 30 min acquisition time, while a 105 mL voxel requires only 6 min of acquisition time with a 1.5 T MRI instrument [40].
4.2. Hyperpolarized 13C Spectroscopy
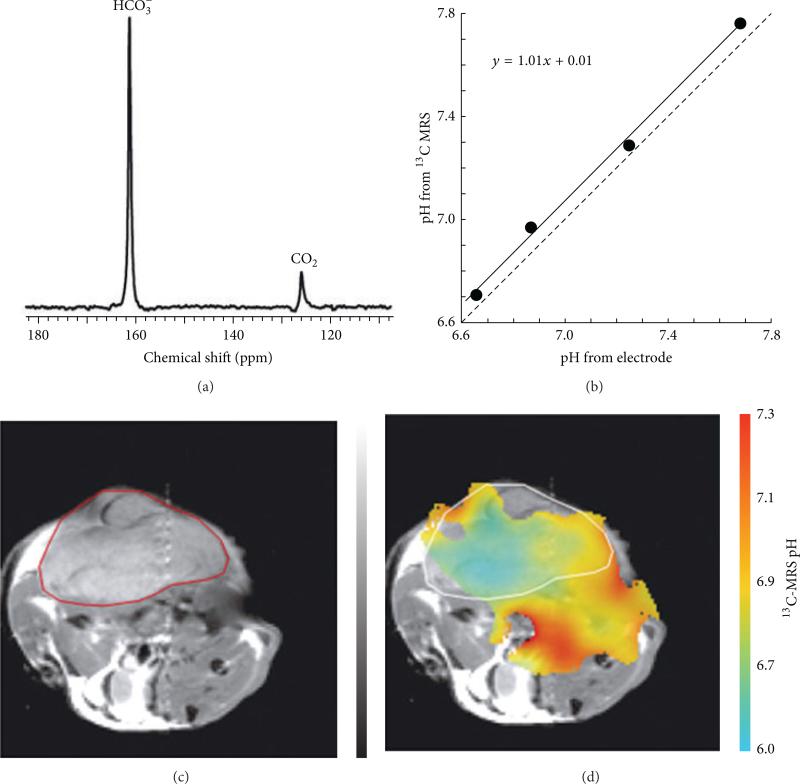
The 13C isotope has 1.1% natural abundance and a MRS sensitivity of 0.016% relative to 1H MRS at 37°C. Dynamic nuclear polarization (DNP) can be used to increase the sensitivity of 13C MRS [71]. This technique involves cooling a 13C labeled molecule to ~1 K and then transferring polarization from electron spins to 13C nuclei with microwave irradiation. The sample is then warmed rapidly to body temperature while retaining a high level of nuclear spin polarization. A ratio of H13CO3 − and 13CO2 from injected 13C labeled bicarbonate is correlated with pH (Figure 11) [48]. Each acquisition is ~5 sec and yields a resolution of 0.375 mm3 per voxel. Despite the ultrafast acquisition, hyperpolarized 13C has a rapid decay of ~20 sec and requires a special transceiver coil and hyperpolarizer. Furthermore, 13C labeled bicarbonate can only measure a weighted average of pHi and pHe.
Figure 11.
Hyperpolarized 13C MR spectroscopic imaging of tumor pHe. (a) 13C MR spectroscopy was used to measure the ratio of [H13CO3]/[13CO2], which was used to calculate pH based on the Henderson-Hasselbalch equation, pH = pKa + log10([H13CO3]/[13CO2]). (b) A solid line shows the correlation of the pH values determined from 13C MRS and an electrode. The dashed line representing equal measurements is provided as a visual reference. (c) A subcutaneously implanted EL4 tumor in a mouse is outlined in red in an axial MR image. (d) The pH map of the same mouse calculated from 13C MR spectroscopic imaging. The tumor margin is outlined in white. Reproduced with permission from [48].
4.3 T1 Relaxivity MRI
The use of a paramagnetic metal complex as a MRI contrast agent is now widely accepted in diagnostic radiology. Agents currently approved for clinical use are based on low-molecular weight chelates of gadolinium that partition throughout all extracellular space and enhance the T1 MR relaxation of nearby water protons. The T1 relaxivities of some MRI contrast agents are pH-dependent, such as Gd(III) chelates that have a pH-sensitive ligand, which can block water from accessing the Gd(III) ion only under certain pH conditions [37, 72–80]. Other agents currently approved for clinical use are based on superparamagnetic iron oxide nanoparticles that enhance the T2 MR relaxation of nearby water protons. For example, iron oxide nanoparticles encapsulated within pH-responsive nanocapsules [81] and pH-sensitive hydrogels [82] exhibit different T2 relaxation properties under different pH conditions.
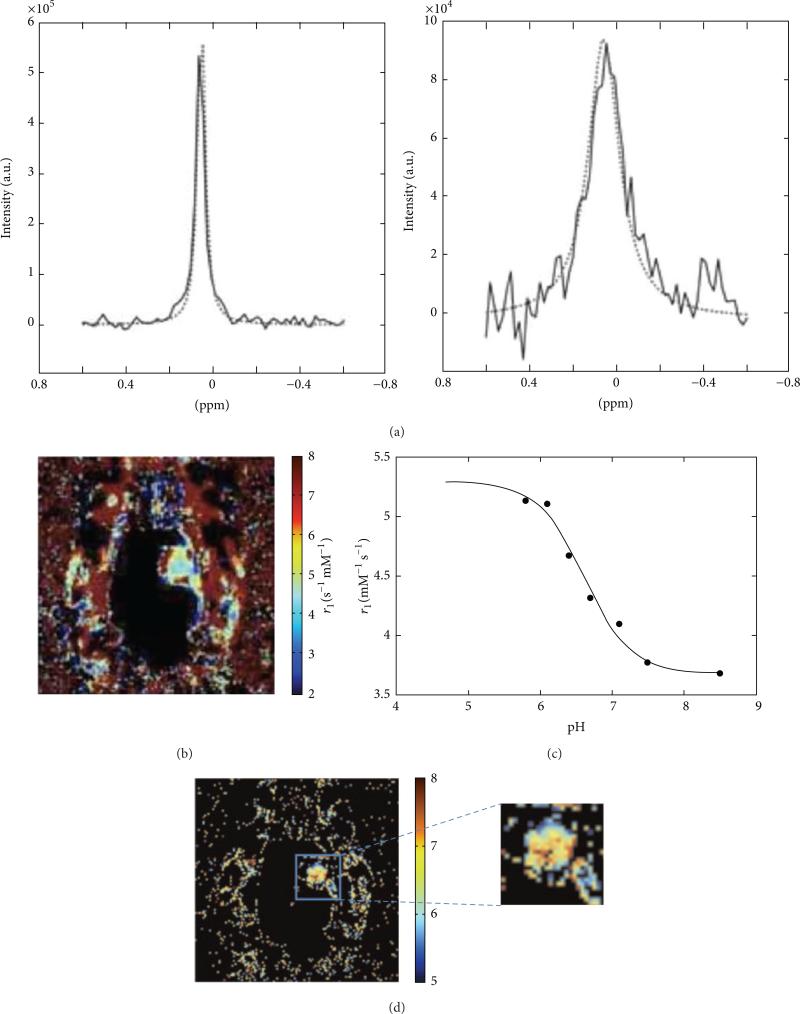
Among these relaxation-based MRI contrast agents, Gd-DOTA-4Amp has been applied to measure in vivo pHe with the greatest success [85]. Knowledge on the concentration of Gd-DOTA-4Amp is required to convert the T1-weighted MRI signal to a pHe measurement, because the MRI signal is dependent on both concentration and the T1 relaxation effect of the agent. A pH-unresponsive contrast agent with an analogous chemical structure can be used to account for the concentration of pH-responsive agent [37]. For example, two serial boluses of Gd-DOTA-4AmP and Gd-DOTP have been used to measure tumor pHe in C6 glioma and renal carcinoma [50–52]. The T1-weighted MRI signal from Gd-DOTP was used to determine the temporally dynamic concentration of this agent in the tumor, which was assumed to be identical to the temporally dynamic concentration of Gd-DOTA-4AmP. Based on this concentration, the T1-weighted MRI signal of Gd-DOTA-4AmP was used to determine the pHe. However, this method with serial injections makes the risky assumption that the biodistributions are identical for two MRI contrast agents that are administered at different times. To avoid this assumption, a single cocktail of Gd-DOTA-4AmP and Dy-DOTP has been administered to a mouse model of C6 glioma (Figure 12) [53]. The Gd-DOTA-4Amp dominated the T1 relaxation process generated by the agents, whereas Dy-DOTP dominated the T2* relaxation process of the agents. The T2* relaxation effect was then used to determine the pixelwise concentration of Dy(III), which was assumed to be identical to Gd(III). This value was used to convert the pixelwise T1-weighted MRI signals into pHe maps. In a similar in vitro study, the ratio of T1 and T2 relaxation processes of a single agent [(GdDOTAam)33 – Orn205] was shown to be correlated with pH [86]. However, this large-molecule contrast agent has not been demonstrated with in vivo studies and may not be clinically translatable because large-molecule Gd(III) chelates are potentially toxic.
Figure 12.
Relaxation-based MRI of Gd-DOTA-4Amp and DyDOTP can measure tumor pHe. (a) The change in water linewidth before injection (left) and after injection (right) is used to estimate the concentration of the agent. (b) A parametric map of the r1 relaxivity of the agent in a glioma model is obtained from a T1-weighted MR images and the concentration of the agent. (c) The r1 relaxivity of the agent is pH-dependent, (d) which can be used to convert the r1 relaxivity map to a pH map (color scale bar shows pH units). Reproduced from [53] with permission.
5. Chemical Exchange Saturation Transfer MRI
A chemical exchange saturation transfer (CEST) MRI experiment can selectively detect multiple proton exchanging sites within the same contrast agent. This provides a great advantage relative to relaxivity-based MRI methods, because a ratio of CEST effects from the same CEST agent is independent of concentration. If one or both of the CEST effects are dependent on pH, then this ratio can be used to accurately measure pH. CEST MRI has advantages relative to other imaging methods that measure pH. CEST MRI does not require special instrumentation such as hyperpolarizer for 13C MRS or a detector coil for 19F, 31P, or 13C MRS. CEST MRI allows full body imaging and it is not limited by depth of view as with fluorescence imaging. CEST MRI uses relatively low energy radio frequency and does not raise safety concerns like EPR or PET imaging. Most importantly, CEST MRI is noninvasive, which is a great improvement relative to invasive electrodes and microsensors.
5.1. The CEST Mechanism
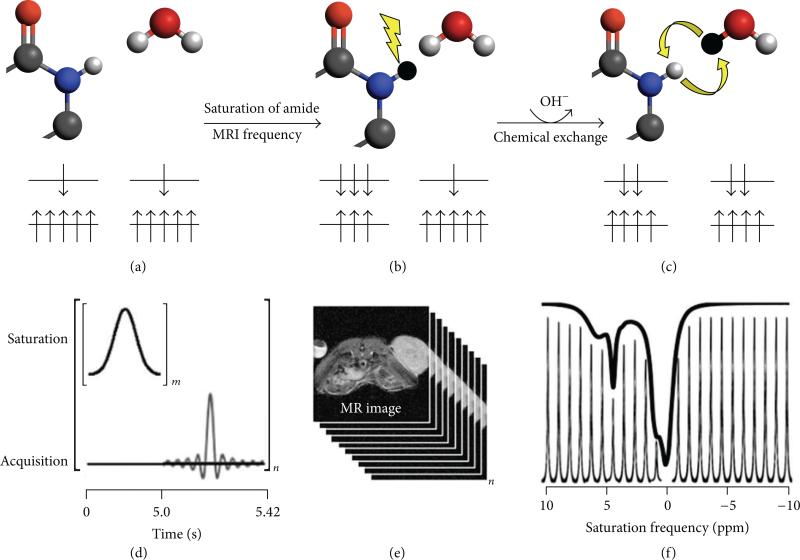
CEST MRI employs an endogenous or exogenous chemical agent that has a proton which can exchange with water at a slow-to-moderate rate of 100–5000 Hz (Figure 13(a)). The protocol for CEST MRI starts with saturating a specific resonance frequency of an exchangeable proton on the CEST agent (Figure 13(b)). Saturation is a condition wherein the number of nuclear spin magnetic moments (“spins”) aligned against the field is increased at the expense of spins aligned with an external magnetic field. This soft irradiation pulse temporary disrupts the Boltzmann distribution of spins and leads to a decrease in MRI signal amplitude of the exchangeable proton in NMR spectra, which depends on the net difference of spins aligned with and against the magnetic field [87]. Due to the natural process of chemical exchange of labile protons between molecules, this proton on the CEST agent is transferred to a nearby water molecule (Figure 13(c)). The spin aligned against the field from the exchangeable proton is transferred to the population of spins for water, in exchange for a spin aligned with the field that is transferred to the population of spins for the agent. This transfer of saturation from the exchangeable proton to the water proton reduces the MRI signal amplitude of water. In practice, the CEST MRI protocol starts with a series of selective saturation RF pulses (Figure 13(d)), followed by a standard MRI acquisition sequence that can measure the amplitude of water signal throughout the image (Figures 13(d) and 13(e)). A CEST spectrum is obtained by iterating a series of saturation frequencies and recoding the normalized water signal amplitudes (Figures 13(e) and 13(f)).
Figure 13.
Chemical exchange saturation transfer. (a) The number of magnetic moments aligned with the B0 static magnetic field is greater than the number aligned against the B0 field for an amide proton and a water proton. (b) Selective saturation of the MR frequency of the amide proton causes the magnetic moments to equilibrate between states. (c) Subsequent chemical exchange of the amide proton and water proton transfers some of the saturation to the water protons, causing a partial equilibration of the states for the water protons. (d) The CEST-FISP MRI protocol consists of a series of Gaussian-shaped saturation pulses repeated “m” times, followed by a FISP MRI acquisition sequence. The entire process is repeated for a series of “n” saturation frequencies. (e) Fourier transformation of the frequency-domain signals creates a series of “n” MR images at each saturation frequency. (f) The integral of the MR signal of the tumor is plotted as a function of saturation frequency for the “n” images, creating a CEST spectrum. A sum of four Lorentzian line shapes was fit to the experimental CEST spectrum to quantify the CEST effects at 5.6, 4.2, and 0.8 ppm of the CEST agent used in this example (iopromide; Ultravist, Bayer Healthcare Inc.) and also account for the direct saturation of water at 0 ppm (black line, raised 10% above the CEST spectral peaks to improve the view).
The CEST agent typically has a low concentration in the 1 to 10 mM range. The MR spectroscopic resonances of the agent are not directly observable during a standard MRS acquisition due to the low concentration of agent relative to the concentration of water. However, with continuous RF irradiation (Figure 13(d)), the saturation from the agent is continuously transferred to the bulk water (Figure 13(c)), resulting in a reduction of water intensity that is observable by MRI (Figures 13(e) and 13(f)). Hence, this continuous transfer of saturation serves as amplification for the agent and allows for indirect observation of the CEST agent at low mM concentrations [88].
5.2. Endogenous CEST MRI
An ingenious application of CEST is to detect exchanging groups that are already present in the tissue, such as hydroxyl, amide and amine groups in proteins and peptides. Endogenous CEST avoids the need of an exogenous contrast agent, resulting in high impact in both in vivo applications and clinical translatability. For example, glycoCEST detects hydroxyls (0.5–1.5 ppm) from glycogen in liver and muscle [89], gagCEST detects hydroxyls (0.9– 1.5 ppm) from glycosaminoglycan in cartilage [90], gluCEST detects amines (3.0 ppm) from glutamate in brain [91], and amide proton transfer (APT) detects amides (3.5 ppm) from proteins and peptides in brain [59].
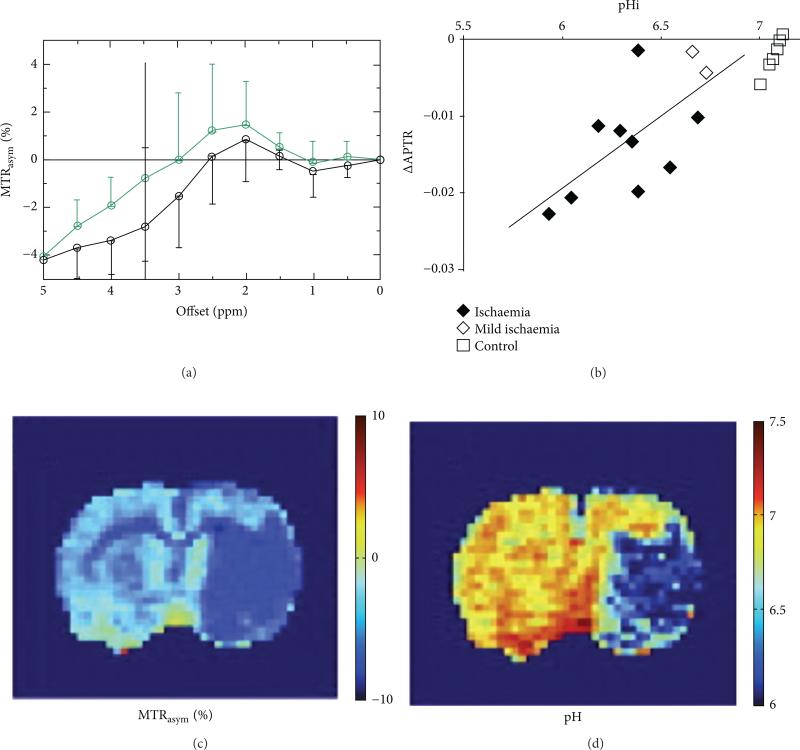
Among the established endogenous CEST methods studied, only APT can measure differences in pH. The chemical exchange between the amide protons and the bulk water is base-catalyzed, so that the exchange rate decreases with decreasing pH. The pH-weighted APT imaging method has been widely used to study acute ischemic stroke in an animal model (Figure 14) [64, 83, 84, 92–94].
Figure 14.
Endogenous CEST MRI of tumor pHi. (a) The asymmetry of the magnetization transfer ratio (MTRasym), a measure of CEST, decreases after ischemia is induced in a rat model (black: ischemic region; green: nonischemic contralateral region; data represents the average and standard deviation of results with 7 rats). (b) This decrease in CEST, also represented as a change in the amide proton transfer ration (ΔAPTR), has been correlated with intracellular pH (pHi) as measured with 31P MR spectroscopy. (c) The MTRasym can be mapped in a rat model of ischemia, (d) which can be converted into a pH map. Reproduced with permission from [59, 83, 84].
When using APT to evaluate pH, the generated contrast depends on many parameters which compromises the measurement of pH. These other parameters include water proton concentration, amide proton concentration, spin-lattice relaxation rate, and saturation time when measuring CEST via MTRasym at 3.5 ppm (Equation (1)) [59]. For this reason, the pH-weighted APT image can measure relative changes in pH, but no absolute pH value can be calculated. In the past, pH-weighted APT images have been correlated with apparent diffusion coefficient (ADC) images [64, 84, 94], isotropic diffusion-weighted images [59, 95], and lactic acid content using nonimaging methods [83, 94]. Alternative quantification methods have been applied, such as calibrating with various pH solutions of creatine [60], cross-reference with 31P MRS [59], and employing QUEST/QUESP to establish a relationship between the amide proton transfer ratio (APTR) and pH [96]. Consider
| (1) |
Due to the high concentration of mobile proteins and peptides in the cytoplasm, APT mainly measures intracellular pH [59]. Furthermore, as shown in (1), an increase in APTR can potentially be caused by an increase in cytosolic protein and peptide content rather than intracellular pH. In fact, the increased protein and peptide content in the tumor is the most likely explanation for changes in APT contrast in tumors, because the intracellular pH is highly regulated by active proton exporting systems [5] and there is usually only a small difference (<0.1 pH unit) between a malignant tumor and normal tissue. Thus, APT imaging would be a more appropriate tool to provide visual information about the presence and grade of tumor based on increased content of mobile proteins and peptides, as shown in past clinical studies [60, 97].
5.3. Exogenous PARACEST Agents
Paramagnetic Gd(III) is the most commonly used contrast agent for MRI because it is the most efficient at relaxing bulk water protons, providing excellent contrast in a T1 weighted image. However, having such a rapid water relaxation does not allow for sufficient time to generate CEST between an agent and water, which makes it unsuitable for CEST detection. On the contrary, other lanthanide ions have slower exchange rates and are more suitable as PARACEST agents [99].
PARACEST agents contain a lanthanide ion that greatly shifts the MR resonance frequency of the exchangeable amide protons from the MR frequency of water, which expands the range of MR frequencies that can generate a CEST effect, away from the direct saturation of water experienced in the APT experiment. This expanded frequency range facilitates the development of an agent with two CEST effects that have different MR frequencies. Due to the variety of the chelation chemistry, PARACEST agents can be designed to possess both pH-responsive and pH-unresponsive CEST effects within a single agent. A ratio of the two CEST effects can then be used to measure pHe without complications of the concentration term (Equation (2)) [100], unlike approaches with Gd(III) pH-responsive relaxivity agent or APT. Consider
| (2) |
Aime and colleagues were the first to design a series of pH-responsive ratiometric PARACEST agents (Ln-DOTAMGly, Ln = Pr, Nd, Eu) [54–56]. The CEST effect from an amide is pH-responsive while CEST from the metal-bound water is pH-unresponsive. The ratio of CEST effects from Pr-DOTAM-Gly gave the most sensitive pH response over a range of pH 5.5–7.5. Unfortunately, owing to fast exchange rate of metal-bound water at physiologic temperature, high saturation of 87.6 μT power was required [56]. Such high saturation power exceeds the specific absorption rate (SAR) and limits the agent's applicability for in vivo tumor pHe measurements.
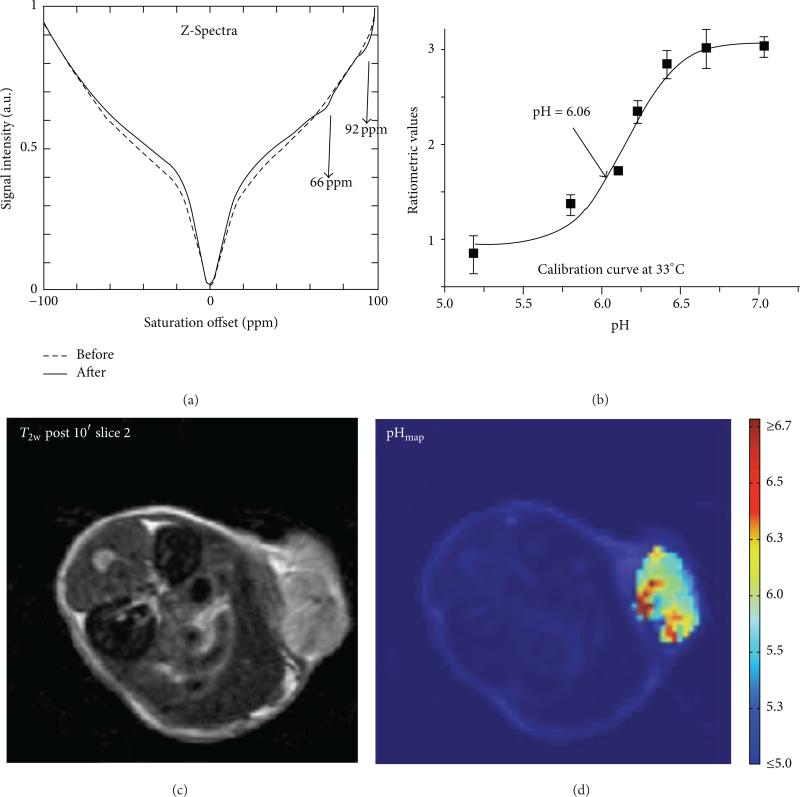
To avoid detecting the CEST effect from a metal-bound water, the same group measured the CEST effects of hydroxyl groups in Yb-HPDO3A, an analogue to FDA approved ProHance (Gd-HPDO3A) (Figure 15) [61, 101]. The ratio of hydroxyl CEST effects arises from the two isomeric forms and was linearly correlated within the pH range of 5.2–6.7. Using this agent, the pHe of early and late stage murine melanoma flank tumors were measured to be pH 6.1 and 5.8, respectively. Although this approach is promising, these pHe values are far below the typical range of acidic tumors, which ranges from pH 6.4 to 7.2. Therefore, this result may have a systematic error that produces pH measurements that are too low. Another limitation is that Yb-HPDO3A can only measure pHe below pH 6.7, which is less than the physiologic pH range for tumors and normal tissues. An interesting variation of pH measurements with Yb-HPDO3A used a PAMAM dendrimer to carry multiple Yb-HPDO3A monomers [57].
Figure 15.
CEST MRI of tumor pHe with Yb-HPDO3A. (a) An in vivo CEST spectrum of the tumor mass before and after i.v. injection of the agent into a mouse model of B16-F10 melanoma. (b) A ratio of the two CEST effects is calibrated with pH at 33°C. Although the calibration is dependent on temperature, the temperature can be determined from the chemical shifts of the CEST effects. (c) An anatomical image shows the location of the subcutaneous tumor. (d) The pixelwise pHe map of the tumor shows a heterogenous distribution of pHe values with an average pHe of 5.8. Reproduced with permission from [61].
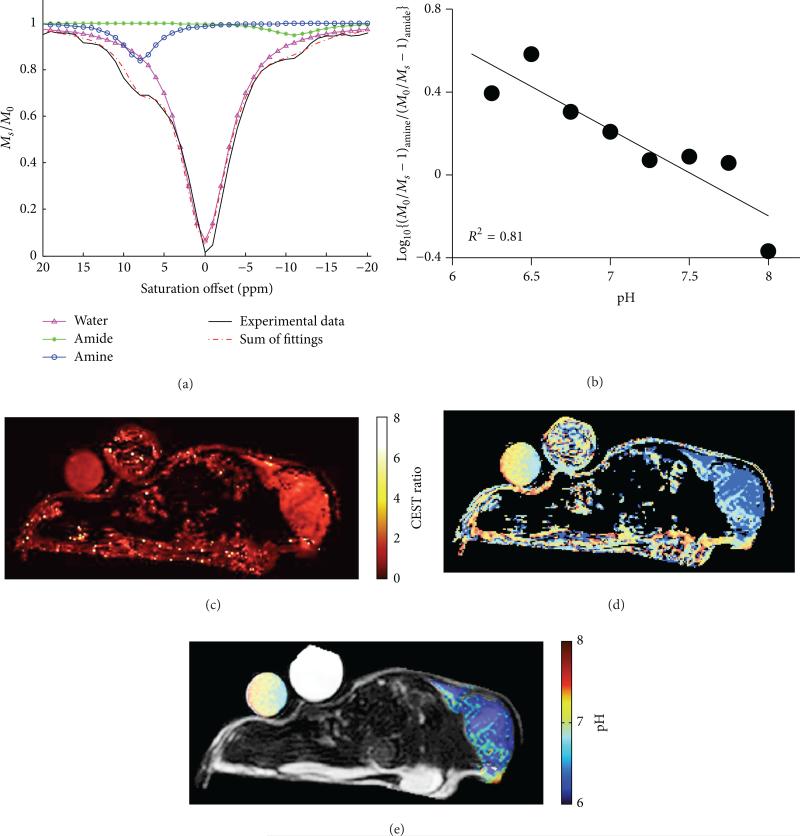
Our research group has previously developed Yb-DO3A-oAA that has an aryl amine and amide (Figure 16) [65, 100]. The chemical exchange rate of an aryl amine is sufficiently slower due to the hydrogen bonding to proximal carboxylates. This allows the use of lower saturation powers (20 μT [102]) that are safer for in vivo preclinical measurements of tumor pHe. In addition, the base-catalyzed chemical exchange rates of an amide and aryl amine are different, and a ratio of these CEST effects is linearly correlated with pH within the range of 6.35–7.57. Using this agent, the pHe measured in a mammary carcinoma flank tumor was pH 6.8 ± 0.21, which is well within the physiologic pH range [65]. Nonetheless, the use of the lanthanide ion and 20 μT saturation power is not considered safe for clinical translatability.
Figure 16.
CEST MRI of tumor pHe with Yb-DO3A-oAA. (a) The CEST spectrum of Yb-DO3A-oAA was fitted with Lorentzian line shapes to measure two CEST effects. (b) A ratio of the CEST effects was linearly correlated with pH. (c) The same CEST ratio was measured in a MCF-7 mammary carcinoma model after direct injection of the agent into the tumor tissue. (d) A map of extracellular pH (pHe) was determined from the map of the CEST ratio. (e) The pHe map was filtered to only retain results from pixels that had two statistically significant CEST amplitudes, resulting in a pHe map of the tumor and tube containing the agent (the other tube contained only water). Reproduced with permission from [57].
An alternative to measuring the magnitude of two CEST peaks is measuring a ratio of CEST at two frequencies. Wu and colleagues took a ratio of CEST signals at 55 and 49 ppm of Eu-DO3A-tris(amide), which only has one CEST effect that varies with pH between these ppm values [103]. A ratio of CEST at 55 and 49 ppm is linearly correlated with pH within the range of 6.0 and 7.6 and is independent of agent concentration.
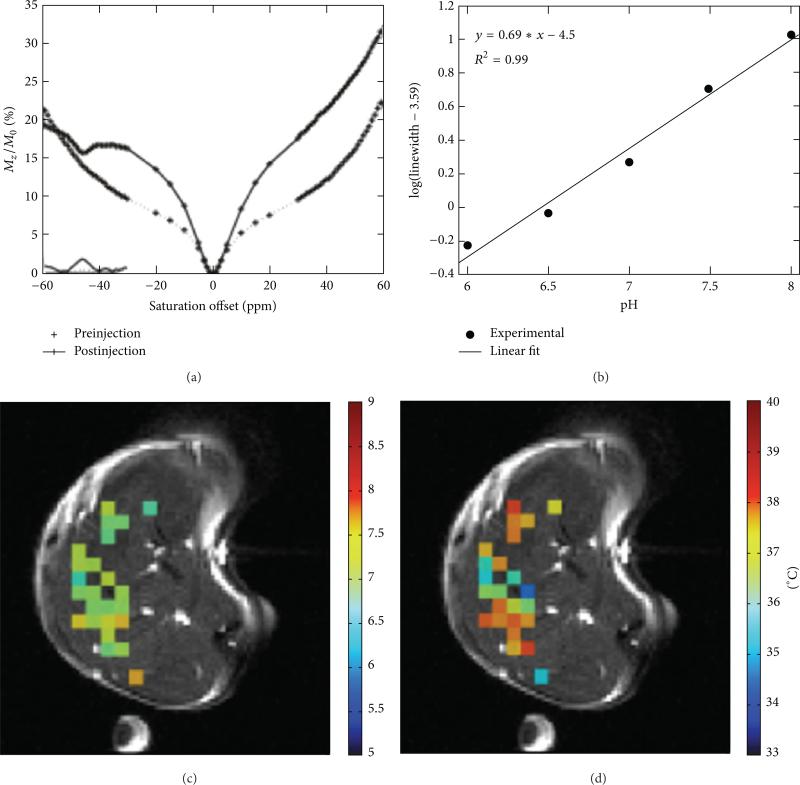
An alternative to ratiometric PARACEST is the use of linewidth analysis of a single CEST peak (Figure 17) [62, 63]. The linewidth of the CEST effect of Tm-DOTAM-Gly-Lys is independent of agent concentration for given saturation pulse conditions. Within the physiological range of pH 6.0–7.5, linewidth analysis is less sensitive to temperature. The agent was directly injected into mouse's leg muscle and a pH value of 7.2 ± 0.2 was measured. This example also provides the possibility of conjugating DOTAM with peptides to improve pharmacokinetic properties such as high cellular uptake and longer intracellular retention [62, 63, 104]. However, this method of analysis is not suitable for overlapping CEST effects.
Figure 17.
CEST MRI of leg pHe with Tm-DOTAM-Gly-Lys. (a) An in vivo CEST spectrum of the tumor mass before and after direct injection of the agent into the left mouse leg. (b) The linewidth of the CEST effect is calibrated with pH. (c) The in vivo pHe map and (d) the in vivo temperature map are superimposed onto a preinjection anatomical image. The temperature is determined from the chemical shift of the CEST effect. Reproduced with permission from [62, 63].
5.4. Exogenous DIACEST Agents
The first documented CEST MRI contrast agent was urea, which decreased the water proton signal in ex vivo kidney tissue [105]. As the chemical exchange of an amide proton with water is base-catalyzed, the CEST effect of urea was shown to be dependent on pH [106]. This CEST effect is characterized as diamagnetic CEST (DIACEST) as opposed to PARACEST agent with metal ions.
DIACEST agents typically have exchangeable protons with a chemical shift that is less than 10 ppm from the water resonance. For example, a hydroxyl proton has a chemical shift of ~1 ppm, an amine proton resonates at ~2-3 ppm, and an amide proton typically has a MR frequency greater than 2.5 ppm, with the basic and aromatic proton shifted more down field [107]. The first reported DIACEST agent, 5,6-dihydrouracil, has a ratio of CEST effects from the two amides that follows a sigmoidal relationship with pH [105].
Many pH dependent DIACEST agents have been investigated, including poly-l-lysine (single amide, 3.75 ppm) and polyamidoamine dendrimer (three amides, 3.4–3.6 ppm) [96], poly-l-arginine (guanidyl amide and amide, 1.8 and 3.6 ppm resp.), and poly-l-threonine (hydroxyl and amide, 0.6 and 3.5 ppm, resp.) [58]. The DIACEST agents glycogen, l-arginine, and poly-l-lysine have also been encapsulated in liposomes for lymph node mapping in vivo. No pH dependence on the CEST effect was reported for these liposome-encapsulated agents, but these pioneering studies offer new approaches for studying the spatial and temporal dynamics of complex biological systems. As another intriguing approach, the hydroxyl peak of poly-l-threonine has been shown to drop as a function of pH, because the exchange rate becomes too fast compared to the chemical shift difference between water and the hydroxyl group at high pH [58].
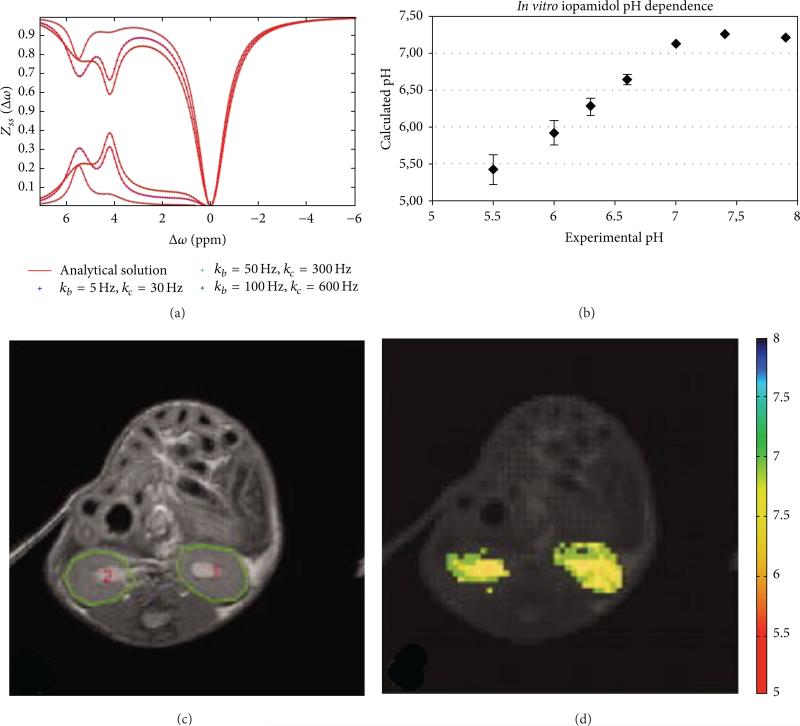
Iopamidol (Isovue, Bracco Imaging S.p.A.) is a FDA approved contrast agent for CT/X-ray imaging that has been shown to be a DIACEST agent (Figure 18) [98, 108]. This agent has five hydroxyl protons, two amide protons that share the same MR frequency, and an additional amide proton with a different MR frequency. Due to the iodinated aryl ring, the amide protons have MR frequencies that are significantly shifted from the water frequency, which facilitates the detection of the CEST effects from these amide protons. The ratio of the CEST effects from these amide protons is correlated with pH in the range of 5.5–7.4 via a third-order polynomial function [66]. In vivo kidney pH mapping was performed with healthy mice that were acidified and alkalinized with ammonium chloride and bicarbonate and with mice that had acute kidney injury [67]. No pH mapping of a tumor was performed, presumably because the agent could not reach a sufficient concentration in the tumor for statistically significant CEST detection.
Figure 18.
CEST MRI of tumor pHe with iopamidol. (a) A CEST spectrum the agent shows two CEST effects at 4.2 and 5.5 ppm. Both CEST effects are dependent on saturation conditions, which indicates that CEST MRI measurements of pH should be performed with optimized saturation conditions for best results. (b) The calculated pH based on a ratio of the CEST effects is correlated with experimental pH measured with an electrode. (c) An anatomical image shows the locations of the kidneys. (d) The pixelwise pHe map of the kidneys shows a homogenous distribution of pHe values with an average pHe of 5.8. Reproduced with permission from [66, 98].
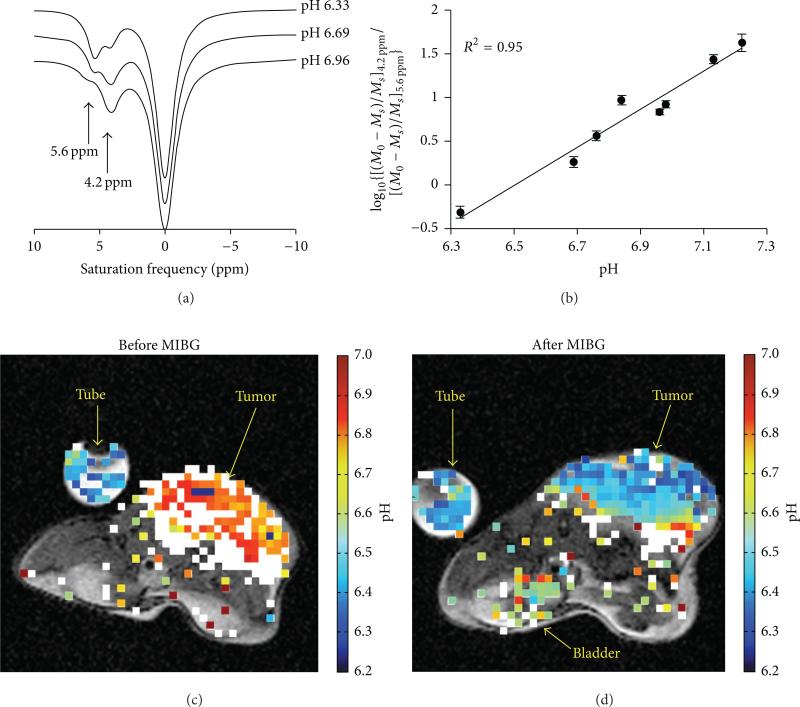
We have developed a similar CEST MRI method that uses a similar FDA approved CT/X-ray contrast agent, iopromide (Ultravist, Bayer Healthcare, Inc.) (Figure 19) [68]. The measurement of tumor acidosis with this method is known as “acidoCEST MRI.” This approach uses a rapid FISP MRI acquisition protocol to compensate for the potentially rapid in vivo pharmacokinetics of the agent and processes the results using signal averaging, Gaussian filtering, cubic spline smoothing, and Lorentzian line shape fitting to detect both CEST effects from this agent. A log10 ratio of these CEST signals is linearly correlated with pHe, without influence from the agent's concentration or other environmental effects such as the endogenous T1 relaxation time of the tissue. This approach can be used to measure the average pHe of the tumor and can also be used to construct pixelwise maps of tumor pHe. To date, we have used acidoCEST MRI to measure the tumor pHe in MCF-7 and MDA-MB-231 breast cancer models; Raji, Ramos, and Granta 519 lymphoma models; and orthotopic and xenograft models of SKOV3 ovarian cancer, which demonstrates the broad applicability of this method. In addition, iopromide is clinically approved for CT diagnoses, saturation power, and durations needed for acidoCEST MRI have already been implemented in the clinic, and most clinical MRI instruments can perform FISP MRI studies. Therefore, acidoCEST MRI is poised for immediate translation to the clinic (Table 2).
Figure 19.
Tumor pHe measured with acidoCEST MRI using iopromide. (a) The CEST spectra of the agent show that the two CEST effects at 4.2 and 5.6 ppm are dependent on pH. (b) A log10 ratio of the two CEST effects is linearly correlated with pH as measured with a microelectrode. (c, d) The pixelwise pHe map of a mouse bearing a Raji xenograft tumor before and after treatment with MIBG, a midrocondrial poison that causes acidification. Colored pixels have acidic pHe values ≤ 7.0 that correspond to the color-bar. White pixels represent tumor regions with only a single CEST effect at 4.2 ppm, which were considered to have neutral pHe values > 7.0. Reproduced with permission from [68].
Table 2.
Summary of CEST methods to detect pH.
| Agent | Range | Admin. | Spatial res., cm3 |
Temporal res. | CEST acquisition |
Mouse model | Reference |
|---|---|---|---|---|---|---|---|
| Yb-DOTAM-Gly & Eu-DOTAM-Gly | 6.5-8.0 | — | — | — | — | In vitro | [54] |
| Pr-DOTAM-Gly | 5.5-7.5 | — | — | — | — | In vitro | [55, 56] |
| Nd-DOTAM-Gly | 6-7.5 | — | — | — | — | In vitro | [55] |
| Eu-DOTAM-Gly | 6-7.5 | — | — | — | — | In vitro | [55] |
| Dendrimer Yb-DOTAM | 5-7 | — | — | — | — | In vitro | [57] |
| 5,6-Dihydrouracil | 6.5-7.0 | — | — | — | — | In vitro | [58] |
| APT | pH > 5.0 | Endogenous | 1.56 × 10⁻³ | 4 + 10 s (2 offset) | CEST-EPI 0.6 μT | Ischemic rat brain, 6.52 ± 0.32 | [59] |
| APT with creatine | 5.2-6.4 | Endogenous | 2.5 × 10⁻³ | 7.5 + 15 s (2 offset) | CEST-EPI 0.6 μT | Healthy human brain | [60] |
| Yb-HPDO3A | 5.2-6.7 | i.v. 1.2 mmol/kg | 2.2 × 10⁻³ | 5 min | CEST-RARE, 24 μT | Melanoma Early 2 mm dia 6.1 Late 10 mm dia 5.8 | [61] |
| Tm-DOTAM-Gly-Lys | 6.0-8.0 | Direct inj 50 μL 100 mM | 1.28 × 10⁻³ | 26 min 36 s | CEST-RARE 14 μT | Leg muscle 7.2 ± 0.2 | [62, 63] |
| Yb-DO3A-oAA | 6.1-7.75 6.35-7.57 6.34-7.82 ± 0.21 |
50 μL of 60 mM direct injection into flank tumor i.v. 50 μL 100 mM |
1.17 × 10⁻³ | 5.2 min | CEST-FISP 20 μT | MCF-7, pHe ± 6.5 37°C MDA-MB-231 ROI: 6.82 ± 0.21 Pixel: 6.8 ± 0.4 | [64, 65] |
| Iopamidol | 5.5-7.7 | 2.0 mM/kg | 4.39 × 10⁻⁴ | 4 min 18 s | CEST-RARE 3 μT | Acute kidney injury of mouse, healthy kidney 6.71 ± 0.16, after injury, pH 7.09 ± 0.10 | [66, 67] |
| Iopromide | 6.2-7.2 | 12 mM/kg | 1.25 × 10⁻⁴ | 4 min 50 s | CEST-FISP 2.8 μT | MDA-MB-231 pH 6.5-7.2 | [68] |
6. Conclusions
The noninvasive measurement of pH has evolved from optical imaging, PET, EPR imaging, MR spectroscopy, and T1-weighted MRI, towards the newer technique of CEST MRI. Improvements in CEST MRI pulse sequences and image analysis methods have provided the ability to perform relatively routine research studies. Methods using endogenous proteins to generate CEST, PARACEST agents, and DIACEST agents are each under continued development. The approaches that measure endogenous CEST signals or signals from DIACEST agents that are already clinically approved have great potential for clinical translation. These inevitable clinical studies may provide the foundation for providing improved diagnoses and rapid evaluations of early responses to anticancer therapies and treatments.
Acknowledgments
The authors would like to acknowledge the support from the Phoenix Friends of the Arizona Cancer Center, the Community Foundation of Southern Arizona, the Better than Ever Program, R01CA167183-01 and P50 CA95060. Liu Qi Chen was supported through the Anne Rita Monahan Foundation.
Footnotes
Conflict of Interests
The authors declare that there is no conflict of interests regarding the publication of this paper.
References
- 1.Hanahan D, Weinberg RA. Hallmarks of cancer: the next generation. Cell. 2011;144(5):646–674. doi: 10.1016/j.cell.2011.02.013. [DOI] [PubMed] [Google Scholar]
- 2.Beddek AJ, Rawson P, Peng L, et al. Profiling the metabolic proteome of bovine mammary tissue. Proteomics. 2008;8(7):1502–1515. doi: 10.1002/pmic.200700864. [DOI] [PubMed] [Google Scholar]
- 3.Warburg O. On the origin of cancer cells. Science. 1956;123(3191):309–314. doi: 10.1126/science.123.3191.309. [DOI] [PubMed] [Google Scholar]
- 4.Heiden MGV, Cantley LC, Thompson CB. Understanding the Warburg effect: the metabolic requirements of cell proliferation. Science. 2009;324(5930):1029–1033. doi: 10.1126/science.1160809. [DOI] [PMC free article] [PubMed] [Google Scholar]
- 5.Gillies RJ, Raghunand N, Garcia-Martin ML, Gatenby RA. pH imaging. IEEE Engineering in Medicine and Biology Magazine. 2004;23(5):57–64. doi: 10.1109/memb.2004.1360409. [DOI] [PubMed] [Google Scholar]
- 6.Gillies RJ, Raghunand N, Karczmar GS, Bhujwalla ZM. MRI of the tumor microenvironment. Journal of Magnetic Resonance Imaging. 2002;16(4):430–450. doi: 10.1002/jmri.10181. [DOI] [PubMed] [Google Scholar]
- 7.Martínez-Zaguilán R, Seftor EA, Seftor REB, Chu YW, Gillies RJ, Hendrix MJC. Acidic pH enhances the invasive behavior of human melanoma cells. Clinical and Experimental Metastasis. 1996;14(2):176–186. doi: 10.1007/BF00121214. [DOI] [PubMed] [Google Scholar]
- 8.Gillies RJ, Gatenby RA. Hypoxia and adaptive landscapes in the evolution of carcinogenesis. Cancer and Metastasis Reviews. 2007;26(2):311–317. doi: 10.1007/s10555-007-9065-z. [DOI] [PubMed] [Google Scholar]
- 9.Marino ML, Lozupone F, Fais S, de Milito A. Tumor acidity and malignancy: novel aspects in the design of antitumor therapy. Cancer. 2008;6:55–66. [Google Scholar]
- 10.Raghunand N, Mahoney BP, Gillies RJ. Tumor acidity, ion trapping and chemotherapeutics: II. pH-dependent partition coefficients predict importance of ion trapping on pharmacokinetics of weakly basic chemotherapeutic agents. Biochemical Pharmacology. 2003;66(7):1219–1229. doi: 10.1016/s0006-2952(03)00468-4. [DOI] [PubMed] [Google Scholar]
- 11.Raghunand N, Martínez-Zaguilán R, Wright SH, Gillies RJ. pH and drug resistance. II. Turnover of acidic vesicles and resistance to weakly basic chemotherapeutic drugs. Biochemical Pharmacology. 1999;57(9):1047–1058. doi: 10.1016/s0006-2952(99)00021-0. [DOI] [PubMed] [Google Scholar]
- 12.Mahoney BP, Raghunand N, Baggett B, Gillies RJ. Tumor acidity, ion trapping and chemotherapeutics. I. Acid pH affects the distribution of chemotherapeutic agents in vitro. Biochemical Pharmacology. 2003;66(7):1207–1218. doi: 10.1016/s0006-2952(03)00467-2. [DOI] [PubMed] [Google Scholar]
- 13.Raghunand N, He X, van Sluis R, et al. Enhancement of chemotherapy by manipulation of tumour pH. British Journal of Cancer. 1999;80(7):1005–1011. doi: 10.1038/sj.bjc.6690455. [DOI] [PMC free article] [PubMed] [Google Scholar]
- 14.Robey IF, Baggett BK, Kirkpatrick ND, et al. Bicarbonate increases tumor pH and inhibits spontaneous metastases. Cancer Research. 2009;69(6):2260–2268. doi: 10.1158/0008-5472.CAN-07-5575. [DOI] [PMC free article] [PubMed] [Google Scholar]
- 15.Silva AS, Yunes JA, Gillies RJ, Gatenby RA. The potential role of systemic buffers in reducing intratumoral extracellular pH and acid-mediated invasion. Cancer Research. 2009;69(6):2677–2684. doi: 10.1158/0008-5472.CAN-08-2394. [DOI] [PMC free article] [PubMed] [Google Scholar]
- 16.Ashby BS, Cantab MB. pH studies in human malignant tumours. The Lancet. 1966;288(7458):312–315. doi: 10.1016/s0140-6736(66)92598-0. [DOI] [PubMed] [Google Scholar]
- 17.Prescott DM, Charles HC, Poulson JM, et al. The relationship between intracellular and extracellular pH in spontaneous canine tumors. Clinical Cancer Research. 2000;6(6):2501–2505. [PubMed] [Google Scholar]
- 18.Wike-Hooley JL, van den Berg AP, van der Zee J, Reinhold HS. Human tumour pH and its variation. European Journal of Cancer and Clinical Oncology. 1985;21(7):785–791. doi: 10.1016/0277-5379(85)90216-0. [DOI] [PubMed] [Google Scholar]
- 19.Gatenby RA, Gawlinski ET, Gmitro AF, Kaylor B, Gillies RJ. Acid-mediated tumor invasion: a multidisciplinary study. Cancer Research. 2006;66(10):5216–5223. doi: 10.1158/0008-5472.CAN-05-4193. [DOI] [PubMed] [Google Scholar]
- 20.Lin Y, Wu T-Y, Gmitro AF. Error analysis of ratiometric imaging of extracellular pH in a window chamber model. Journal of Biomedical Optics. 2012;17(4) doi: 10.1117/1.JBO.17.4.046004. Article ID 046004. [DOI] [PMC free article] [PubMed] [Google Scholar]
- 21.Estrella V, Chen T, Lloyd M, et al. Acidity generated by the tumor microenvironment drives local invasion. Cancer Research. 2013;73(5):1524–1535. doi: 10.1158/0008-5472.CAN-12-2796. [DOI] [PMC free article] [PubMed] [Google Scholar]
- 22.Reshetnyak YK, Segala M, Andreev OA, Engelman DM. A monomeric membrane peptide that lives in three worlds: in solution, attached to, and inserted across lipid bilayers. Biophysical Journal. 2007;93(7):2363–2372. doi: 10.1529/biophysj.107.109967. [DOI] [PMC free article] [PubMed] [Google Scholar]
- 23.Vāvere AL, Biddlecombe GB, Spees WM, et al. A novel technology for the imaging of acidic prostate tumors by positron emission tomography. Cancer Research. 2009;69(10):4510–4516. doi: 10.1158/0008-5472.CAN-08-3781. [DOI] [PMC free article] [PubMed] [Google Scholar]
- 24.Weerakkody D, Moshnikova A, Thakur MS, et al. Family of pH (low) insertion peptides for tumor targeting. Proceedings of the National Academy of Sciences of the United States of America. 2013;110(15):5834–5839. doi: 10.1073/pnas.1303708110. [DOI] [PMC free article] [PubMed] [Google Scholar]
- 25.Li C, Xia J, Wei X, Yan H, Si Z, Ju S. PH-Activated near-infrared fluorescence nanoprobe imaging tumors by sensing the acidic microenvironment. Advanced Functional Materials. 2010;20(14):2222–2230. [Google Scholar]
- 26.Dellian M, Helmlinger G, Yuan F, Jain RK. Fluorescence ratio imaging of interstitial pH in solid tumours: effect of glucose on spatial and temporal gradients. British Journal of Cancer. 1996;74(8):1206–1215. doi: 10.1038/bjc.1996.518. [DOI] [PMC free article] [PubMed] [Google Scholar]
- 27.Hassan M, Riley J, Chernomordik V, et al. Fluorescence lifetime imaging system for in vivo studies. Molecular Imaging. 2007;6(4):229–236. [PMC free article] [PubMed] [Google Scholar]
- 28.Martin GR, Jain RK. Noninvasive measurement of interstitial pH profiles in normal and neoplastic tissue using fluorescence ratio imaging microscopy. Cancer Research. 1994;54(21):5670–5674. [PubMed] [Google Scholar]
- 29.Gatenby RA, Gawlinski ET, Gmitro AF, Kaylor B, Gillies RJ. Acid-mediated tumor invasion: a multidisciplinary study. Cancer Research. 2006;66(10):5216–5223. doi: 10.1158/0008-5472.CAN-05-4193. [DOI] [PubMed] [Google Scholar]
- 30.Stummer W, Pichlmeier U, Meinel T, Wiestler OD, Zanella F, Reulen H-J. Fluorescence-guided surgery with 5-aminolevulinic acid for resection of malignant glioma: a randomised controlled multicentre phase III trial. The Lancet Oncology. 2006;7(5):392–401. doi: 10.1016/S1470-2045(06)70665-9. [DOI] [PubMed] [Google Scholar]
- 31.Andreev OA, Dupuy AD, Segala M, et al. Mechanism and uses of a membrane peptide that targets tumors and other acidic tissues in vivo. Proceedings of the National Academy of Sciences of the United States of America. 2007;104(19):7893–7898. doi: 10.1073/pnas.0702439104. [DOI] [PMC free article] [PubMed] [Google Scholar]
- 32.Visser EP, Disselhorst JA, Brom M, et al. Spatial resolution and sensitivity of the Inveon small-animal PET scanner. Journal of Nuclear Medicine. 2009;50(1):139–147. doi: 10.2967/jnumed.108.055152. [DOI] [PubMed] [Google Scholar]
- 33.Yoshitomi T, Suzuki R, Mamiya T, Matsui H, Hirayama A, Nagasaki Y. pH-sensitive radical-containing-nanoparticle (RNP) for the L-band-EPR imaging of low pH circumstances. Bioconjugate Chemistry. 2009;20(9):1792–1798. doi: 10.1021/bc900214f. [DOI] [PubMed] [Google Scholar]
- 34.García-Martín M-L, Hérigualt G, Rémy C, et al. Mapping extracellular pH in rat brain gliomas in vivo by 1H magnetic resonance spectroscopic imaging: comparison with maps of metabolites. Cancer Research. 2001;61(17):6524–6531. [PubMed] [Google Scholar]
- 35.Khramtsov VV, Grigor'ev IA, Foster MA, Lurie DJ, Nicholson I. Biological applications of spin pH probes. Cellular and Molecular Biology. 2000;46(8):1361–1374. [PubMed] [Google Scholar]
- 36.Sotgiu A, Mäder K, Placidi G, Colacicchi S, Ursini CL, Alecci M. pH-Sensitive imaging by low-frequency EPR: a model study for biological applications. Physics in Medicine and Biology. 1998;43(7):1921–1930. doi: 10.1088/0031-9155/43/7/013. [DOI] [PubMed] [Google Scholar]
- 37.Yoo B, Pagel MD. An overview of responsive MRI contrast agents for molecular imaging. Frontiers in Bioscience. 2008;13(5):1733–1752. doi: 10.2741/2796. [DOI] [PubMed] [Google Scholar]
- 38.Golder W. Magnetic resonance spectroscopy in clinical oncology. Onkologie. 2004;27(3):304–309. doi: 10.1159/000077983. [DOI] [PubMed] [Google Scholar]
- 39.Gillies RJ, Morse DL. In vivo magnetic resonance spectroscopy in cancer. Annual Review of Biomedical Engineering. 2005;7:287–326. doi: 10.1146/annurev.bioeng.7.060804.100411. [DOI] [PubMed] [Google Scholar]
- 40.Vermathen P, Capizzano AA, Maudsley AA. Administration and 1H MRS detection of histidine in human brain: application to in vivo pH measurement. Magnetic Resonance in Medicine. 2000;43(5):665–675. doi: 10.1002/(sici)1522-2594(200005)43:5<665::aid-mrm8>3.0.co;2-3. [DOI] [PubMed] [Google Scholar]
- 41.Gillies RJ, Liu Z, Bhujwalla Z. 31P-MRS measurements of extracellular pH of tumors using 3-aminopropylphosphonate. The American Journal of Physiology. 1994;267(1):C195–C203. doi: 10.1152/ajpcell.1994.267.1.C195. [DOI] [PubMed] [Google Scholar]
- 42.Aoki Y, Akagi K, Tanaka Y, Kawai J, Takahashi M. Measurement of intratumor pH by pH indicator used in 19F-magnetic resonance spectroscopy: measurement of extracellular pH decrease caused by hyperthermia combined with hydralazine. Investigative Radiology. 1996;31(11):680–689. doi: 10.1097/00004424-199611000-00002. [DOI] [PubMed] [Google Scholar]
- 43.Bhujwalla ZM, McCoy CL, Glickson JD, Gillies RJ, Stubbs M. Estimations of intra- and extracellular volume and pH by 31P magnetic resonance spectroscopy: effect of therapy on RIF-1 tumours. British Journal of Cancer. 1998;78(5):606–611. doi: 10.1038/bjc.1998.548. [DOI] [PMC free article] [PubMed] [Google Scholar]
- 44.Lutz NW, Fur YL, Chiche J, Pouysse J, Cozzone PJ. Quantitative in vivo characterization of intracellular and extra-cellular pH profiles in heterogeneous tumors: a novel method enabling multiparametric pH analysis. Cancer Research. 2013;73(15):4616–4628. doi: 10.1158/0008-5472.CAN-13-0767. [DOI] [PubMed] [Google Scholar]
- 45.Zhou R, Bansal N, Leeper DB, Glickson JD. Intracellular acidification of human melanoma xenografts by the respiratory inhibitor m-iodobenzylguanidine plus hyperglycemia: a 31P magnetic resonance spectroscopy study. Cancer Research. 2000;60(13):3532–3536. [PubMed] [Google Scholar]
- 46.Raghunand N, Mahoney B, van Sluis R, Baggett B, Gillies RJ. Acute metabolic alkalosis enhances response of C3H mouse mammary tumors to the weak base mitoxantrone. Neoplasia. 2001;3(3):227–235. doi: 10.1038/sj.neo.7900151. [DOI] [PMC free article] [PubMed] [Google Scholar]
- 47.Ojugo ASE, McSheehy PMJ, McIntyre DJO, et al. Measurement of the extracellular pH of solid tumours in mice by magnetic resonance spectroscopy: a comparison of exogenous 19F and 31P probes. NMR in Biomedicine. 1999;12(8):495–504. doi: 10.1002/(sici)1099-1492(199912)12:8<495::aid-nbm594>3.0.co;2-k. [DOI] [PubMed] [Google Scholar]
- 48.Gallagher FA, Kettunen MI, Day SE, et al. Magnetic resonance imaging of pH in vivo using hyperpolarized 13C-labelled bicarbonate. Nature. 2008;453(7197):940–943. doi: 10.1038/nature07017. [DOI] [PubMed] [Google Scholar]
- 49.Oishi M, Sumitani S, Nagasaki Y. On-off regulation of 19F magnetic resonance signals based on pH-sensitive PEGylated nanogels for potential tumor-specific smart 19F MRI probes. Bioconjugate Chemistry. 2007;18(5):1379–1382. doi: 10.1021/bc7002154. [DOI] [PubMed] [Google Scholar]
- 50.Garcia-Martin ML, Martinez GV, Raghunand N, Sherry AD, Zhang S, Gillies RJ. High resolution pHe imaging of rat glioma using pH-dependent relaxivity. Magnetic Resonance in Medicine. 2006;55(2):309–315. doi: 10.1002/mrm.20773. [DOI] [PubMed] [Google Scholar]
- 51.Raghunand N, Howison C, Sherry AD, Zhang S, Gillies RJ. Renal and systemic pH imaging by contrast-enhanced MRI. Magnetic Resonance in Medicine. 2003;49(2):249–257. doi: 10.1002/mrm.10347. [DOI] [PubMed] [Google Scholar]
- 52.Raghunand N, Zhang S, Sherry AD, Gillies RJ. In vivo magnetic resonance imaging of tissue pH using a novel pH-sensitive contrast agent, GdDOTA-4AmP. Academic Radiology. 2002;9(2):S481–S483. doi: 10.1016/s1076-6332(03)80270-2. [DOI] [PubMed] [Google Scholar]
- 53.Martinez GV, Zhang X, García-Martín ML, et al. Imaging the extracellular pH of tumors by MRI after injection of a single cocktail of T1 and T2 contrast agents. NMR in Biomedicine. 2011;24(10):1380–1391. doi: 10.1002/nbm.1701. [DOI] [PMC free article] [PubMed] [Google Scholar]
- 54.Aime S, Barge A, Castelli DD, et al. Paramagnetic lanthanide(III) complexes as pH-sensitive chemical exchange saturation transfer (CEST) contrast agents for MRI applications. Magnetic Resonance in Medicine. 2002;47(4):639–648. doi: 10.1002/mrm.10106. [DOI] [PubMed] [Google Scholar]
- 55.Aime S, Delli Castelli D, Terreno E. Novel pH-reporter MRI contrast agents. Angewandte Chemie International Edition. 2002;41(22):4334–4336. doi: 10.1002/1521-3773(20021115)41:22<4334::AID-ANIE4334>3.0.CO;2-1. [DOI] [PubMed] [Google Scholar]
- 56.Terreno E, Castelli DD, Cravotto G, Milone L, Aime S. Ln(III)-DOTAMGly complexes: a versatile series to assess the determinants of the efficacy of paramagnetic chemical exchange saturation transfer agents for magnetic resonance imaging applications. Investigative Radiology. 2004;39(4):235–243. doi: 10.1097/01.rli.0000116607.26372.d0. [DOI] [PubMed] [Google Scholar]
- 57.Pikkemaat JA, Wegh RT, Lamerichs R, et al. Dendritic PARACEST contrast agents for magnetic resonance imaging. Contrast Media and Molecular Imaging. 2007;2(5):229–239. doi: 10.1002/cmmi.149. [DOI] [PubMed] [Google Scholar]
- 58.McMahon MT, Gilad AA, DeLiso MA, Cromer Berman SM, Bulte JWM, van Zijl PCM. New ‘multicolor’ polypeptide diamagnetic chemical exchange saturation transfer (DIACEST) contrast agents for MRI. Magnetic Resonance in Medicine. 2008;60(4):803–812. doi: 10.1002/mrm.21683. [DOI] [PMC free article] [PubMed] [Google Scholar]
- 59.Zhou J, Payen J-F, Wilson DA, Traystman RJ, Van Zijl PCM. Using the amide proton signals of intracellular proteins and peptides to detect pH effects in MRI. Nature Medicine. 2003;9(8):1085–1090. doi: 10.1038/nm907. [DOI] [PubMed] [Google Scholar]
- 60.Sun PZ, Benner T, Kumar A, Sorensen AG. Investigation of optimizing and translating pH-sensitive pulsed-chemical exchange saturation transfer (CEST) imaging to a 3T clinical scanner. Magnetic Resonance in Medicine. 2008;60(4):834–841. doi: 10.1002/mrm.21714. [DOI] [PMC free article] [PubMed] [Google Scholar]
- 61.Delli Castelli D, Ferrauto G, Cutrin JC, Terreno E, Aime S. In vivo maps of extracellular pH in murine melanoma by CEST-MRI. Magnetic Resonance in Medicine. 2014;71(1):326–332. doi: 10.1002/mrm.24664. [DOI] [PubMed] [Google Scholar]
- 62.McVicar N, Li AX, Suchý M, Hudson RHE, Menon RS, Bartha R. Simultaneous in vivo pH and temperature mapping using a PARACEST-MRI contrast agent. Magnetic Resonance in Medicine. 2013;70(4):1016–1025. doi: 10.1002/mrm.24539. [DOI] [PubMed] [Google Scholar]
- 63.Wojciechowski F, Suchy M, Li AX, Azab HA, Bartha R, Hudson RHE. A robust and convergent synthesis of dipeptide-DOTAM conjugates as chelators for lanthanide ions: new PARACEST MRI agents. Bioconjugate Chemistry. 2007;18(5):1625–1636. doi: 10.1021/bc0701287. [DOI] [PubMed] [Google Scholar]
- 64.Sun PZ, Wang E, Cheung JS, Zhang X, Benner T, Sorensen AG. Simulation and optimization of pulsed radio frequency irradiation scheme for chemical exchange saturation transfer (CEST) MRI-demonstration of pH-weighted pulsed-amide proton CEST MRI in an animal model of acute cerebral ischemia. Magnetic Resonance in Medicine. 2011;66(4):1042–1048. doi: 10.1002/mrm.22894. [DOI] [PMC free article] [PubMed] [Google Scholar]
- 65.Liu G, Li Y, Sheth VR, Pagel MD. Imaging in vivo extracellular pH with a single paramagnetic chemical exchange saturation transfer magnetic resonance imaging contrast agent. Molecular Imaging. 2012;11(1):47–57. [PMC free article] [PubMed] [Google Scholar]
- 66.Longo DL, Dastrù W, Digilio G, et al. Iopamidol as a responsive MRI-chemical exchange saturation transfer contrast agent for pH mapping of kidneys: in vivo studies in mice at 7 T. Magnetic Resonance in Medicine. 2011;65(1):202–211. doi: 10.1002/mrm.22608. [DOI] [PubMed] [Google Scholar]
- 67.Longo DL, Busato A, Lanzardo S, Antico F, Aime S. Imaging the pH evolution of an acute kidney injury model by means of iopamidol, a MRI-CEST pH-responsive contrast agent. Magnetic Resonance in Medicine. 2013;70(3):859–864. doi: 10.1002/mrm.24513. [DOI] [PubMed] [Google Scholar]
- 68.Chen LQ, Howison CM, Jeffery JJ, Robey IF, Kuo PH, Pagel MD. Evaluations of extracellular pH within in vivo tumors using acidoCEST MRI. Magnetic Resonance in Medicine. 2014;72(5):1408–1417. doi: 10.1002/mrm.25053. [DOI] [PMC free article] [PubMed] [Google Scholar]
- 69.Bottomley PA. Spatial localization in NMR spectroscopy in vivo. Annals of the New York Academy of Sciences. 1987;508:333–348. doi: 10.1111/j.1749-6632.1987.tb32915.x. [DOI] [PubMed] [Google Scholar]
- 70.Frahm J, Merboldt K-D, Hänicke W. Localized proton spectroscopy using stimulated echoes. Journal of Magnetic Resonance. 1987;72(3):502–508. doi: 10.1002/mrm.1910170113. [DOI] [PubMed] [Google Scholar]
- 71.Ardenkjær-Larsen JH, Fridlund B, Gram A, et al. Increase in signal-to-noise ratio of >10,000 times in liquid-state NMR. Proceedings of the National Academy of Sciences of the United States of America. 2003;100(18):10158–10163. doi: 10.1073/pnas.1733835100. [DOI] [PMC free article] [PubMed] [Google Scholar]
- 72.Aime S, Botta M, Crich SG, Giovenzana G, Palmisano G, Sisti M. A macromolecular Gd(III) complex as pH-responsive relaxometric probe for MRI applications. Chemical Communications. 1999;(16):1577–1578. [Google Scholar]
- 73.Hovland R, Gløgård C, Aasen AJ, Klaveness J. Gadolinium DO3A derivatives mimicking phospholipids; preparation and in vitro evaluation as pH responsive MRI contrast agents. Journal of the Chemical Society, Perkin Transactions 2. 2001;(6):929–933. [Google Scholar]
- 74.Laus S, Sour A, Ruloff R, Tóth É, Merhach AE. otational dynamics account for pH-dependent relaxivities of PAMAM dendrimeric, Gd-based potential MRI contrast agents. Chemistry—A European Journal. 2005;11(10):3064–3076. doi: 10.1002/chem.200401326. [DOI] [PubMed] [Google Scholar]
- 75.Hartman KB, Laus S, Bolskar RD, et al. Gadonanotubes as ultrasensitive pH-smart probes for magnetic resonance imaging. Nano Letters. 2008;8(2):415–419. doi: 10.1021/nl0720408. [DOI] [PubMed] [Google Scholar]
- 76.Tóth É, Bolskar RD, Borel A, et al. Water-soluble gadofullerenes: toward high-relaxivity, pH-responsive MRI contrast agents. Journal of the American Chemical Society. 2005;127(2):799–805. doi: 10.1021/ja044688h. [DOI] [PubMed] [Google Scholar]
- 77.Lokling K-E, Fossheim SL, Skurtveit R, Bjornerud A, Klaveness J. pH-sensitive paramagnetic liposomes as MRI contrast agents: in vitro feasibility studies. Magnetic Resonance Imaging. 2001;19(5):731–738. doi: 10.1016/s0730-725x(01)00380-0. [DOI] [PubMed] [Google Scholar]
- 78.Lowe MP, Parker D, Reany O, et al. pH-dependent modulation of relaxivity and luminescence in macrocyclic gadolinium and europium complexes based on reversible intramolecular sulfonamide ligation. Journal of the American Chemical Society. 2001;123(31):7601–7609. doi: 10.1021/ja0103647. [DOI] [PubMed] [Google Scholar]
- 79.Woods M, Kiefer GE, Bott S, et al. Synthesis, relaxometric and photophysical properties of a new pH-responsive MRI contrast agent: the effect of other ligating groups on dissociation of a p-nitrophenolic pendant arm. Journal of the American Chemical Society. 2004;126(30):9248–9256. doi: 10.1021/ja048299z. [DOI] [PMC free article] [PubMed] [Google Scholar]
- 80.Hall J, Häner R, Aime S, et al. Relaxometric and luminescence behaviour of triaquahexaazamacrocyclic complexes, the gadolinium complex displaying a high relaxivity with a pronounced pH dependence. New Journal of Chemistry. 1998;22(6):627–631. [Google Scholar]
- 81.Lecommandoux S, Sandre O, Chécot F, Perzynski R. Smart hybrid magnetic self-assembled micelles and hollow capsules. Progress in Solid State Chemistry. 2006;34(2–4):171–179. [Google Scholar]
- 82.Goycoolea FM, Fernández-Valle ME, Aranaz I, Heras Á. PH- and temperature-sensitive chitosan hydrogels: swelling and MRI studies. Macromolecular Chemistry and Physics. 2011;212(9):887–895. [Google Scholar]
- 83.Jokivarsi KT, Gröhn HI, Gröhn OH, Kauppinen RA. Proton transfer ratio, lactate, and intracellular pH in acute cerebral ischemia. Magnetic Resonance in Medicine. 2007;57(4):647–653. doi: 10.1002/mrm.21181. [DOI] [PubMed] [Google Scholar]
- 84.Sun PZ, Wang E, Cheung JS. Imaging acute ischemic tissue acidosis with pH-sensitive endogenous amide proton transfer (APT) MRI-Correction of tissue relaxation and concomitant RF irradiation effects toward mapping quantitative cerebral tissue pH. NeuroImage. 2012;60(1):1–6. doi: 10.1016/j.neuroimage.2011.11.091. [DOI] [PMC free article] [PubMed] [Google Scholar]
- 85.Zhang S, Wu K, Sherry AD. A novel pH-sensitive MRI contrast agent. Angewandte Chemie—International Edition. 1999;38(21):3192–3194. [PubMed] [Google Scholar]
- 86.Aime S, Fedeli F, Sanino A, Terreno E. A R2/R1 ratiometric procedure for a concentration-independent, pH-responsive, Gd(III)-based MRI agent. Journal of the American Chemical Society. 2006;128(35):11326–11327. doi: 10.1021/ja062387x. [DOI] [PubMed] [Google Scholar]
- 87.Sherry AD, Woods M. Chemical exchange saturation transfer contrast agents for magnetic resonance imaging. Annual Review of Biomedical Engineering. 2008;10:391–411. doi: 10.1146/annurev.bioeng.9.060906.151929. [DOI] [PMC free article] [PubMed] [Google Scholar]
- 88.Vinogradov E, Sherry AD, Lenkinski RE. CEST: from basic principles to applications, challenges and opportunities. Journal of Magnetic Resonance. 2013;229:155–172. doi: 10.1016/j.jmr.2012.11.024. [DOI] [PMC free article] [PubMed] [Google Scholar]
- 89.van Zijl PCM, Jones CK, Ren J, Malloy CR, Sherry AD. MRI detection of glycogen in vivo by using chemical exchange saturation transfer imaging (glycoCEST) Proceedings of the National Academy of Sciences of the United States of America. 2007;104(11):4359–4364. doi: 10.1073/pnas.0700281104. [DOI] [PMC free article] [PubMed] [Google Scholar]
- 90.Ling W, Regatte RR, Navon G, Jerschow A. Assessment of glycosaminoglycan concentration in vivo by chemical exchange-dependent saturation transfer (gagCEST) Proceedings of the National Academy of Sciences of the United States of America. 2008;105(7):2266–2270. doi: 10.1073/pnas.0707666105. [DOI] [PMC free article] [PubMed] [Google Scholar]
- 91.Cai K, Haris M, Singh A, et al. Magnetic resonance imaging of glutamate. Nature Medicine. 2012;18(2):302–306. doi: 10.1038/nm.2615. [DOI] [PMC free article] [PubMed] [Google Scholar]
- 92.Zhou J, Lal B, Wilson DA, Laterra J, van Zijl PCM. Amide proton transfer (APT) contrast for imaging of brain tumors. Magnetic Resonance in Medicine. 2003;50(6):1120–1126. doi: 10.1002/mrm.10651. [DOI] [PubMed] [Google Scholar]
- 93.Sun PZ, Zhou J, Huang J, Van Zijl P. Simplified quantitative description of amide proton transfer (APT) imaging during acute ischemia. Magnetic Resonance in Medicine. 2007;57(2):405–410. doi: 10.1002/mrm.21151. [DOI] [PubMed] [Google Scholar]
- 94.Sun PZ, Cheung JS, Wang E, Lo EH. Association between pH-weighted endogenous amide proton chemical exchange saturation transfer MRI and tissue lactic acidosis during acute ischemic stroke. Journal of Cerebral Blood Flow and Metabolism. 2011;31(8):1743–1750. doi: 10.1038/jcbfm.2011.23. [DOI] [PMC free article] [PubMed] [Google Scholar]
- 95.Zhou J, Wilson DA, Sun PZ, Klaus JA, Van Zijl PCM. Quantitative description of proton exchange processes between water and endogenous and exogenous agents for WEX, CEST, and APT experiments. Magnetic Resonance in Medicine. 2004;51(5):945–952. doi: 10.1002/mrm.20048. [DOI] [PubMed] [Google Scholar]
- 96.McMahon MT, Gilad AA, Zhou J, Sun PZ, Bulte JWM, van Zijl PCM. Quantifying exchange rates in chemical exchange saturation transfer agents using the saturation time and saturation power dependencies of the magnetization transfer effect on the magnetic resonance imaging signal (QUEST and QUESP): pH calibration for poly-L-lysine and a starburst dendrimer. Magnetic Resonance in Medicine. 2006;55(4):836–847. doi: 10.1002/mrm.20818. [DOI] [PMC free article] [PubMed] [Google Scholar]
- 97.Sun PZ, Murata Y, Lu J, Wang X, Lo EH, Sorensen AG. Relaxation-compensated fast multislice amide proton transfer (APT) imaging of acute ischemic stroke. Magnetic Resonance in Medicine. 2008;59(5):1175–1182. doi: 10.1002/mrm.21591. [DOI] [PubMed] [Google Scholar]
- 98.Zaiss M, Bachert P. Chemical exchange saturation transfer (CEST) and MR Z-spectroscopy in vivo: a review of theoretical approaches and methods. Physics in Medicine and Biology. 2013;58(22):R221–R269. doi: 10.1088/0031-9155/58/22/R221. [DOI] [PubMed] [Google Scholar]
- 99.Zhang S, Merritt M, Woessner DE, Lenkinski RE, Sherry AD. PARACEST agents: modulating MRI contrast via water proton exchange. Accounts of Chemical Research. 2003;36(10):783–790. doi: 10.1021/ar020228m. [DOI] [PubMed] [Google Scholar]
- 100.Sheth VR, Liu G, Li Y, Pagel MD. Improved pH measurements with a single PARACEST MRI contrast agent. Contrast Media and Molecular Imaging. 2012;7(1):26–34. doi: 10.1002/cmmi.460. [DOI] [PMC free article] [PubMed] [Google Scholar]
- 101.Dellicastelli D, Terreno E, Aime S. YbIII-HPDO3A: a dual pH- and temperature-responsive CEST agent. Angewandte Chemie—International Edition. 2011;50(8):1798–1800. doi: 10.1002/anie.201007105. [DOI] [PubMed] [Google Scholar]
- 102.Sheth VR, Li Y, Chen LQ, Howison CM, Flask CA, Pagel MD. Measuring in vivo tumor pHe with CEST-FISP MRI. Magnetic Resonance in Medicine. 2012;67(3):760–768. doi: 10.1002/mrm.23038. [DOI] [PMC free article] [PubMed] [Google Scholar]
- 103.Wu Y, Soesbe TC, Kiefer GE, Zhao P, Sherry AD. A responsive europium(III) chelate that provides a direct readout of pH by MRI. Journal of the American Chemical Society. 2010;132(40):14002–14003. doi: 10.1021/ja106018n. [DOI] [PMC free article] [PubMed] [Google Scholar]
- 104.Suchý M, Li AX, Milne M, Bartha R, Hudson RHE. DOTAM-type ligands possessing arginine pendant groups for use in PARACEST MRI. Contrast Media and Molecular Imaging. 2012;7(5):441–449. doi: 10.1002/cmmi.1461. [DOI] [PubMed] [Google Scholar]
- 105.Ward KM, Balaban RS. Determination of pH using water protons and chemical exchange dependent saturation transfer (CEST) Magnetic Resonance in Medicine. 2000;44(5):799–802. doi: 10.1002/1522-2594(200011)44:5<799::aid-mrm18>3.0.co;2-s. [DOI] [PubMed] [Google Scholar]
- 106.Wolff SD, Balaban RS. Magnetization transfer contrast (MTC) and tissue water proton relaxation in vivo. Magnetic Resonance in Medicine. 1989;10(1):135–144. doi: 10.1002/mrm.1910100113. [DOI] [PubMed] [Google Scholar]
- 107.Ward KM, Aletras AH, Balaban RS. A new class of contrast agents for MRI based on proton chemical exchange dependent saturation transfer (CEST) Journal of Magnetic Resonance. 2000;143(1):79–87. doi: 10.1006/jmre.1999.1956. [DOI] [PubMed] [Google Scholar]
- 108.Aime S, Calabi L, Biondi L, et al. Iopamidol: exploring the potential use of a well-established x-ray contrast agent for MRI. Magnetic Resonance in Medicine. 2005;53(4):830–834. doi: 10.1002/mrm.20441. [DOI] [PubMed] [Google Scholar]


