Abstract
Dexterous continuum manipulators (DCMs) can largely increase the reachable region and steerability for minimally and less invasive surgery. Many such procedures require the DCM to be capable of producing large deflections. The real-time control of the DCM shape requires sensors that accurately detect and report large deflections. We propose a novel, large deflection, shape sensor to track the shape of a 35 mm DCM designed for a less invasive treatment of osteolysis. Two shape sensors, each with three fiber Bragg grating sensing nodes is embedded within the DCM, and the sensors’ distal ends fixed to the DCM. The DCM centerline is computed using the centerlines of each sensor curve. An experimental platform was built and different groups of experiments were carried out, including free bending and three cases of bending with obstacles. For each experiment, the DCM drive cable was pulled with a precise linear slide stage, the DCM centerline was calculated, and a 2D camera image was captured for verification. The reconstructed shape created with the shape sensors is compared with the ground truth generated by executing a 2D–3D registration between the camera image and 3D DCM model. Results show that the distal tip tracking accuracy is 0.40 ± 0.30 mm for the free bending and 0.61 ± 0.15 mm, 0.93 ± 0.05 mm and 0.23 ± 0.10 mm for three cases of bending with obstacles. The data suggest FBG arrays can accurately characterize the shape of large-deflection DCMs.
Index Terms: Fiber Bragg grating, large curvature, shape tracking, dexterous continuum manipulator, obstacle
I. Introduction
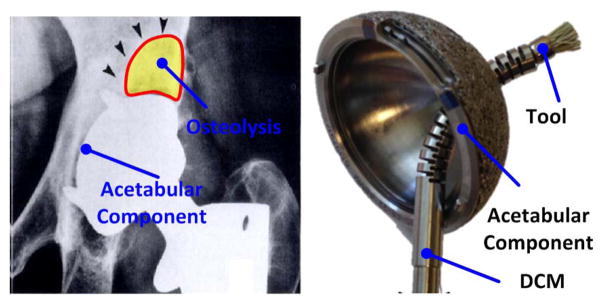
Dexterous continuum manipulators are commonly used in minimally invasive surgery (MIS) due to their superior steerability and large operating space. Previous studies have proposed and tested variations of surgical DCMs for robotic minimally invasive surgery [1]–[6]. We have developed a cable-driven DCM for the treatment of osteolysis (Fig. 1(a)). The DCM removes and replaces osteolytic lesions occurring as a result of joint wear after total hip arthroplasty [7]. This MIS approach uses the screw holes of a well-fixed acetabular implant to reach an osteolytic lesion without removing the well-fixed implant, as shown in Fig. 1(b). We believe that using the DCM will enable surgeons to access nearly the entire osteolytic lesion [8] compared to the reported 50% from rigid tools [9]. However, there is still no effective intraoperative technique for shape sensing when applying DCM. Previous efforts involved developing models for estimating the shape from cable-length measurements [10] as well as the intermittent use of x-ray for updating the model estimation [11]. However, the predictive model met with limited success, even without considering the unknown interaction with tissue and bone. Additionally, the amount of radiation exposure to the patient precludes real-time x-ray control.
Fig. 1.
The (a) osteolysis and (b) DCM with a tool through screw hole on acetabular cup.
Multi-strain sensors are capable of detecting curvatures of multiple points along the DCM, enabling reconstruction of the DCM shape. Polymer strain sensors, such as piezoelectric and piezoresistive polymers, are competitive for large deflection shape sensing, as they yield to large strains. Cianchetti et al. used Electrolycra, a piezoresistive sensor of 10mm × 15mm to reconstruct the spatial configuration of a 2D DCM, OCTOPUS, which is able to bear a strain up to 60% [12]. Shapiro et al. utilized polyvinylidene fuoride (PVDF), a thin 25mm × 13mm piezoelectric polymer to build the 2D shape of a hyper-flexible beam [13]. However, the stress-strain hysteresis of the piezoresistive polymer and the bias and drifting problem of PVDF bring in considerable errors and difficulties to the signal processing. Moreover, PVDF’s size and requirement for multiple lead wires are not compatible with a micro surgical DCM.
The Fiber Bragg grating (FBG) sensor is another commonly used strain sensor, offering a great number of advantages over polymer type sensors. These include electromagnetic interferences (EMI) immunity, stability, repeatability, high sensitivity and fast response. Moreover, multi-sensing nodes can be contained within one optical fiber, allowing all sensing nodes to share one connector. Due to their intrinsic characteristics, FBG sensors are particularly well suited for precisely measuring strain for shape tracking.
Various types of curvature detecting sensors based on FBGs have already been devised. Yi et al. evenly attached four multi-FBGs optical wires to a 0.76mm NiTi wire and used it to detect the shape of a colonscope [14]. Park et al. developed a 3D shape sensor for MRI-compatible biopsy needles by creating three 350um grooves along the 1mm diameter inner stylet and embedded 3 FBG optical fibers in these slots [15]. Roesthuis et al. used a similar method, but utilized a 1mm diameter NiTi needle [16]. Other ways to achieve directional bend sensitivity in FBG-based solutions include employing fibers with asymmetrical core or cladding geometries, introducing an asymmetrical index perturbation in the cross section of fiber by the use of CO2 or femtosecond lasers, such as the multi-core fiber [17], eccentric core fiber [18], and D-shape sensor [19]. Moore used multi-core fiber with FBG arrays for 3D shape sensing [20]. A multi-core FBG can detect larger curvature than previous kinds, but each fiber core must be separated sufficiently to avoid core–core interaction. Similar to multi-core fiber, Moon et al. assembled three FBG optical fibers in a triangular shape molded with epoxy [21]. Among all previous work, the maximum curvature detected was 22.7m−1 [17]. Our DCM is capable of an extremely tight radius of curvature (approximately 6mm), resulting in an approximate curvature of 166.7m−1 [11]. Current shape or curvature sensors have been unable to detect such a large curvature.
We previously proposed a novel large curvature detection sensor that can detect a maximum curvature of 80m−1 for constant curvature bending [22]. This paper presents the design of a shape sensing scheme for real-time tracking of the DCM shape in the presence of non-constant curvature bending. Tests are conducted for free bending of the DCM and bending of the DCM with an obstructed path. Section II introduces the shape sensor’s configuration and curvature detection principles. Section III presents the sensor’s arrangement with the DCM and the shape reconstruction scheme. In section IV, the experiments conducted via control of the driven cable are described. Section V provides the experimental results, and section VI discusses tracking accuracy, comparison of curvature, and other relevant interpretations of the results.
II. Large Curvature Detection Sensor
Generally, curvature detection is the basis of shape tracking. An array of FBG sensing nodes are placed along an optical fiber and the fiber’s shape is reconstructed from the curvatures detected by each sensing node. The FBG sensing node detects curvature based on the wavelength change of FBG due to strain and the thermal effect on wavelength. According to He, et al. [23], the wavelength shift Δλ is:
| (1) |
where kε is the strain coefficient, kΔT is thermal coefficient, ε is strain, T is temperature and Δ stands for the increment of a specific variable.
The FBG optical fiber is attached to a substrate; therefore, the curvature of the core of the FBG optical fiber is biased from the neutral bending plane of the overall assembly. The curvature is proportional to the strain that the FBG core undertakes. If the temperature influence is well compensated, the curvature is proportional to the wavelength shift,
| (2) |
where κ denotes the curvature and δ denotes the biased distance of FBG core from the neutral plane.
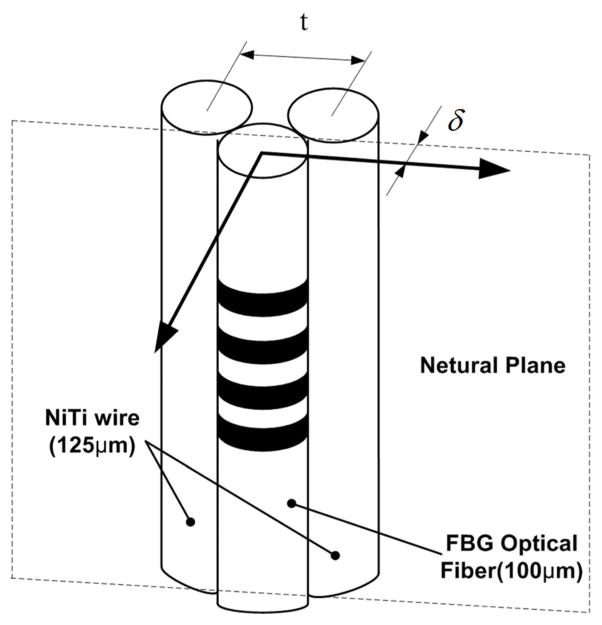
Figure 2 shows the configuration of our large curvature detecting sensor, which includes one FBG optical fiber and two NiTi wires in parallel as substrate. The biased distance from the neutral plane allows the FBG to detect large curvature without exceeding its breaking strain of 0.5% [24]. The strain sensitivity of our curvature sensor is adjusted by controlling the distance, t, between the two NiTi wires. A larger t generates a smaller δ, which enables the sensor to detect larger curvature. Additionally, the bending modulus varies in the circumferential direction, which gives the sensor tendency to bend in a specific direction. To a certain extent, this restricts the sensor from twisting.
Fig. 2.
The configuration of large curvature detection sensor.
III. Shape Tracking Scheme for DCM
A. Shape Sensor Arrangement
To detect the shape, multi curvature sensors are needed. In this paper each curvature sensor is called the shape sensing node. Also, the assembly of FBG arrays with NiTi wires is called a shape sensor.
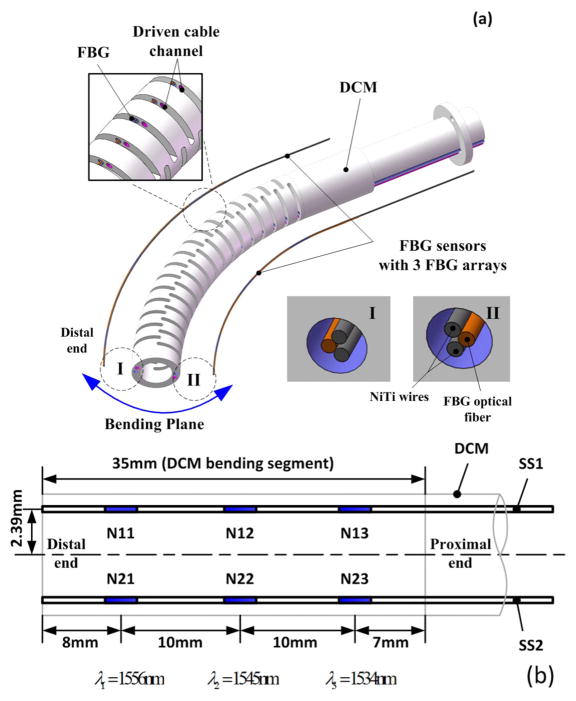
Our DCM is a nested NiTi tube cut with notches and has two drive cables actuating a planar bend for a 35mm bending segment. Since the bending is limited to two inflection points along the length of the DCM, we have used two shape sensors with 3 FBG sensing nodes for DCM shape tracking. Figure 3(a) shows the assembly of the shape sensors onto the DCM. The sensors pass through channels within the walls of the DCM, and the distal ends are fixed. The sensors’ neutral planes are kept perpendicular to the bending plane of the DCM. The sensors are able to move freely within the channels as the DCM bends and straightens. This allows the FBG sensing nodes on the tension side to move forward to the DCM distal tip, while the FBG sensing nodes on the contracting side will move backward to the proximal end. If only one shape sensor is used, there may be a significant segment without FBG sensors in the proximal part of the bending segment when the DCM bends too much. Two shape sensors in both sides will allow better coverage of the full DCM shape. In order to more accurately capture the shape of the DCM, the desired scheme is to assemble two shape sensors within each side of the DCM. Additionally, two shape sensors may help to eliminate any temperature gradient influence on the FBG’s wavelength.
Fig. 3.
(a) Assembly of shape sensors to the DCM [22]. (b) Arrangement of FBG sensing nodes.
Figure 3(b) shows the detailed arrangement of the FBG sensing nodes along the shape sensor, and the assembly of the sensors to the DCM. The sensors’ lumens are located along the wall of the manipulator and 2.39 mm from the DCM’s centerline. Three 3mm length FBG sensing nodes were arranged 10 mm apart. The magnitude of curvature change resulting from the bend of the DCM is unknown; therefore the sensing nodes are evenly spaced along the sensor. The sensing nodes N11 and N21 are 8mm from the distal end (the tip of DCM) to avoid placing the sensor within the rigid part of DCM with no notches. The sensing nodes N13 and N23 are 7mm from the proximal end (the base of DCM) to keep the sensor within the bending segment. The wavelengths of the three FBG sensing nodes are 1534nm, 1545nm, and 1556nm. These were selected by considering the 40nm wavelength detection range of the interrogator used for data acquisition. Each of the sensing nodes uses a 14nm wavelength range to allow for large curvature detection.
The relationship between wavelength shift and curvature for the FBG sensing nodes was calibrated from a series of known constant curve slots and the wavelength shift for each of them [22]. The cubic polynomial was used to fit the wavelength and curvature for each FBG node. The calibration coefficients KSS1 for SS1 and KSS2 for SS2 are,
| (3) |
B. Curve Shape Reconstruction
The shape sensor curves may be reconstructed using measured curvatures along the shape sensor. For the 2D case with our DCM, we only considered planar bending. Several discrete curvature points are measured and further extended to the whole length of the sensor. As shown in (4), a linear relationship between curvature and arc length is assumed. This simple relationship keeps the curvature continuous, the shape smooth, and reduces computational complexity. In a Cartesian coordinate system, the tangent angle of point with respect to the X axis is obtained from (5), and the coordinates for a series of discrete points can be obtained from (6).
| (4) |
| (5) |
| (6) |
where a and b denote coefficients for linear interpolation for curvature and s denotes the arc length.
C. DCM Shape Reconstruction
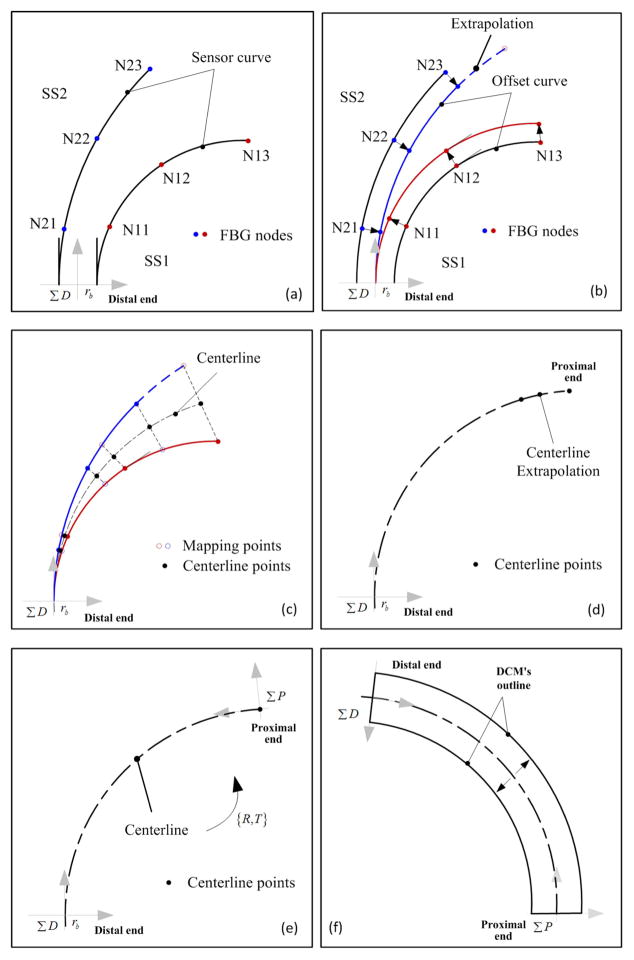
The DCM’s shape is reconstructed according to the following 6 steps, and highlighted in Fig. 4.
Fig. 4.
Schematic diagram for the shape reconstruction method. (a) SS1 -Shape sensor 1. (b) SS2 - Shape sensor 2. (c) N11, N12 and N13 - Three FBG sensing nodes along SS1. (d) N21, N22 and N23 - Three FBG sensing nodes along SS2. (e) ΣD - Distal coordinates system. (f) ΣP - Proximal coordinates system.
-
Step 1, start from the distal end, calculate the shape curves of both sensors using the method described in Section III-B, and keep the distance between start points and the tangential direction of two shape sensor curves (SS1 and SS2) 2rb and parallel (π/2 in this paper), as shown in Fig 4(a);
It is difficult to reconstruct the shape curve from the proximal end because the FBG sensing nodes near the proximal end move during DCM bending. However, it is feasible to build the shape starting from the distal end, because the distances from all FBG sensing nodes to the distal end remains constant. Herein, Σ D represents the coordinate system built with the center of the distal end as the origin point.
The distance between each of the shape sensors and DCM’s centerline, rb , is a constant; this enforces a correct outline of the DCM. FBG sensing nodes N11 and N21 on two shape sensors are a certain length away from the distal end for detecting an effective curvature. The distal end curvatures of the two shape sensors are set to be the same as that of N11 and N21.
-
Step 2, offset two sensor curves to the centerline of DCM, as shown in Fig 4(b);
The points’ coordinates on each offset curve can be obtained by,(7) where xo and yo denote the coordinates of points on the offset curves, xss and yss denote the coordinates of points on the shape curves, and θ and κ denote the tangential angle with respect to x axis of Σ D and curvature of a point.
Ideally, two sensors’ curves should coincide with each other in the distal part after offsetting, but due to errors caused by factors such as friction between the shape sensor and its lumen through the DCM wall and temperature variation, two separate offset curves are obtained.
-
Step 3, extrapolate two offset curves to obtain two curves with the same length, and then calculate their centerline, as shown in Fig 4(c);
The length of shape curves are different after offsetting, therefore, the shape curve of the shorter curve is extrapolated. With two point sets, the nearest point pairs from both sides are searched and the middle points are calculated to represent the DCM’s centerline.
Step 4, extrapolate the centerline to be 35mm long which represents the DCM centerline, as shown in Fig 4(d);
Step 5, calculate the tangential direction of the proximal end, build the proximal coordinate system Σ P, and calculate the transformation matrix as shown in Fig 4(e);
Step 6, Transform the reconstructed centerline and offset the centerline to get the DCM’s outline, as shown in Fig 4(f).
The coordinates can be calculated by,
| (8) |
where x and y denote the coordinates of a point, θcd denotes the tangential angle of the distal point, xd and yd denote the coordinates of the distal point, and the subscript Σ D and Σ P denote the coordinate systems.
IV. Experimental Setup and Experiments
A. Experimental Setup
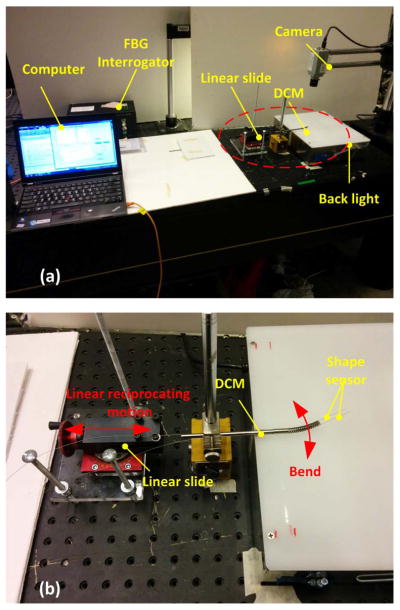
Experiments were performed to estimate the shape reconstruction performance of the above shape tracking scheme. Fig. 5 shows the experimental setup. Two sets of experiments were carried out: 1) free bending, and 2) bending in presence of obstacles on the path.
Fig. 5.
(a) Overall view. (b) Partial enlarged view for experimental platform.
The reflective wavelengths from the FBG shape sensors (Technica Optical Components, China) were analyzed using a Micron Interrogator (Micron Optics, USA). The wavelengths were processed and the reconstructed shape was displayed with algorithms written in MATLAB (MathWorks, USA). A PL-B741 camera (PixeLink, USA) was used to capture planar images of the DCM. The camera was mounted above the DCM so that the focal plane was parallel with the bending plane of the DCM. As shown in Fig. 5(b), the DCM was assembled with two shape sensors embedded and then fixed at certain height. The DCM was controlled by pulling its drive cables with two linear sliding stages, each with an accuracy of 0.01mm.
B. Free Bending Experiments
The drive cable was pulled, and stopped, in 0.8mm increments to keep the DCM stable during data collection. The FBG sensing nodes’ wavelengths and the camera image of DCM were recorded at each increment. The drive cables were pulled to the maximum 4mm (bending cycle) and then released in 0.8 mm increments in order to return to the origin point (straightening cycle). Data at nine positions were recorded including five positions for the bending cycle and four positions for the straightening cycle. Each experiment was repeated five times.
C. Bending With Obstacle Experiments
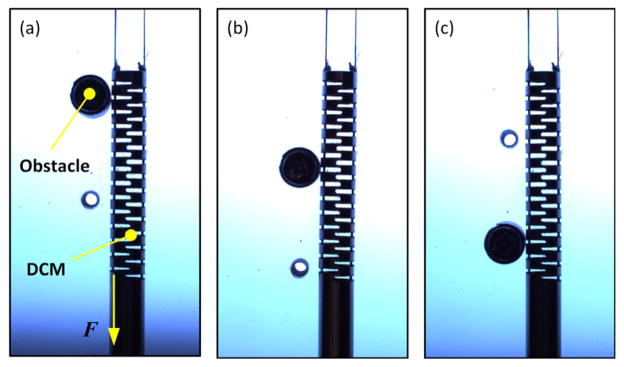
The path obstacles were placed in three positions on the same side when the DCM was straight, as shown in Fig 6.
Fig. 6.
Obstacle setup to be (a) near the distal tip (case I), (b) in the middle of bending segment (case II) and (c) near the proximal end (case III).
In the figure, F represents the force applied to one of the drive cables. The obstacles were anticipated to create “S” shape deformation with at least one inflection point. Each obstacle configuration represents a scenario in which a portion of the DCM is obstructed from free bending within the lesion space. Obstacle cases II and III represent scenarios when a portion of the DCM is within the lesion space and the rest of the DCM is constrained by the screw hole of the acetabular implant (see Fig. 1 for detail).
D. Accuracy Evaluation
DCM images taken by camera were processed with a 2D-3D registration method previously described in [10]. Using this method, the DCM outline in each camera image and the shape curve, defined by the DCM’s centerline, are computed. Given the camera’s intrinsic and extrinsic parameters, a 3D model of the DCM, and a kinematic/joint configuration of the DCM, the registration method simulates planar images of the DCM and then compares the simulated images with the true 2D camera images. This simulation process is run through an optimization algorithm over the possible DCM joint angles. The registration ensures a realistic, smooth, bend of the DCM by using a cubic spline with 5 control points to generate all 27 joint angles of the DCM. The joint angles determined by the registration process define the coordinate frames at each link of the DCM. The origins of each coordinate frame represent the DCM’s centerline. The registration method approximates the DCM’s tip position with an error less than 0.4mm [11]. The difference between tip positions from the shape reconstruction and 2D-3D registration were used to evaluate the tracking accuracy of the shape sensors. For the accuracy evaluation we also compared the curvatures. The 29 points along the DCM’s centerline, computed by the 2D-3D registration were fitted with a cubic spline and then curvature was analytically calculated.
V. Results
A. Free Bending
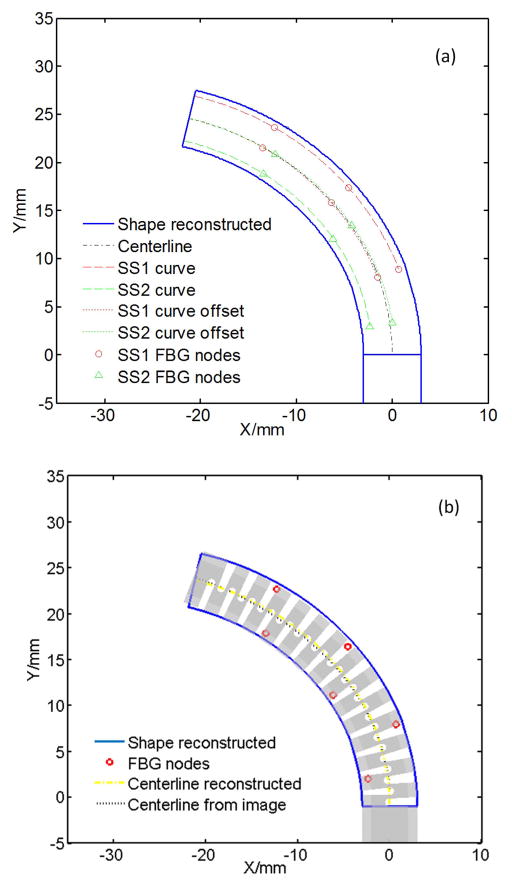
This experiment were repeated five times, each involving bending and release cycles with measurements at nine positions for each group. Forty-five shapes were reconstructed and images processed through 2D-3D registration. Fig. 7(a) displays one of the reconstructed shapes, showing the original sensor curves, their offset from the centerline, the final center-line, and the outline of the DCM. The FBG sensing nodes and their mapping points are also marked on the figure. In order to qualitatively verify consistent results, these images were superimposed on a model of the DCM generated from joint angles using 2D-3D registration method (Fig. 7(b)).
Fig. 7.
(a) The reconstructed DCM for 4mm pulling cable displacement. (b) Overlapping of reconstructed and image extracted DCM under different driven cable displacements.
The average and standard deviation of the tip position error for each of the nine drive cable displacements are listed in Table 1. The overall distal tip tracking accuracy of the curvature sensor is 0.28 ± 0.20mm for bending, 0.48±0.34 mm for straightening and 0.41 ± 0.30 mm for a bending/straightening cycle. To facilitate comparison with shape tracking research in the literature, tip error is normalized to the length of the DCM. The normalized accuracy is 1.1%+/−0.86%, and the maximum error is 3.4% for 35mm length.
TABLE I.
The Distal Tip Tracking Accuracy for Free Bending
| Cable displacement/mm | Average error/mm | Standard deviation of error/mm | Status |
|---|---|---|---|
| 0.8 | 0.18 | 0.072 | Bend |
| 1.6 | 0.12 | 0.017 | |
| 2.4 | 0.29 | 0.204 | |
| 3.2 | 0.35 | 0.217 | |
| 4.0 | 0.47 | 0.223 | |
|
| |||
| 3.2 | 0.97 | 0.220 | Straighten |
| 2.4 | 0.62 | 0.195 | |
| 1.6 | 0.40 | 0.147 | |
| 0.8 | 0.23 | 0.057 | |
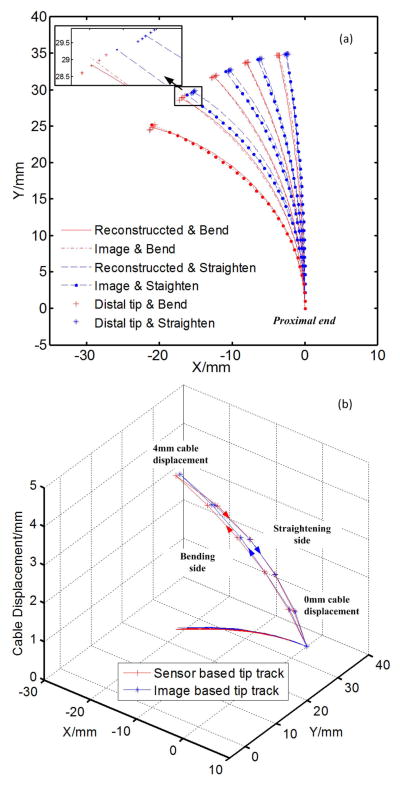
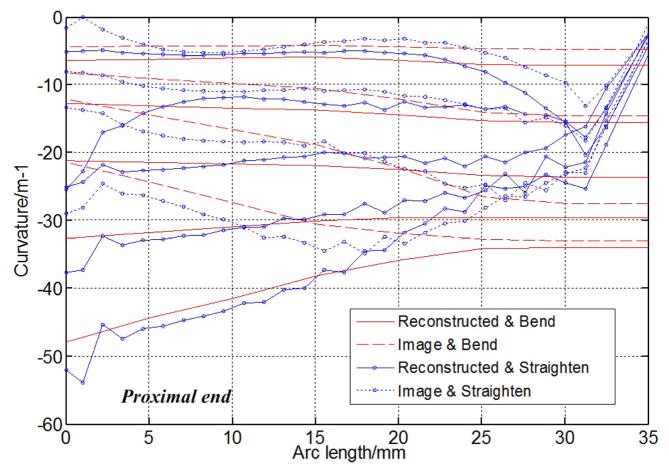
Figure 8(a) shows the comparison of DCM’s centerlines between the ones reconstructed with FBG shape sensors and the ones extracted from images (on figures, ‘reconstructed’ is used to represent the calculated results with shape sensors, and ‘image’ is used to represent the extracted results from images captured by camera). Each shape curve represents the average of 5 experiments. Except for the largest bending, the other 8 centerlines are in pairs (I, II, III and IV in Fig. 8) involving identical drive cable displacements. Hysteric behavior of the DCM was observed by comparing the identical drive cable displacements during each pair’s bending-straightening cycle. Fig. 8(b) displays the hysteresis of the tip position.
Fig. 8.
The (a) centerlines and (b) tip tracks of both shape reconstruction and image extraction.
Figure 9 illustrates the comparison of curvatures along the DCM’s centerlines for both FBG calculated shape and 2D-3D registration methods. For the image extraction method, although the shape is smoothed before calculating the curvature, there is still fluctuation caused by limited joint position and spline interpolation method, especially for those points near proximal and distal end. For each drive cable length, the average curvature of the five groups is plotted. The figure also demonstrates hysteric behavior in bending/straightening cycles.
Fig. 9.
Centerline’s curvature comparison for shape reconstruction and image extraction.
B. Bending With Obstacle in the Path
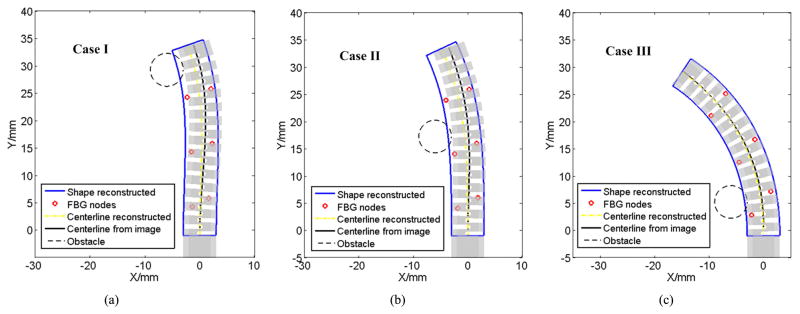
Table 2 lists the average and standard deviation of the distal tip tracking error for the bending with three different obstacle setups. Figure 10 shows the qualitative consistency of the results when superimposing the reconstructed shape from FBG sensors to that of the camera image obtained from 2D-3D registration. Figure 11 shows the curvatures obtained from camera images after 2D-3D registration change less drastically along the arc length.
TABLE II.
Distal Tip Tracking Accuracy for Bending With Obstacle
| Cable displacement/mm | Average error/mm | Standard deviation of error/mm | Status |
|---|---|---|---|
| 0.8 | 0.75 | 0.040 | I |
| 1.6 | 0.47 | 0.052 | |
|
| |||
| 0.8 | 0.97 | 0.060 | II |
| 1.6 | 0.90 | 0.021 | |
|
| |||
| 0.8 | 0.33 | 0.06 | III |
| 1.6 | 0.24 | 0.08 | |
| 2.4 | 0.14 | 0.05 | |
| 3.2 | 0.21 | 0.11 | |
Fig. 10.
The overlay of shape reconstructed for obstacle case: (a) I, (b) II and (c) III.
Fig. 11.
Comparisons between the curvatures reconstructed from sensors and extracted from image for case: (a) I, (b) II and (c) III.
VI. Discussion
A. Tracking Performance for Free Bending
From Fig. 7 and Table 1, it can be seen that the reconstructed shape with shape sensors matches well with the shape extracted via image processing. Figure 9 illustrates that two shape sensors with three FBG sensing nodes on each have embodied the curvature tendency along the centerline. Thus, a limited number of FBG sensing nodes can achieve good tracking accuracy. From Fig 7(a), it can be seen that shape curves from the two shape sensors are not parallel; therefore, using the centerline of two shape sensors can get better accuracy than using the shape curve of a single shape sensor.
There are two major factors that cause error. The first source of error is the difference between the curvature used for shape reconstruction and the actual curvatures. The shape and curvature of the DCM vary along its length. The limited number of FBG sensing nodes and linear interpolation and extrapolation for curvature with arc length does not always work well. In Fig. 11(c), the curvature shows nonlinearity of approximately 10mm from the proximal end, indicating that the curvature was not well captured at this point. The second source of error is the clearance between the shape sensor and its lumen on the DCM’s wall. While the curvature readings were consistent and repeatable for the five sets of experiments, the clearance between the shape sensor and its lumen may cause curvature detection error. Using more FBG sensing nodes may improve the accuracy for curvature estimation; however, as mentioned in Sec. III-A, the number of FBG sensing nodes is restricted by the bandwidth of the interrogator and the wavelength range for each sensing node.
The most desirable placement for the shape sensors is along the neutral axis of the DCM. This will cause maintaining the shape sensor length and position during bending. However, doing so may reduce the stiffness of the DCM, which would limit its effectiveness for the motivating orthopedic surgery.
B. Hysteresis
Hysteresis was observed in all groups of free bending experiments (Fig. 8). The distal tip, shape curves, and curvature for each pair of position all vary. The major difference in bending and straightening is observed at the proximal end of the DCM (Fig. 9). A major reason for this behavior, among others, may be the local friction force between the DCM slots and the drive cable during bending/straightening cycles.
C. Tracking Performance With Obstacles
Form the tip tracking error listed in Table 2 and the shape overlay in Fig. 10, it can be seen that the tracking method remains effective even when there is an obstacle in the path of bending. For identical cable pulls, the tracking error in presence of obstacles is larger than free bending. This may be caused by the clearance between the shape sensor and its lumen. Even more so for the S shape observed in Fig 10, the clearance will cause varying interaction between the shape sensor and its lumen, from the one obtained during calibration.
Figure 11(a) shows that the shape sensor can capture the S shape. From the image extracted curvature, there is an inflection point with zero curvature and the shape sensor successfully captures this inflection point. Figure 11(b) also has an inflection point, but the shape sensor does not accurately capture this point. Therefore, the S shape is not significant than that from the image. There is no inflection point on Fig 11(c). The presence of an inflection point is determined by the obstacle’s position and stiffness of the DCM. The curvature tendency for case III is significantly different from the obstacle setups of I and II. For case III, the largest curvature occurs near the proximal end, and is not directly captured by the shape sensors. However, the overall accuracy for case III is better than cases I and II.
D. Large Deflection
During the experiments, two shape sensors were observed to move along their lumens through the DCM wall. The distance the shape sensor travelled may be estimated to be the same as that of the drive cable because the drive cable and shape sensor lumens along the DCM wall are parallel. The average strain for 6 points are 0%, 2.29%, 4.57%, 6.86%, 9.14% and 11.43%. In this paper, 1% from the FBG manufacture (Technica Optical Components, China) is set for the safe working strain of FBG optical fibers. The sensor will break under this strain, if the FBG optical fiber is fixed to the surface of the DCM. This proves that a novel large deflection shape sensing is necessary for this variation of DCM.
E. The Influence of Temperature
The difference between the inside and outside body temperatures during the surgery, in addition to operations such as tissue cutting or water injection, may create a temperature gradient along sensor nodes. The shape reconstruction method as described in this paper may possibly compensate for such changes if the two adjacent FBG sensors are close enough with insignificant temperature gradient. The thermal conductivity of NiTi used as for the DCM body will help to minimize the temperature gradient along the sensor nodes. The structure and thermal sensitivity of both shape sensors used were similar to those in [25] and [26]. Moreover, there will be an opposite effect on wavelength shift at each of the sensors. This is because one sensor will be in compression (the inner side) and the opposing side’s sensor (outer side) will be in tension. Therefore, the overall effect on the centerline may be reduced. Further study on the amount of temperature rise during the surgery may be required to justify these arguments.
VII. Conclusion
This paper demonstrates the feasibility of large deflection shape tracking for a 35mm length DCM using two shape sensors. The tracking scheme could well capture the DCM the shape for both free bending and bending with obstacles in the path. For the free bending case, the distal tip tracking accuracy was 0.28±0.20mm for bending, 0.48±0.34mm for straightening and 0.40±0.30 mm for bending/straightening cycle. The normalized accuracy was 1.1%+0.86%, and the maximum error was 3.4%. Hysteresis was observed during the bending/straigtening cycle and accurately captured with the shape sensors. For the cases with obstacles, the tracking accuracy was 0.61±0.15mm, 0.93±0.05mm and 0.23±0.10mm as obstacle was placed from distal to proximal location with respect to the DCM. The normalized accuracy was 1.7%±0.4%, 2.7%±0.2%, and 0.7%±0.3% respectively. The maximum error was 3.0%. This technique promises accurate tracking of the DCM for use in minimally invasive surgery; especially when working with large bending curvatures. Real-time shape tracking using FBG sensors combined with occasional accuracy verification (and possibly re-calibration) using x-ray images, may provide means for accurate, real-time, control of the DCM during minimally- and less-invasive procedures, and specifically for the treatment of osteolysis during Total Hip Replacement.
Acknowledgments
The authors would like to thank A. Gao for assisting with the experiments and Prof. Y. Otake for providing the 2D–3D image registration algorithm used for the performance evaluation of shape sensing. This work was done at the Laboratory for Computational Sensing and Robotics (LCSR), Johns Hopkins University, when Dr. Hao Liu worked there as a visiting scholar.
This work was supported in part by the National Institutes of Health (NIH) under Grant R01 EB016703 and in part by the JHU/APL Internal Research Funding (IRAD) and NIH under Grant R01 CA111288. The work of H. Liu was supported in part by the National Natural Science Foundation of China under Grant 61473281 and in part by the China Scholarship Council under Grant 201304910075. The associate editor coordinating the review of this paper and approving it for publication was Dr. Nitaigour P. Mahalik.
Biographies

Hao Liu received the B.S., M.S., and Ph.D. degrees in mechanical engineering from the Harbin Institute of Technology in China, in 2004, 2006, and 2010, respectively. He was a Visiting Scholar under the supervision of Dr. R. H. Taylor with LCSR, Johns Hopkins University, from 2014 to 2015. He is currently an Associate Professor with the Shenyang Institute of Automation, Chinese Academy of Sciences. His research interests include surgical robots, medical sensors, surgical navigation, and robot control.
Amirhossein Farvardin received the B.S. degree in biomedical engineering from the Worcester Polytechnic Institute, in 2014. He is currently pursuing the Ph.D. degree at the Department of Mechanical Engineering, Johns Hopkins University. He is also with the Biomechanical and Image-Guided Surgical Systems Laboratory, part of the Laboratory for Computational Sensing and Robotics. His research interests include medical robotics, finite element analysis, biomechanics, and biomaterials.
Robert Grupp received the B.S. degree in mathematics and computer science from the University of Maryland, College Park, in 2007, and the M.S. degree in computer science from Johns Hopkins University, in 2010. He is currently pursuing the Ph.D. degree at the Department of Computer Science and the Laboratory for Computational Sensing and Robotics, Johns Hopkins University. His research interests include medical image analysis, medical robotics, and computer integrated surgery.

Ryan J. Murphy received the Ph.D. degree in mechanical engineering from Johns Hopkins University, in 2015. He is currently with the Biomechanical- and Image-Guided Surgical Systems Laboratory, part of the Laboratory for Computational Sensing and Robotics. He is also a Senior Professional Staff Member with the Applied Physics Laboratory, Johns Hopkins University, Laurel, MD. His research interests include medical robots, robot-and computer-assisted surgery, robot kinematics and dynamics, systems and software engineering, and biomechanics.

Russell H. Taylor received the Ph.D. degree in computer science from Stanford University, in 1976. After working as a Research Staff Member and Research Manager with IBM Research from 1976 to 1995, he joined Johns Hopkins University, where he is the John C. Malone Professor of Computer Science with joint appointments in Mechanical Engineering, Radiology, and Surgery, and is also the Director of the Engineering Research Center for Computer-Integrated Surgical Systems and Technology and the Laboratory for Computational Sensing and Robotics. He has authored over 375 peer-reviewed publications and book chapters, and has received numerous awards and honors.
Iulian Iordachita (M’08–SM’14) received the B.Eng. degree in mechanical engineering, the M.Eng. degree in industrial robotics, and the Ph.D. degree in mechanical engineering from the University of Craiova, Romania, in 1984, 1989, and 1996, respectively. He is currently a Research Faculty Member with the Mechanical Engineering Department, Whiting School of Engineering, Johns Hopkins University, a Faculty Member with the Laboratory for Computational Sensing and Robotics, and the Director of the Advanced Medical Instrumentation and Robotics Research Laboratory. His current research interests include medical robotics, image guided surgery, robotics, smart surgical tools, and medical instrumentation.

Mehran Armand received the Ph.D. degree in mechanical engineering and the Ph.D. degree in kinesiology from the University of Waterloo, ON, Canada, with a focus on bipedal locomotion. He is currently a Principal Scientist and holds joint appointments with Mechanical Engineering and Orthopaedic Surgery. Prior to joining JHU/APL in 2000, he completed postdoctoral fellowships at JHU Orthopaedic Surgery and Otolaryngology-head and neck surgery. He currently directs the collaborative Laboratory for Biomechanical and Image-Guided Surgical Systems, Laboratory for Computational Sensing and Robotics, JHU/Whiting School of Engineering.
Contributor Information
Hao Liu, Email: liuhao.hit@gmail.com, State Key Laboratory of Robotics, Shenyang Institute of Automation, Chinese Academy of Sciences, Shenyang 100080, China, and also with the Laboratory for Computational Sensing and Robotics, Johns Hopkins University, Baltimore, MD 21218 USA.
Amirhossein Farvardin, Email: afarvar1@jhu.edu, Laboratory for Computational Sensing and Robotics, Johns Hopkins University, Baltimore, MD 21218 USA.
Robert Grupp, Email: grupp@jhu.edu, Laboratory for Computational Sensing and Robotics, Johns Hopkins University, Baltimore, MD 21218 USA.
Ryan J. Murphy, Email: ryan.murphy@jhuapl.edu, Applied Physics Laboratory, Johns Hopkins University, Baltimore, MD 21218 USA
Russell H. Taylor, Email: rht@jhu.edu, Laboratory for Computational Sensing and Robotics, Johns Hopkins University, Baltimore, MD 21218 USA.
Iulian Iordachita, Email: iordachita@jhu.edu, Laboratory for Computational Sensing and Robotics, Johns Hopkins University, Baltimore, MD 21218 USA.
Mehran Armand, Email: mehran.armand@jhuapl.edu, Laboratory for Computational Sensing and Robotics, Johns Hopkins University, Baltimore, MD 21218 USA, and also with the Applied Physics Laboratory, Johns Hopkins University, Baltimore, MD 21218 USA.
References
- 1.Webster RJ, Romano JM, Cowan NJ. Mechanics of precurved-tube continuum robots. IEEE Trans Robot. 2009 Feb;25(1):67–78. [Google Scholar]
- 2.Camarillo DB, Milne CF, Carlson CR, Zinn MR, Salisbury JK. Mechanics modeling of tendon-driven continuum manipulators. IEEE Trans Robot. 2008 Dec;24(6):1262–1273. [Google Scholar]
- 3.Simaan N, Taylor R, Flint P. Medical Image Computing and Computer-Assisted Intervention. Berlin, Germany: Springer-Verlag; 2004. High dexterity snake-like robotic slaves for minimally invasive telesurgery of the upper airway; pp. 17–24. [Google Scholar]
- 4.Sears P, Dupont PE. Inverse kinematics of concentric tube steerable needles. Proc. IEEE Int. Conf. Robot. Autom; Apr. 2007; pp. 1887–1892. [DOI] [PMC free article] [PubMed] [Google Scholar]
- 5.Vaida C, Plitea N, Pisla D, Gherman B. Orientation module for surgical instruments—A systematical approach. Meccanica. 2013 Jan;48(1):145–158. [Google Scholar]
- 6.Ikuta K, Yamamoto K, Sasaki K. Development of remote microsurgery robot and new surgical procedure for deep and narrow space. Proc. IEEE Int. Conf. Robot. Autom. (ICRA); Sep, 2003. pp. 1103–1108. [Google Scholar]
- 7.Kutzer MDM, Segreti SM, Brown CY, Armand M, Taylor RH, Mears SC. Design of a new cable-driven manipulator with a large open lumen: Preliminary applications in the minimally-invasive removal of osteolysis. Proc. IEEE Int. Conf. Robot. Autom. (ICRA); May 2011; pp. 2913–2920. [Google Scholar]
- 8.Murphy RJ, Moses MS, Kutzer MDM, Chirikjian GS, Armand M. Constrained workspace generation for snake-like manipulators with applications to minimally invasive surgery. Proc. IEEE Int. Conf. Robot. Autom. (ICRA); May 2013; pp. 5341–5347. [Google Scholar]
- 9.Engh CA, Jr, Egawa H, Beykirch SE, Hopper RH, Jr, Engh CA. The quality of osteolysis grafting with cementless acetabular component retention. Clin Orthopaedics Rel Res. 2007 Dec;465:150–154. doi: 10.1097/BLO.0b013e3181576097. [DOI] [PubMed] [Google Scholar]
- 10.Murphy RJ, Kutzer MDM, Segreti SM, Lucas BC, Armand M. Design and kinematic characterization of a surgical manipulator with a focus on treating osteolysis. Robotica. 2014;36(6):835–850. [Google Scholar]
- 11.Otake Y, Murphy RJ, Kutzer MD, Taylor RH, Armand M. Piecewise-rigid 2D-3D registration for pose estimation of snake-like manipulator using an intraoperative X-ray projection. Proc SPIE, Med Imag. 2014 Mar;9036:90360Q. [Google Scholar]
- 12.Cianchetti M, Renda F, Licofonte A, Laschi C. Sensorization of continuum soft robots for reconstructing their spatial configuration. Proc. 4th IEEE RAS EMBS Int. Conf. Biomed. Robot. Biomechatronics; Jun. 2012; pp. 634–639. [Google Scholar]
- 13.Shapiro Y, Kósa G, Wolf A. Shape tracking of planar hyper-flexible beams via embedded PVDF deflection sensors. IEEE/ASME Trans Mechatronics. 2014 Aug;19(4):1260–1267. [Google Scholar]
- 14.Yi X, Qian J, Shen L, Zhang Y, Zhang Z. An innovative 3D colonoscope shape sensing sensor based on FBG sensor array. Proc. Int. Conf. Inf. Acquisition (ICIA); Jul. 2007; pp. 227–232. [Google Scholar]
- 15.Park YL, et al. Real-time estimation of 3-D needle shape and deflection for MRI-guided interventions. IEEE/ASME Trans Mechatronics. 2010 Dec;15(6):906–915. doi: 10.1109/TMECH.2010.2080360. [DOI] [PMC free article] [PubMed] [Google Scholar]
- 16.Roesthuis RJ, Kemp M, van den Dobbelsteen JJ, Misra S. Three-dimensional needle shape reconstruction using an array of fiber Bragg grating sensors. IEEE/ASME Trans Mechatronics. 2013 Aug;19(4):1115–1126. [Google Scholar]
- 17.MacPherson WN, et al. Tunnel monitoring using multicore fibre displacement sensor. Meas Sci Technol. 2006;17(5):1180. [Google Scholar]
- 18.Chen X, Zhang C, Webb DJ, Kalli K, Peng GD. Highly sensitive bend sensor based on Bragg grating in eccentric core polymer fiber. IEEE Photon Technol Lett. 2010 Jun 1;22(11):850–852. [Google Scholar]
- 19.Araújo FM, Ferreira LA, Santos JL, Farahi F. Temperature and strain insensitive bending measurements with D-type fibre Bragg gratings. Meas Sci Technol. 2001;12(7):829. [Google Scholar]
- 20.Moore JP, Rogge MD. Shape sensing using multi-core fiber optic cable and parametric curve solutions. Opt Exp. 2012;20(3):2967–2973. doi: 10.1364/OE.20.002967. [DOI] [PubMed] [Google Scholar]
- 21.Moon H, Jeong J, Kang S, Kim K, Song YW, Kim J. Fiber-Bragg-grating-based ultrathin shape sensors displaying single-channel sweeping for minimally invasive surgery. Opt Lasers Eng. 2014 Aug;59:50–55. [Google Scholar]
- 22.Farvardin A, Liu H, Pedram SA, Iordachita II, Taylor RH, Armand M. Large deflection shape sensing of a continuum manipulator for minimally-invasive surgery. Proc. IEEE Int. Conf. Robot. Autom. (ICRA); May, 2015. pp. 120–126. [DOI] [PMC free article] [PubMed] [Google Scholar]
- 23.He X, Handa J, Gehlbach P, Taylor R, Iordachita I. A submillimetric 3-DOF force sensing instrument with integrated fiber Bragg grating for retinal microsurgery. IEEE Trans Biomed Eng. 2014 Feb;61(2):522–534. doi: 10.1109/TBME.2013.2283501. [DOI] [PMC free article] [PubMed] [Google Scholar]
- 24.Measures RM. Structural Monitoring With Fiber Optic Technology. New York, NY, USA: Academic; 2001. [Google Scholar]
- 25.Lee CH, Kim MK, Kim KT, Lee J. Enhanced temperature sensitivity of fiber Bragg grating temperature sensor using thermal expansion of copper tube. Microw Opt Technol Lett. 2011;53(7):1669–1671. [Google Scholar]
- 26.Esposito M, et al. Fiber Bragg grating sensors to measure the coefficient of thermal expansion of polymers at cryogenic temperatures. Sens Actuators A, Phys. 2013 Jan;189:195–203. [Google Scholar]


